Original article
Elevated HOX gene expression in acute myeloid leukemia is associated with NPM1 mutations and poor survival
Ádám Nagy
a,b, Ágnes Osz }
a,b, Jan Budczies
c, Szilvia Krizsán
d, Gergely Szombath
e, Judit Demeter
f, Csaba Bödör
d, Balázs Gy} orffy
a,b,⇑aMTA TTK Lendület Cancer Biomarker Research Group, Hungarian Academy of Sciences Research Centre for Natural Sciences, Institute of Enzymology, Magyar Tudósok körútja 2, 1117 Budapest, Hungary
bSemmelweis University 2nd Dept. of Pediatrics, T}uzoltó utca 7-9, 1094 Budapest, Hungary
cInstitute of Pathology, University Hospital Heidelberg, Heidelberg, Germany
dMTA-SE Lendület Molecular Oncohematology Research Group, 1st Department of Pathology, and Experimental Cancer Research, Semmelweis University, Budapest, Hungary
e3rd Department of Internal Medicine, Semmelweis University, Budapest, Hungary
f1st Department of Internal Medicine, Semmelweis University, Budapest, Hungary
h i g h l i g h t s
The nucleophosmin 1 gene is a frequently mutated gene in acute myeloid leukemia.
NPM1 mutation status was connected with a gene expression signature.
HOX genes and their co-factors significantly upregulated in NPM1 mutant tumors.
The expression of these genes also correlated to survival.
HOX genes with co-factors can be therapeutic targets in NPM1 mutated AML patients.
g r a p h i c a l a b s t r a c t
a r t i c l e i n f o
Article history:
Received 19 March 2019 Revised 27 May 2019 Accepted 28 May 2019 Available online 11 June 2019
Keywords:
Acute myeloid leukemia Mutation
Gene expression Clinical samples HOX genes Survival
a b s t r a c t
Acute myeloid leukemia (AML) is a clonal disorder of hematopoietic progenitor cells and the most com- mon malignant myeloid disorder in adults. Several gene mutations such as in NPM1 (nucleophosmin 1) are involved in the pathogenesis and progression of AML. The aim of this study was to identify genes whose expression is associated with driver mutations and survival outcome. Genotype data (somatic mutations) and gene expression data including RNA-seq, microarray, and qPCR data were used for the analysis. Multiple datasets were utilized as training sets (GSE6891, TCGA, and GSE1159). A new clinical sample cohort (Semmelweis set) was established forin vitrovalidation. Wilcoxon analysis was used to identify genes with expression alterations between the mutant and wild type samples. Cox regression analysis was performed to examine the association between gene expression and survival outcome.
Data analysis was performed in the R statistical environment. Eighty-five genes were identified with sig- nificantly altered expression when comparing NPM1 mutant and wild type patient groups in the GSE6891 set. Additional training sets were used as a filter to condense the six most significant genes
https://doi.org/10.1016/j.jare.2019.05.006
2090-1232/Ó2019 The Authors. Published by Elsevier B.V. on behalf of Cairo University.
This is an open access article under the CC BY-NC-ND license (http://creativecommons.org/licenses/by-nc-nd/4.0/).
Abbreviations:AML, acute myeloid leukemia; qPCR, quantitative polymerase chain reaction; NCBI GEO, National Center for Biotechnology Gene expression Omnibus;
TCGA, The Cancer Genome Atlas; HOX, homeobox; PBX, pre-B-cell leukemia homeobox; MEIS, myeloid ecotropic viral integration site; FAB classification, French–American–
British classification; WHO, World Health Organization; ITD, internal tandem duplication; OS, overall survival; HR, hazard ratio; FC, fold change.
Peer review under responsibility of Cairo University.
⇑ Corresponding author.
E-mail address:gyorffy.balazs@ttk.mta.hu(B. Gy}orffy).
Contents lists available atScienceDirect
Journal of Advanced Research
j o u r n a l h o m e p a g e : w w w . e l s e v i e r . c o m / l o c a t e / j a r e
associated with NPM1 mutations. Then, the expression changes of these six genes were confirmed in the Semmelweis set: HOXA5 (P= 3.06E12, FC = 8.3), HOXA10 (P= 2.44E09, FC = 3.3), HOXB5 (P= 1.86E13, FC = 37), MEIS1 (P= 9.82E10, FC = 4.4), PBX3 (P= 1.03E13, FC = 5.4) and ITM2A (P= 0.004, FC = 0.4). Cox regression analysis showed that higher expression of these genes – with the exception of ITM2A – was associated with worse overall survival. Higher expression of the HOX genes was identified in tumors harboring NPM1 gene mutations by computationally linking genotype and gene expression.In vitrovalidation of these genes supports their potential therapeutic application in AML.
Ó2019 The Authors. Published by Elsevier B.V. on behalf of Cairo University. This is an open access article under the CC BY-NC-ND license (http://creativecommons.org/licenses/by-nc-nd/4.0/).
Introduction
Acute myeloid leukemia (AML) is characterized by clonal prolif- eration of myeloid blasts. Based on statistical data, AML represents approximately 1.1% of all new cancer cases in the U.S. and is more common in older adults and males. The death rate is higher among patients over 65 years and unfortunately, the rate has failed to decrease in recent years [1]. Chromosomal structural variations and genetic abnormalities play an essential role in the pathogene- sis of AML[2]. According to The Cancer Genome Atlas project, the five most common mutated genes in AML comprise NPM1, IDH1, IDH2, DNMT3A, and FLT3 [3]. Isocitrate dehydrogenase 1/2 (IDH1/2) mutations occur in approximately 15% of AML patients, and the frequency increases with age [4]. Mutations in IDH1/2 are associated with DNA and histone hypermethylation, altered gene expression and blocked differentiation of hematopoietic pro- genitor cells [5]. The FMS-like tyrosine kinase 3 (FLT3) gene encodes a class III receptor tyrosine kinase that regulates hemato- poiesis, including differentiation and proliferation of stem cells[6].
FLT3 mutations are correlated with worse clinical outcome in younger adults [7]. Activating mutations in the tyrosine kinase domain (TKD) of FLT3 exist in 15% of patients with AML.
The nucleophosmin gene (NPM1) is one of the most frequently mutated genes in AML[8]. The normal function of NPM1 is to control ribosome formation and export, stabilize the oncosuppressor p14Arf protein in the nucleolus and regulate centrosome duplica- tion[9]. Mutations in NPM1 were found in 20–30% of AML patients.
These alterations induce abnormal cytoplasmic localization of the protein which is a critical step in leukemogenesis[8]. NPM1 muta- tions are restricted to myeloid cells, and aberrant cytoplasmic dislo- cation was not observed in lymphoid cells, including the reactive lymph nodes or B and T cells from bone marrow biopsies or periph- eral blood[10]. NPM1 mutations are frequently associated with internal tandem duplication (ITD) of FLT3 and DNMT3A mutations [11,12]. In addition, besides the FLT3-ITD and DNMT3A mutations, NPM1 mutations also co-occur with IDH1, IDH2, and TET2 muta- tions[13]. There are mutations that rarely occur with NPM1 muta- tions, such as partial tandem duplication in the mixed lineage leukemia (MLL) gene and mutations in RUNX1, CEBPA, and TP53 genes[3]. FLT3 tyrosine kinase domain (TKD) mutations are rarely accompanied by NPM1 mutations[14]. A previous study described favorable prognosis of NPM1 mutated AML patients with normal karyotype[15]. Another study demonstrated that karyotype, age, NPM1 mutation status, white blood cell count, lactate dehydroge- nase, and CD34 expression were independent prognostic markers for overall survival[16]. A previous study also demonstrated that IDH1 mutations are associated with favorable survival outcome in NPM1 mutant/FLT3-ITD-negative patients [17]. Currently, chemotherapy in younger and fit patients is still the primary treat- ment for AML patients. Chemotherapy generally includes a combi- nation of an anthracycline, such as daunorubicin[18]or idarubicin [19], and cytarabine[20]agents. Of note, NPM1 mutated AML is highly responsive to induction chemotherapy[21], and up to 80%
of patients experience complete remission with clearance of leuke- mic cells 16 days after starting a treatment[22]. In the last decade,
several molecularly targeted agents were proposed for the treatment of AML, including tyrosine kinase inhibitors, such as sor- afenib[23], midostaurin[24], quizartinib[25], and crenolanib[26]
which inhibit the tyrosine kinase domain of the FLT3 kinase. STAT3 inhibitors, including C188-9[27]and OPB-31121[28], specifically inhibit the phosphorylation of STAT3 protein, which is highly upreg- ulated in up to 50% of AML patients and is associated with poor prog- nosis. There are several additional targeted agents, such as IDH1 and IDH2 inhibitors[29,30], nuclear export inhibitors[31]and CD33 and CD123 antigen specific inhibitors[32].
The aim was to examine the transcriptomic fingerprint of NPM1 gene mutations to shed light on transformed molecular pathways.
First, genes showing altered expression in NPM1 mutated patients were identified and correlated these findings to different survival outcomes in multiple different genome-wide training sets. The best hits were validated in an independent set of patients.
Material and methods
The analysis was based on utilizing a training and a validation set (Fig. 1A). Data processing was performed in the R v3.2.3 statis- tical environment (http://www.r-project.org).
Preprocessing of the training set
A suitable training AML dataset with available gene expression and clinical data was searched in the NCBI GEO repository (http://
www.ncbi.nlm.nih.gov/geo/). The keywords ‘‘AML,” ‘‘GPL570” and
‘‘GPL96” were utilized, and we filtered for those datasets that included raw gene expression data and clinical information for the same patients. Array quality control was performed for all sam- ples using the ‘‘yaqcaffy” (http://bioconductor.org/packages/
yaqcaffy/) library. The background, the raw Q, the percentage of present calls, the presence of BioB-/C-/D- spikes, the GAPDH 3’ to 5’ ratio and the beta-actin 3’–5’ ratio were assessed and used only those arrays that passed the preset quality criteria. The MAS5 algo- rithm by the ‘‘affy” (http://bioconductor.org/packages/affy/) library was used to normalize the data. An additional second scaling nor- malization was made to set the mean expression on each array to 1000. For genes measured by various probe sets, we employed JetSet to choose the most trustworthy probe set[33].
RNA-seq and mutation data of AML patients
Two additional datasets were used for training, a gene-chip dataset (processed as described above) and an RNA-seq dataset.
In the RNA-seq dataset, the somatic mutation data were obtained from The Cancer Genome Atlas (TCGA,https://cancergenome.nih.
gov/). The preprocessed and annotated MAF (Mutation Annotation Format) data files were used generated by MuTect2, MUSE, VarScan and SomaticSniper pipelines. The ‘‘maftools” package (http://bioconductor.org/packages/maftools/) was applied for aggregation and visualization of mutation data.
The htseq counts RNA-seq data generated by the Illumina HiSeq 2000 RNA Sequencing version 2 platform was used for
gene expression estimation. The ‘‘AnnotationDbi” package (http://
bioconductor.org/packages/AnnotationDbi/) was applied to anno- tate Ensembl transcript IDs with gene symbols (n = 25,228). The
‘‘DESeq” package based on the negative binomial distribution was used to normalize the raw read counts data[34].
Semmelweis set
Clinical samples diagnosed at the 1st Department of Pathology-, and Experimental Cancer Research, Semmelweis University, Buda- pest, Hungary were utilized in thein vitrovalidation.All materials and protocols were approved by the Institutional Scientific and Research Ethics Committee of the Semmelweis University TUKEB – 14383-2/2017/EKU. Mutation status was determined by Sanger sequencing and quantitative PCR measurement was utilized to examine the gene expression changes.
DNA was isolated from peripheral blood and bone marrow sam- ples using the High Pure PCR Template Preparation Kit (Roche, Basel, Switzerland) following the manufacturer’s protocol. DNA concentration was measured by UV spectrophotometry (Nano- Drop; Thermo Fisher Scientific, Waltham, Massachusetts, USA).
RNA isolation
The peripheral blood and bone marrow samples were homoge- nized for 2 h using hemolysis solution containing 0.15 M NH4Cl, 10 M NH4HCO3, and 0.1 M EDTA with a pH of 7.4 (Sigma-Aldrich, St. Louis, MO, USA). After hemolysis, samples were centrifuged at 1800 RPM for 10 min and washed with 1x phosphate-buffered sal- ine (PBS; Lonza, Basel, Switzerland). Total RNA was isolated from cells using TRIzol Reagent (Invitrogen, Waltham, Massachusetts, USA) following the manufacturer’s protocol. RNA concentration was measured by UV spectrophotometry (NanoDrop; Thermo Fisher Scientific, Waltham, Massachusetts, USA).
Sanger sequencing
The amplification of NPM1 was performed using AmpliTaqGold (Thermo Fisher Scientific, Waltham, Massachusetts, USA) poly- merase mix in a PE 2720 GeneAmp (Perkin-Elmer, Waltham, Massachusetts, USA) PCR machine. Forward (50- TTC CAT ACA TAC TTA AAA CCA A-30) and reverse (50- TGG TTC CTT AAC CAC ATT TCT TT30) primers were employed in a 25 mL final volume.
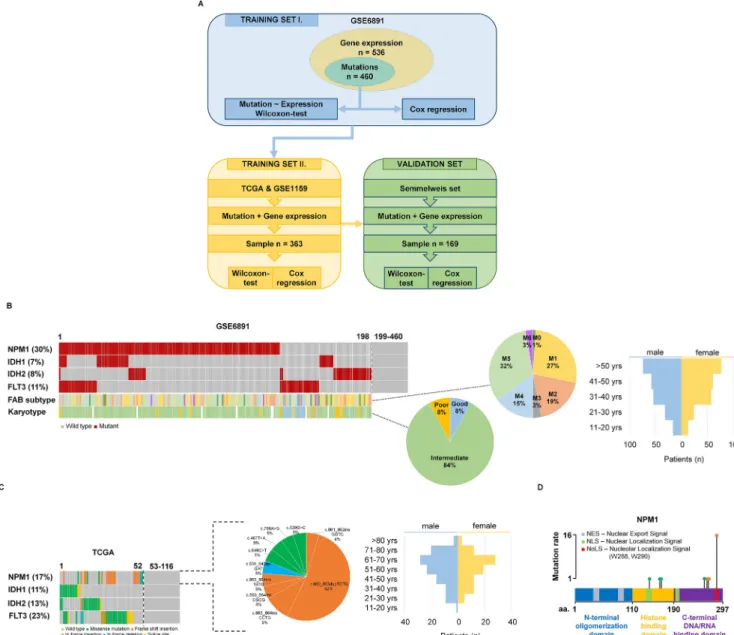
Fig. 1.Training set setup. Summary of the analysis workflow (A). Proportion of driver mutations and clinical characteristics of the training sets GSE6891 (B) and TCGA (C).
Distribution of the NPM1 mutation localizations in the TCGA samples (D).
The reaction mix contained 2x AmpliTaqGold mix, 400 nM of each primer and 100 ng of DNA. Amplification started with denaturation for 10 min at 95°C, and then 95°C for 30 sec, 56°C for 60 sec and 72°C for 60 sec were repeated for 40 cycles. The PCR products were cleaned using ExoSAP-IT PCR Product Cleanup (Affymetrix, Santa Clara, California USA), and trailed using the Big Dye Terminator kit v3.1 (Thermo Fisher Scientific, Waltham, Massachusetts, USA) direct sequencing reaction following the manufacturer’s protocol.
For sequencing analysis an ABI 3500 Genetic Analyzer (Thermo Fisher Scientific, Waltham, Massachusetts, USA) machine was used, and the results were visualized using SeqA6 (Thermo Fisher Scien- tific, Waltham, Massachusetts, USA) software.
Quantitative PCR measurement
For qPCR analysis, 1mg of total RNA from each sample was tran- scribed in a final volume of 25mL using the High-Capacity cDNA Reverse Transcription Kit (Thermo Fisher Scientific, Waltham, Mas- sachusetts, USA). Quantitative PCR was performed using the CFX96 Real-Time PCR Machine (Bio-Rad Laboratories, Hercules, California, USA) and SensiFAST SYBR No-ROX Kit (Bioline Reagents, London, UK).
Primers were designed on exon-exon junctions and covering all transcript variants of each selected gene. GAPDH and TBP genes were used as reference genes (Table 1).
The reactions were performed in a 20mL final volume, contain- ing 1mL of cDNA, diluted 2-fold, and 125 nM of each primer. After a preliminary denaturation step of 2 min at 95°C, 40 cycles with three steps were performed: 95°C for 15 sec, 60°C for 15 sec and 72°C for 30 sec. Each sample was measured in triplicate, and the threshold cycle (Ct) was determined for each gene. The DCt method was employed to evaluate gene expression changes and we used 2(-DCt)-values of the data. WinSTAT (http://www.win- stat.com) was used to analyze the data.
Statistical computations
First, patients were divided into a mutated and a wild-type cohort based on the somatic mutation status of NPM1. Normal dis- tribution of the data was checked using the Shapiro-Wilk’s W test.
Then, Wilcoxon analysis was used to identify differentially expressed genes between the mutant and wild type cohorts. In addition, median fold change (FC) was computed for each gene
to determine the direction of the expression change. Significance was accepted for genes with less than 0.5 or higher than 2 and with a p value belowP< 0.05.
Correlation between gene expression and overall survival (OS) was computed using Cox proportional hazards regression and by plotting Kaplan-Meier survival plots. To calculate the prognostic effect of a gene, each percentile of gene expression were computed between the lower and upper quartiles and the best performing threshold was used as the final cutoff in the Cox regression analysis [35]. The ‘‘survival” R package (http://CRAN.R-project.org/pack- age=survival) was applied for Cox regression analysis and ‘‘surv- plot” R package (http://www.cbs.dtu.dk/~eklund/survplot/) to generate Kaplan-Meier plots. Finally, q-value was computed (the minimum false discovery rate at which the test may be called sig- nificant) to combat multiple hypothesis testing.
Results
Analysis of the first training cohort
The training cohort was based on 536 patients from the GSE6891 dataset[36]. The gene expression profiles of these sam- ples were determined using Affymetrix Human Genome U133 Plus 2.0 Arrays (GPL570), and we obtained both mutation and gene expression data for 460 of the 536 patients. The median follow- up for overall survival (OS) was 18.7 months.Fig. 1B andTable 2 show the clinico-pathological parameters, including age, gender, and FAB subtype. NPM1 was the most frequently mutated gene as 30% of patients harbored a mutation. When correlating survival length in the training cohort and NPM1 mutation status, no signif- icant correlation was observed (P= 0.3).
Wilcoxon analysis across all genes (12,205) identified 85 genes showing significantly altered expression in NPM1 mutant patients compared to the NPM1 wild type cohort. Of these, 57 genes were upregulated and 28 genes were downregulated. The full list of sig- nificantly altered genes is displayed in Table 3. Cox regression analysis performed for the significant genes identified a correlation with overall survival for 47 genes at an FDR below 10% (Table 4).
Selecting genes for qPCR analysis
Two additional datasets, the TCGA and the GSE1159, were used to filter the results to obtain the most reliable genes. The
Table 1
Quantitative PCR primers for selected and references genes.
Mutation Gene NCBI nucleotide sequence Primer sequence Length (bp) Temp (°C)
IDH1 RASGRP3 NM_015376.2 F: 50-CAAGCCAACCTTCTGCGAAC-30 83 60
R: 50-TGGCTCCACAGTCTTTGCAT-30
IDH2 NPDC1 NM_015392.3 F: 50-GACTACGCCACTGCGAAGG-30 139 60
R: 50-CTTTATGCCGCTCCAGGCAC-30
NPM1 HOXA5 NM_019102.3 F: 50-AGCTGCACATAAGTCATGACAACA-30 136 60
R: 50-TCAATCCTCCTTCTGCGGGT-30
NPM1 HOXB5 NM_002147.3 F: 50-AACTCCTTCTCGGGGCGTTAT-30 138 60
R: 50-CATCCCATTGTAATTGTAGCCGT-30
NPM1 HOXA10 NM_018951.3 F: 50-GAGAGCAGCAAAGCCTCGC-30 127 60
R: 50-CCAGTGTCTGGTGCTTCGTG-30
NPM1 ITM2A NM_001171581.1 F: 50-TGTTGCTGGGGAACTGCTAT-30 102 60
R: 50-GATATCTGCCACTCGCCAGTTT-30
NPM1 MEIS1 NM_002398.2 F: 50-CACGGGACTCACCATCCTTC-30 99 60
R: 50-TGACTTACTGCTCGGTTGGAC-30
NPM1 PBX3 NM_006195.5 F: 50-CACACCTCAGCAACCCCTAC-30 90 60
R: 50-ACCAATTGGATACCTGTGACACT-30
– GAPDH NM_002046.6 F: 50-AAATCAAGTGGGGCGATGCT-30 86 60
R: 50-CAAATGAGCCCCAGCCTTCT-30
– TBP NM_003194.4 F: 50-GCACAGGAGCCAAGAGTGAA-30 127 60
R: 50-TCACAGCTCCCCACCATGT-30 Annealing temperature (Temp) calculation was executed using NCBI Primer Blast (www.ncbi.nlm.nih.gov/tools/primer-blast/).
TCGA repository has 200 AML patients of which 152 patients had RNA-seq gene expression data and 149 patients had somatic mutation data (Table 2). Overall survival data were available for 175 patients, and the median follow-up time was 12 months.
There were 116 patients who had both gene expression and mutation data. Survival analysis was not performed for this data- set because less than half of the patients had simultaneous sur- vival, mutation and gene expression data. The clinical characteristics of the TCGA dataset are found in Fig. 1C and Table 2. The GSE1159 dataset [37] includes 293 patients mea- sured using Affymetrix Human Genome U133A Arrays (GPL96).
Follow-up with overall survival data was available for 260 patients. There were 247 patients with simultaneous gene expres- sion and mutation data (Table 2).
In the TCGA dataset, NPM1 mutations were found in 17% of patients, of which 75% of the mutations were frame shift inser- tions, 20% were missense and 5% were in frame deletions (Fig. 1D). Most of the frame shift insertions were localized at the nucleolar localization signal region in the C-terminal DNA/RNA binding domain of the NPM1 gene (Fig. 1D).
In the TCGA and GSE1159 datasets, 49 of the previously identi- fied 85 genes reached statistical significance. The results of the Wilcoxon test are listed inTable 5, and the results of the survival analysis inTable 6.
Table 2
Clinical characteristics of datasets.
GSE6859 TCGA GSE1159 Semmelweis set
Total number of samples 536 200 293 169
Samples with mutation & expression data 460 116 247 169
Age range (median) 15–60 (43) 18–89 (58) 15–60 (42) 0–85 (59)
Sex (F/M) 230/230 91/109 128/119 84/85
Median survival time (months) 18,7 12 17 6.92
Karyotype (good/intermediate/poor/unknown) 97/261/92/86 – 60/136/48/49 12/97/25/35
FAB subtype (M0/M1/M2/M3/M4/M5/M6) 16/95/105/24/84/104/6 – 6/55/54/17/43/62/3 –
F: female, M: male, PB: peripheral blood, BM: bone marrow.
Table 3
List of genes showing significantly altered expression when comparing NPM1 mutant and wild type cohorts in the training set.
Gene Mutant median Wild median FC P-value
HOXB3 598.5 189 3.17 5.12E45
HOXA5 2799 100 27.99 1.87E44
HOXB2 2282 220.5 10.35 2.85E43
HOXB6 1017 83.5 12.18 4.55E43
HOXA10 2952 683.5 4.32 2.22E39
PBX3 3544.5 654 5.42 5.45E39
MEIS1 2264.5 431 5.25 1.12E38
HOXB5 840.5 321.5 2.61 1.35E38
PDGFD 665.5 227.5 2.93 2.30E33
SMC4 4415 2043.5 2.16 2.75E32
COL4A5 1342.5 100.5 13.36 1.00E31
DMXL2 4371.5 1398 3.13 3.00E31
PLA2G4A 593.5 262.5 2.26 6.11E29
CD34 257.5 1854 0.14 7.04E29
APP 49 839 0.06 3.44E28
BAALC 78.5 611 0.13 3.49E28
ITM2C 834.5 2579 0.32 2.45E27
CD200 77.5 664.5 0.12 3.38E27
H2AFY2 588.5 235.5 2.5 1.41E25
CCND2 2266.5 4802.5 0.47 2.54E24
GYPC 803.5 2440.5 0.33 5.68E23
RASGRP3 1022.5 278.5 3.67 2.54E22
JUP 702 1944 0.36 6.90E22
PRKAR2B 2554 871.5 2.93 5.88E21
TSPAN13 343.5 1157.5 0.3 1.59E20
MAN1A1 1746.5 3552.5 0.49 2.11E20
ITM2A 977.5 2989 0.33 3.81E20
H1F0 562.5 2117 0.27 1.45E18
C3AR1 1880 831.5 2.26 2.43E18
BAHCC1 1864 770 2.42 2.77E18
LPAR6 318 964 0.33 3.72E18
IFITM1 1370 2974.5 0.46 4.47E18
SEL1L3 1668.5 766.5 2.18 2.28E17
LGALS3BP 2999.5 794 3.78 3.47E17
MEST 986 3028 0.33 3.88E17
HIST2H2BE 3068 1500 2.05 5.65E16
CPVL 1442.5 553.5 2.61 1.03E15
SLC38A1 818.5 1878.5 0.44 2.49E15
EGFL7 276.5 728 0.38 3.33E15
PRKD3 331 805 0.41 6.67E15
VNN1 1144 261 4.38 9.17E15
TLR4 1193 524 2.28 3.39E14
CTSG 3670 948.5 3.87 1.66E13
JAG1 1095.5 480.5 2.28 2.63E13
TNFAIP2 2286.5 1114 2.05 5.73E13
CD36 2778 1155 2.41 2.74E12
CCNA1 1382.5 476.5 2.9 7.85E12
TARP 4965.5 2317.5 2.14 1.03E11
PPBP 1487.5 332 4.48 1.08E11
EREG 1391.5 255 5.46 1.39E11
EMP1 433 1063 0.41 2.96E11
SPINK2 2270 589.5 3.85 3.75E11
CX3CR1 2901.5 893 3.25 5.75E11
MARCKS 1786.5 635.5 2.81 9.32E11
TREM1 1000.5 447 2.24 1.19E10
BCL2A1 993 446 2.23 1.35E09
WASF1 452 911.5 0.5 2.60E09
PTX3 766 368.5 2.08 2.63E09
Table 3(continued)
Gene Mutant median Wild median FC P-value
MAFB 1597.5 385.5 4.14 6.14E09
PF4 514.5 197 2.61 1.17E08
PROM1 320 1699.5 0.19 1.96E08
LILRB2 976 382.5 2.55 2.19E08
CYTL1 342.5 751.5 0.46 3.27E08
NPR3 479.5 1440 0.33 3.50E08
SERPINA1 4521 1940.5 2.33 8.33E08
HK3 1125 432.5 2.6 3.45E07
TMEM176B 744 263 2.83 4.79E07
SLC4A1 470 1161.5 0.4 6.02E07
HBB 6031 19,089 0.32 1.43E06
VCAN 2036 491.5 4.14 1.81E06
TMEM176A 619.5 302.5 2.05 3.33E06
BASP1 2885 1120 2.58 3.68E06
MPO 6784.5 15,838 0.43 4.05E06
CPA3 3423.5 1255.5 2.73 1.83E05
MYCN 839 390.5 2.15 2.42E05
MYOF 736.5 303.5 2.43 3.17E05
IFI30 4928 1872.5 2.63 3.24E05
CA1 764.5 1800 0.42 2.42E04
FCN1 2595.5 869 2.99 4.39E04
FGL2 2020 893 2.26 7.20E04
FPR1 1097 478.5 2.29 9.26E04
C5AR1 1231.5 609 2.02 1.48E03
ELANE 2086.5 4984 0.42 2.26E03
CD14 1211 359 3.37 5.38E03
S100A12 765 358 2.14 2.23E02
For qPCR measurement only those genes were selected which showed a significant gene expression change and a fold change over 2.0 or below 0.5 in each training set (n = 32). Correlation to survival was used as an additional filter (n = 19), and the pipeline of gene selection for qPCR measurement is depicted inFig. 2A.
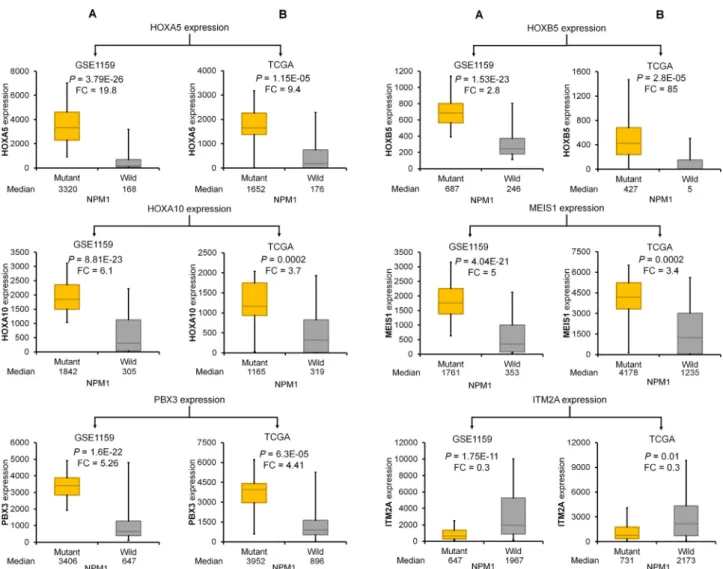
The best performing genes discriminating NPM1 mutant and wild-type samples were HOXA5, HOXB5, HOXA10, PBX3, MEIS1, and ITM2A. Of these, ITM2A was the only downregulated gene (Fig. 2G). Kaplan-Meier curves show that high expression of these genes was correlated with poor survival (Fig. 2B–F). In the case of ITM2A, lower expression was associated with worse outcome (Fig. 2G). Correlation between mutation status and expression and expression and survival in the TCGA and GSE1159 datasets for these genes is provided inFigs. 3and4, respectively.
Table 4
NPM1 mutation associated genes that expression was correlated with OS in the training set.
Gene HR P-value q-value
MPO 2.17 2.85E07 2.42E05
HOXA5 0.55 1.15E05 4.41E04
HOXA10 0.54 1.56E05 4.41E04
CD34 0.55 2.78E05 5.71E04
TARP 0.61 3.36E05 5.71E04
SPINK2 0.63 6.59E05 9.34E04
MYOF 0.62 2.27E04 2.76E03
MEIS1 0.59 3.12E04 3.31E03
SEL1L3 0.61 3.63E04 3.43E03
PRKAR2B 0.66 5.22E04 4.44E03
H2AFY2 0.67 8.56E04 6.62E03
PRKD3 0.66 1.10E03 7.81E03
PPBP 0.68 1.35E03 8.85E03
MEST 1.53 2.10E03 1.25E02
PF4 0.68 2.21E03 1.25E02
SMC4 0.7 2.75E03 1.25E02
PLA2G4A 0.7 2.81E03 1.25E02
ELANE 1.54 2.91E03 1.25E02
BASP1 0.66 2.94E03 1.25E02
MARCKS 0.69 3.31E03 1.25E02
LILRB2 0.66 3.34E03 1.25E02
H1F0 0.68 3.36E03 1.25E02
JUP 1.5 3.38E03 1.25E02
TSPAN13 0.69 3.83E03 1.36E02
FCN1 0.71 4.58E03 1.50E02
ITM2A 1.46 4.65E03 1.50E02
PBX3 0.69 4.76E03 1.50E02
BAALC 0.69 7.04E03 2.14E02
IFI30 0.68 7.80E03 2.24E02
CPVL 0.71 8.09E03 2.24E02
VNN1 0.69 8.18E03 2.24E02
CD14 0.71 8.83E03 2.34E02
HOXB5 0.73 9.86E03 2.54E02
LGALS3BP 0.72 1.13E02 2.81E02
TNFAIP2 0.72 1.21E02 2.88E02
SLC38A1 0.74 1.22E02 2.88E02
CD200 0.73 1.38E02 3.16E02
GYPC 1.34 1.41E02 3.16E02
MYCN 0.73 1.48E02 3.23E02
COL4A5 0.75 1.54E02 3.27E02
HOXB6 0.76 1.75E02 3.59E02
FPR1 0.72 1.77E02 3.59E02
RASGRP3 0.76 1.90E02 3.75E02
EREG 0.76 2.12E02 4.10E02
MAFB 0.73 2.22E02 4.19E02
EMP1 0.73 2.61E02 4.83E02
HOXB3 0.77 2.71E02 4.90E02
CTSG 0.76 3.22E02 5.71E02
CYTL1 1.35 3.33E02 5.78E02
HOXB2 0.77 4.19E02 7.02E02
EGFL7 0.76 4.21E02 7.02E02
IFITM1 0.77 4.36E02 7.09E02
MAN1A1 1.28 4.42E02 7.09E02
Table 5
List of genes that expression was significantly altered between NPM1 mutant and wild type cohorts in the TCGA(A)and GSE1159(B)datasets.
Gene Mutant median Wild median FC P-value
(A)
BAALC 41.5 1010 0.04 4.75E06
HOXA5 1651.5 175.5 9.41 1.15E05
CD34 89 9587 0.01 1.18E05
GYPC 752.5 2596.5 0.29 1.26E05
HOXB3 6453 729 8.85 1.54E05
HOXB5 426.5 5 85.3 2.75E05
HOXB6 714 7.5 95.2 3.61E05
RASGRP3 2853 693.5 4.11 5.14E05
MAN1A1 1577.5 4319.5 0.37 5.91E05
PBX3 3952 895.5 4.41 6.29E05
HOXB2 750.5 199 3.77 6.48E05
CD200 37 869 0.04 7.68E05
PDGFD 377 85.5 4.41 1.10E04
COL4A5 1769 54 32.76 1.26E04
PROM1 118 3421 0.03 1.26E04
HOXA10 1164.5 318.5 3.66 1.46E04
DMXL2 9338 4220 2.21 1.51E04
MEIS1 4178 1235 3.38 1.96E04
SMC4 5938.5 3471 1.71 2.14E04
NPR3 561.5 3175 0.18 3.67E04
ITM2C 2335 3929 0.59 4.83E04
MEST 678 1710 0.4 1.27E03
BAHCC1 14,302 5990 2.39 1.49E03
TSPAN13 133.5 405 0.33 2.20E03
TMEM176B 28.5 105.5 0.27 2.90E03
TMEM176A 17 65.5 0.26 3.04E03
JUP 2023 4307 0.47 3.22E03
APP 230 4225.5 0.05 4.07E03
PTX3 177 99 1.79 5.66E03
PLA2G4A 845.5 542.5 1.56 7.47E03
CTSG 3846.5 891 4.32 7.55E03
IFITM1 208.5 405 0.51 8.51E03
LPAR6 330 649 0.51 8.60E03
CCND2 4057.5 6980 0.58 8.98E03
SEL1L3 2942.5 1823.5 1.61 1.41E02
ITM2A 730.5 2173 0.34 1.45E02
SLC38A1 2730.5 5749.5 0.47 1.70E02
EMP1 478 698 0.68 1.93E02
EGFL7 799 1628 0.49 2.28E02
JAG1 1032 701.5 1.47 2.56E02
CCNA1 866.5 392.5 2.21 2.60E02
ELANE 2815 1644 1.71 3.66E02
TREM1 1238 565.5 2.19 4.07E02
TNFAIP2 5289 3448 1.53 4.25E02
SLC4A1 255 1005.5 0.25 4.29E02
PRKD3 898 1510.5 0.59 4.33E02
LGALS3BP 5023.5 1190 4.22 4.60E02
TARP 1053.5 503 2.09 4.72E02
HBB 3253 11122.5 0.29 4.72E02
(B)
BAALC 105 527 0.2 1.20E14
HOXA5 3320 167.5 19.82 3.79E26
CD34 310 1862 0.17 1.02E13
GYPC 814 2218.5 0.37 7.62E12
HOXB3 395 93 4.25 1.19E25
HOXB5 687 245.5 2.8 1.53E23
HOXB6 952 14.5 65.66 1.06E22
RASGRP3 743 197 3.77 1.93E11
MAN1A1 1025 2469.5 0.42 7.51E11
PBX3 3406 647 5.26 1.58E22
HOXB2 2268 245 9.26 2.71E23
CD200 69 538 0.13 1.63E16
PDGFD 573 205.5 2.79 2.23E18
COL4A5 1161 99 11.73 1.03E17
PROM1 288 1468 0.2 2.68E05
HOXA10 1842 304.5 6.05 8.81E23
DMXL2 3644 1164.5 3.13 1.03E17
MEIS1 1761 352.5 5 4.04E21
SMC4 3502 1565.5 2.24 5.65E20
NPR3 440 1493 0.29 7.34E06
ITM2C 712 2538 0.28 3.27E17
MEST 948 2877 0.33 1.20E12
Correlation between NPM1 mutation and mutations in other genes
The prevalence of NPM1 mutation was compared to IDH1, IDH2, and FLT3 mutation status in the training and validation sets by Chi-square analysis. In the training set, the correlation to IDH1 and FLT3 was significant (chi-stat = 44.7, P< 0.00001 and chi- stat = 9.2,P= 0.0024, respectively) while the correlation to IDH2 was not significant. Similarly, in the validation set, the correlation to IDH1 and FLT3 were significant (chi-stat = 5.03,P= 0.024 and
chi-stat = 8.2,P= 0.0041, respectively), and IDH2 was not signifi- cant. Important to note that only 89 patients had simultaneous mutation state for each gene in the validation set.
Validation of target genes by qPCR in the Semmelweis set
Mutation data were available for all patients in our clinical sam- ple cohort. In this group, the NPM1 gene was mutated in 25% of patients (Fig. 5A). The FLT3, IDH2, and IDH1 genes harbored a mutation in 25%, 14%, and 5% of patients, respectively. The muta- tion frequency was independent of the sample origin, including bone marrow and blood(data not shown).
The Semmelweis set contains 169 AML patients (Fig. 1A);
52.6% of the samples were obtained from bone marrow and 47.4% of the samples were collected from peripheral blood. All samples have overall survival data with a median follow-up time of 6.92 months. Similar to the training sets, most patients have intermediate cytogenetic risk (Fig. 5A). Additional clinico- pathological characteristics of the samples are displayed in Fig. 5A–D and Table 2. When analyzing the mutation status of NPM1 in the Semmelweis set, no significant correlation to overall survival was observed (P= 0.4).
The most significant genes associated with NPM1 mutations as observed in the training sets was validated by qPCR. The expres- sions of HOXA5 (P= 3.06E12, FC = 8.3), HOXA10 (P= 2.44E09, FC = 3.3), HOXB5 (P= 1.86E13, FC = 37), MEIS1 (P= 9.82E10, FC = 4.4) and PBX3 (P= 1.03E13, FC = 5.4) genes were signifi- cantly higher while the expression of the ITM2A (P= 0.004, FC = 0.4) gene was significantly lower in the NPM1 mutant patient cohort (Fig. 5E–J). Finally, the survival analysis provided a signifi- cant association between the expression of the HOXA5, HOXA10, PBX3, and MEIS1 genes and overall survival in the validation cohort (Fig. 5E–I).
Correlation between HOX genes and co-factors
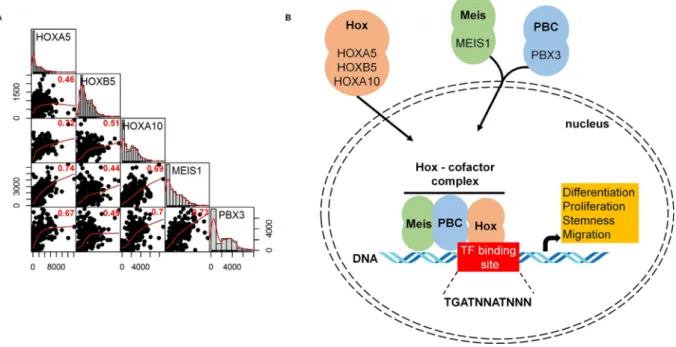
Pearson’s rank correlation was computed to examine the rela- tion of gene expression between HOX, MEIS, and PBX genes. All theP-values were less than 2.2E16. High correlation was found between HOXA5 and HOXA10, HOXA5 and MEIS1, HOXA10 and MEIS1, HOXA10 and PBX3, and MEIS1 and PBX3 genes (Fig. 6A).
In Fig. 6B, the potential interplay between HOX genes and co-factors (PBX3 and MEIS1) in the cell is displayed.
Discussion
Genes showing altered expression with NPM1 somatic muta- tions and altered survival were identified in AML. Interestingly, NPM1 mutation statusper sewas not correlated to survival neither in the training nor in the validation set. The final set of NPM1-assicated genes is established in four independent datasets (three previously published genomic sets and one clinical sample set collected at the Semmelweis University). The results demon- strate that the HOXA5, HOXB5, HOXA10, PBX3, MEIS1, and ITM2A genes show the highest expression change when comparing NPM1 mutant and wild type cohorts. Of these genes, HOXA5, HOXB5, HOXA10, PBX3, and MEIS1 were upregulated, and the ITM2A gene was downregulated in the NPM1 mutant tumors. With the excep- tion of ITM2A, higher expression was also correlated with poor prognosis.
Homeobox genes are members of transcription factor families that are grouped into four main clusters (HOXA-D) on four differ- ent chromosomes. HOX genes play central roles in embryonic development, differentiation, and proliferation of hematopoietic cells [38]. Expression changes of HOX genes are also highly Table 5(continued)
Gene Mutant median Wild median FC P-value
BAHCC1 2543 1273 2 1.15E08
TSPAN13 252 732 0.34 4.82E11
TMEM176B 651 170 3.83 2.21E03
TMEM176A 831 435.5 1.91 8.10E04
JUP 510 1762.5 0.29 1.40E14
APP 43 335.5 0.13 1.90E14
PTX3 722 286 2.52 3.17E07
PLA2G4A 400 187.5 2.13 3.73E15
CTSG 3909 837 4.67 1.05E08
IFITM1 1295 2301 0.56 1.06E08
LPAR6 220 805 0.27 1.24E11
CCND2 2137 5490.5 0.39 3.31E16
SEL1L3 1650 791 2.09 2.16E09
ITM2A 647 1967 0.33 1.75E11
SLC38A1 831 1893.5 0.44 4.41E10
EMP1 281 906.5 0.31 3.13E09
EGFL7 376 965 0.39 1.51E09
JAG1 888 403 2.2 8.53E08
CCNA1 1514 583.5 2.59 2.04E05
ELANE 2466 5811 0.42 1.27E02
TREM1 1158 597.5 1.94 2.99E07
TNFAIP2 2196 1215.5 1.81 2.72E08
SLC4A1 284 794 0.36 4.45E04
PRKD3 269 558.5 0.48 6.82E08
LGALS3BP 2623 996.5 2.63 2.70E09
TARP 5095 2815.5 1.81 3.96E05
HBB 4514 21338.5 0.21 5.18E05
Table 6
NPM1 mutation associated genes that expression was correlated with OS in the GSE1159 dataset.
Gene HR P-value q-value
HOXA10 0.48 1.63E05 7.99E04
TARP 0.53 1.31E04 2.22E03
HOXA5 0.51 1.69E04 2.22E03
SEL1L3 0.53 1.81E04 2.22E03
MEIS1 0.49 2.85E04 2.76E03
ITM2A 1.96 3.38E04 2.76E03
PLA2G4A 0.59 1.19E03 8.33E03
ELANE 1.8 1.39E03 8.51E03
MEST 1.77 2.06E03 1.12E02
CD34 0.58 2.48E03 1.22E02
JUP 1.76 3.73E03 1.58E02
GYPC 1.57 3.86E03 1.58E02
LGALS3BP 0.62 4.49E03 1.67E02
SMC4 0.62 4.76E03 1.67E02
MAN1A1 1.54 5.38E03 1.76E02
PBX3 0.65 6.02E03 1.84E02
HOXB5 0.63 7.11E03 2.05E02
CTSG 0.63 8.96E03 2.44E02
TSPAN13 0.65 1.03E02 2.66E02
SLC38A1 0.67 1.26E02 3.09E02
IFITM1 1.49 1.49E02 3.48E02
HOXB2 0.68 1.98E02 4.41E02
RASGRP3 0.71 2.79E02 5.94E02
CCND2 1.38 4.21E02 8.24E02
LPAR6 1.41 4.42E02 8.24E02
HOXB3 0.72 4.45E02 8.24E02
EGFL7 1.46 4.54E02 8.24E02
correlated with the development of hematologic malignancies [39]. In a genome-wide analysis, several HOXA and HOXB genes with their co-factors were overexpressed in AML with normal karyotype [40]. HOX expression in AML is restricted to specific genes in the HOXA or HOXB loci, and are highly correlated with recurrent cytogenetic abnormalities[41]. Overexpression of HOX genes results in the expansion of progenitor cell populations and simultaneously blockade of the differentiation of these cells[42].
Here, three homeobox (HOX) genes were found – HOXA5, HOXB5, and HOXA10 – that show significantly higher expression in NPM1
mutant tumor samples. A previous study revealed that high expression of HOXA5 is linked with worse survival in AML[38].
In pediatric AML cases, NPM1 mutations affected the expression of HOXA4, HOXA6, HOXA7, HOXA9, and HOXB9 genes and the MEIS1 and PBX3 genes[43]. The mechanism of action for upregu- lation of HOX genes in NPM1 mutated patients remains uncertain.
NPM1 might directly modify the expression of HOX genes, or NPM1 mutations might inhibit the differentiation of early hematopoietic progenitors where HOX expression is upregulated [44]. The results of present study also provide robust clinical Fig. 2.A–G. Best genes in the training set. Workflow of selecting differentially expressed genes (A). The best performing genes linked to NPM1 mutations in the training set (B–G). Hazard rates with 95% confidence intervals are shown.
support for recent cell-culture based observations establishing the connection between NPM1 and HOX expression in AML. In their study, Brunetti and coworkers show the key role of mutant NPM1 and its aberrant cytoplasmic localization in inducing HOX expression. Nuclear re-localization of the mutated protein (NPM1c) induced immediate downregulation of HOX genes, fol- lowed by cell differentiation[45].
Hox transcription factors frequently co-operate with PBX (pre- B-cell leukemia homeobox) and MEIS (myeloid ecotropic viral inte- gration site homeobox) family genes[46]. These genes are encoded by homeodomain-containing transcription cofactors, which have an essential role in some HOX-dependent developmental programs [47]. HOX proteins from paralog groups 1 to 10 interact with PBX proteins, whereas interaction with MEIS proteins is limited to HOX paralogs 9 to 13[48].
PBX proteins were identified as fusion proteins from chromo- some translocations causing pre-B cell leukemia in humans[49].
The interaction between PBX and HOX proteins is essential for HOX function[50](seeFig. 6B). Earlier studies presented that the DNA binding affinity of HOX proteins is higher when PBX proteins are present[51]. In addition, these co-factors can mediate the DNA target selection of HOX proteins [52]. PBX proteins also bind to additional factors, such as histone deacetylases (HDACs) and his- tone acetyltransferases (HATs) to mobilize these factors to the HOX complexes[53].
MEIS proteins are members of HMP (homothorax, meis and prep) proteins and are identified as proto-oncogenes coactivated with HOX genes in leukemia[54]. Previous studies demonstrated that HMP proteins can form complexes with PBX and HOX proteins [55] (Fig. 6B). MEIS proteins also counteract HDAC activity [56].
PBX-HOX complexes can bind HDACs and repress transcription;
however, this repression can be blocked by MEIS proteins capable of initiating transcription[56].
ITM2A (integral membrane protein 2A) is a type II membrane protein that belongs to the ITM2 family [57]. ITM2A is involved in myogenic differentiation, mesenchymal stem cell differentia- tion, and autophagy[58]. A patent describing a monoclonal anti- body against ITM2A for the potential treatment of AML by inducing ADCC was recently submitted [59]. Decreased ITM2A expression in AML was described previously, but its function in the progression of AML is still unclear[14].
These results support the idea of targeting the HOX transcrip- tion complex in the targeted therapy of NPM1 mutated AML. In some solid cancers, including lung[60], breast[61], prostate[62], melanoma[63], and AML cell lines[64], HXR9 is a potent cell pen- etrating peptide inhibitor targeting HOX proteins by inhibiting the interaction with PBX cofactors. Alharbi et al. evaluated the mecha- nism of HXR9 induced cell death and found that HXR9 promotes apoptosis and necroptosis and its cytotoxicity can be enhanced by inhibiting protein kinase C (PKC) in AML cell lines[65].
Fig. 3.Validation of NPM1-associated differentially expressed genes in the GSE1159 (A) and TCGA datasets (B).
Conclusions
In summary, by connecting mutation status with a gene expression signature we identified HOX genes and their co- factors significantly upregulated in NPM1 mutant tumors. The expression of these genes also correlated to survival outcome.
The strength of this study is the utilization of several different training sets for feature selection and validation using an inde- pendent method. Based on these results, the complex involving the HOX genes with the PBX3 and MEIS1 co-factors may serve as an advanced therapeutic target in NPM1 mutated AML patients.
Fig. 4.The expression of HOXA5 (A), HOXB5 (B), HOXA10 (C), PBX3 (D), MEIS1 (E) and ITM2A (F) genes was significantly correlated with OS in the GSE1159 dataset. HRs with 95% confidence intervals are shown.
Fig. 5.A–J. Validation in an independent clinical set. Clinical characteristics of the Semmelweis set (A–D). RT-qPCR for differentially expressed genes with validated expression linked to NPM1 mutations and survival in the clinical set (E–J). Hazard rates with 95% confidence intervals are shown.
Availability of data and material
The NCBI Gene Expression Omnibus datasets are available using the following links:
GSE6891: https://www.ncbi.nlm.nih.gov/geo/query/acc.cgi?
acc=GSE6891.
GSE1159: https://www.ncbi.nlm.nih.gov/geo/query/acc.cgi?
acc=GSE1159.
TCGA (The Cancer Genome Atlas) dataset is available using the following link:https://portal.gdc.cancer.gov/projects/TCGA-LAML.
Conflict of interest
The authors have declared no conflict of interest.
Acknowledgements
The study was supported by the NVKP_16-1-2016-0004 NVKP_16-1-2016-0037, 2018-1.3.1-VKE-2018-00032, KH-129581 and FIEK_16-1-2016-0005 grants of the National Research, Devel- opment and Innovation Office, Hungary.
References
[1]Siegel RL, Miller KD, Jemal A. Cancer statistics, 2018. CA Cancer J Clin 2018;68 (1):7–30.
[2]Rowley JD. Chromosomal translocations: revisited yet again. Blood 2008;112 (6):2183–9.
[3]Cancer Genome Atlas Research N, Ley TJ, Miller C, Ding L, Raphael BJ, Mungall AJ, et al. Genomic and epigenomic landscapes of adult de novo acute myeloid leukemia. N Engl J Med 2013;368(22):2059–74.
[4]Fathi AT, Wander SA, Faramand R, Emadi A. Biochemical, epigenetic, and metabolic approaches to target IDH mutations in acute myeloid leukemia.
Semin Hematol 2015;52(3):165–71.
[5]Shlush LI, Zandi S, Mitchell A, Chen WC, Brandwein JM, Gupta V, et al.
Identification of pre-leukaemic haematopoietic stem cells in acute leukaemia.
Nature 2014;506(7488):328–33.
[6]McKenna HJ, Stocking KL, Miller RE, Brasel K, De Smedt T, Maraskovsky E, et al.
Mice lacking flt3 ligand have deficient hematopoiesis affecting hematopoietic progenitor cells, dendritic cells, and natural killer cells. Blood 2000;95 (11):3489–97.
[7]Rombouts WJ, Blokland I, Lowenberg B, Ploemacher RE. Biological characteristics and prognosis of adult acute myeloid leukemia with internal tandem duplications in the Flt3 gene. Leukemia 2000;14(4):675–83.
[8]Falini B, Mecucci C, Tiacci E, Alcalay M, Rosati R, Pasqualucci L, et al.
Cytoplasmic nucleophosmin in acute myelogenous leukemia with a normal karyotype. N Engl J Med 2005;352(3):254–66.
[9]Grisendi S, Mecucci C, Falini B, Pandolfi PP. Nucleophosmin and cancer. Nat Rev Cancer 2006;6(7):493–505.
[10] Martelli MP, Manes N, Pettirossi V, Liso A, Pacini R, Mannucci R, et al. Absence of nucleophosmin leukaemic mutants in B and T cells from AML with NPM1 mutations: implications for the cell of origin of NPMc+ AML. Leukemia 2008;22(1):195–8.
[11]Thiede C, Koch S, Creutzig E, Steudel C, Illmer T, Schaich M, et al. Prevalence and prognostic impact of NPM1 mutations in 1485 adult patients with acute myeloid leukemia (AML). Blood 2006;107(10):4011–20.
[12]Yang L, Rau R, Goodell MA. DNMT3A in haematological malignancies. Nat Rev Cancer 2015;15(3):152–65.
[13]Papaemmanuil E, Gerstung M, Bullinger L, Gaidzik VI, Paschka P, Roberts ND, et al. Genomic classification and prognosis in acute myeloid leukemia. N Engl J Med 2016;374(23):2209–21.
[14]Verhaak RG, Goudswaard CS, van Putten W, Bijl MA, Sanders MA, Hugens W, et al. Mutations in nucleophosmin (NPM1) in acute myeloid leukemia (AML):
association with other gene abnormalities and previously established gene expression signatures and their favorable prognostic significance. Blood 2005;106(12):3747–54.
[15]Schnittger S, Schoch C, Kern W, Mecucci C, Tschulik C, Martelli MF, et al.
Nucleophosmin gene mutations are predictors of favorable prognosis in acute myelogenous leukemia with a normal karyotype. Blood 2005;106(12):3733–9.
[16]Rollig C, Thiede C, Gramatzki M, Aulitzky W, Bodenstein H, Bornhauser M, et al.
A novel prognostic model in elderly patients with acute myeloid leukemia:
results of 909 patients entered into the prospective AML96 trial. Blood 2010;116(6):971–8.
[17]Paschka P, Schlenk RF, Gaidzik VI, Habdank M, Kronke J, Bullinger L, et al. IDH1 and IDH2 mutations are frequent genetic alterations in acute myeloid leukemia and confer adverse prognosis in cytogenetically normal acute myeloid leukemia with NPM1 mutation without FLT3 internal tandem duplication. J Clin Oncol 2010;28(22):3636–43.
[18]Gong Q, Zhou L, Xu S, Li X, Zou Y, Chen J. High doses of daunorubicin during induction therapy of newly diagnosed acute myeloid leukemia: a systematic review and meta-analysis of prospective clinical trials. PLoS One 2015;10(5):
e0125612.
[19]Li X, Xu S, Tan Y, Chen J. The effects of idarubicin versus other anthracyclines for induction therapy of patients with newly diagnosed leukaemia. Cochr Datab Syst Rev 2015;6:CD010432.
[20] Lowenberg B. Sense and nonsense of high-dose cytarabine for acute myeloid leukemia. Blood 2013;121(1):26–8.
[21]Falini B, Nicoletti I, Martelli MF, Mecucci C. Acute myeloid leukemia carrying cytoplasmic/mutated nucleophosmin (NPMc+ AML): biologic and clinical features. Blood 2007;109(3):874–85.
Fig. 6.Correlation between top target genes. Scatterplot and Pearson rank correlation coefficients of gene expression (P< 2.2E16 for each correlation) (A). HOX genes and identified cofactors act in concert to influence multiple features of a cancer cell (B).