R E S E A R C H A R T I C L E Open Access
DNA hypermethylation and decreased mRNA expression of MAL, PRIMA1, PTGDR and SFRP1 in colorectal adenoma and cancer
Alexandra Kalmár1,2*†, Bálint Péterfia1,2†, Péter Hollósi3,4†, Orsolya Galamb2, Sándor Spisák2, Barnabás Wichmann2, András Bodor5, Kinga Tóth1, Árpád V. Patai1, Gábor Valcz2, Zsófia Brigitta Nagy1, Vivien Kubák3, Zsolt Tulassay1,2, Ilona Kovalszky3and Béla Molnár1,2
Abstract
Background:Colorectal cancer (CRC) development is accompanied by changes in expression for several genes; but the details of the underlying regulatory procesess remain unknown. Our aims were to assess the role of epigenetic processes in tumour formation and to identify characteristic DNA methylation and miRNA alterations in the colorectal adenoma-carcinoma sequence.
Methods:Whole genome expression profiling was performed on colonic biopsy samples (49 healthy normal, 49 colorectal adenoma (AD), 49 CRC); on laser capture microdissected (LCM) epithelial and stromal cells from 6 CRC-normal adjacent tissue (NAT) samples pairs, and on demethylated human CRC cell lines using HGU133 Plus 2.0 microarrays (Affymetrix). Methylation status of genes with gradually altering expression along the AD-CRC sequence was further analysed on 10–10 macrodissected and 5–5 LCM samples from healthy colon, from adenoma and from CRC biopsy samples using bisulfite-sequencing PCR (BS-PCR) followed by pyrosequencing.In silicomiRNA prediction for the selected genes was performed with miRWALK algorithm, miRNA expression was analysed on 3 CRC-NAT sample pairs and 3 adenoma tissue samples using the Human Panel I + II (Exiqon). SFRP1 immunohistochemistry experiments were performed.
Results:A set of transcripts (18 genes includingMAL, SFRP1, SULT1A1, PRIMA1, PTGDR) showed decreasing expression (p< 0.01) in the biopsy samples along the adenoma-carcinoma sequence. Three of those (COL1A2, SFRP2, SOCS3) showed hypermethylation andTHBS2showed hypomethylation both in AD and in CRC samples compared to NAT, whileBCL2, PRIMA1andPTGDRshowed hypermethylation only in the CRC group. miR-21 was found to be significantly (p< 0.01) upregulated in adenoma and tumour samples compared to the healthy colonic tissue controls and could explain the altered expression of genes for which DNA methylation changes do not appear to play role (e.g.BCL2, MAL, PTGS2).
Demethylation treatment could upregulate gene expression of genes that were found to be hypermethylated in human CRC tissue samples. Decreasing protein levels of SFRP1 was also observed along the adenoma-carcinoma sequence.
Conclusion:Hypermethylation of the selected markers (MAL, PRIMA1, PTGDRandSFRP1) can result in reduced gene expression and may contribute to the formation of colorectal cancer.
Keywords:DNA methylation, Colorectal cancer, Gene expression, Pyrosequencing, Laser capture microdissection
* Correspondence:alexandra.kalmar@gmail.com
†Equal contributors
12nd Department of Internal Medicine, Semmelweis University, Budapest, Hungary
2Molecular Medicine Research Group, Hungarian Academy of Sciences, Budapest, Hungary
Full list of author information is available at the end of the article
© 2015 Kalmár et al.Open AccessThis article is distributed under the terms of the Creative Commons Attribution 4.0 International License (http://creativecommons.org/licenses/by/4.0/), which permits unrestricted use, distribution, and reproduction in any medium, provided you give appropriate credit to the original author(s) and the source, provide a link to the Creative Commons license, and indicate if changes were made. The Creative Commons Public Domain Dedication waiver (http://creativecommons.org/publicdomain/zero/1.0/) applies to the data made available in this article, unless otherwise stated.
Background
Colorectal cancer (CRC) is regarded as one of the most frequent malignant tumours globally [1]. This heteroge- neous disease can develop through at least three distinct molecular pathways by which genetic and/or epigenetic dysregulation influences gene expression and protein levels finally leading to colorectal adenoma and carcinoma formation [2, 3]. One of the epigenetic alterations that can contribute to CRC formation is the abnormal DNA hyper- methylation of promoters, resulting in reduced or absent gene expression [4]. DNA hypermethylation occurs at regulatory sites e.g. promoters in a tissue- and cancer type-specific manner [5]. Besides genetic alterations, DNA hypermethylation of tumour suppressor genes is a fre- quently detected mechanism behind the inactivation of these genes leading to tumour initiation [6]. Although more and more genes are associated with various types of cancers, our knowledge of DNA methylation markers in CRC development remains incomplete.
Another key posttrancriptional epigenetic regulator of gene expression, miRNA, regulates the stability and trans- lation process of mRNAs. The expression of miRNAs has been shown to differ in colorectal tumours compared to healthy colon tissue specimens and on the basis of several experimental results they play role in colorectal cancer formation. Up- and downregulation of certain miRNAs was identified along the adenoma-carcinoma sequence of CRC and evidence supports the role of miRNAs in CRC development and progression as these small non-coding RNAs affect proliferation and invasion [7].
The identification of genes affected by epigenetic changes can be achieved using whole genome gene expression ana- lysis [8]. DNA methylation and miRNA expression alter- ations can both lead to a certain degree of dowregulation of mRNA expression and consequently of protein levels, which can be confirmed by immunohistochemistry.
In the present study, our aims were (1) to identify DNA methylation markers in CRC samples on the basis of whole genome gene expression analysis and (2) to analyse the DNA methylation levels of these candidate marker along the colorectal adenoma-carcinoma sequence on colorectal adenoma and cancer samples. Furthermore, (3) our aim was to confirm the relationship between gene ex- pression, DNA methylation status, miRNA expression and protein levels of the analysed candidate markers.
Methods
Selection of candidate genes regulated by DNA methylation
The selection of candidate genes was based on expression data generated from 147 colonic biopsy specimens (from 49 normal, 49 adenoma, and 49 CRC patients), laser cap- ture microdissected colonic epithelial cells (from 6 NAT, 6 adenomas, and 6 CRC), analysed in a previous study by
whole genome HGU133 Plus 2.0 microarrays (Affymetrix) [8, 9]. These data files are available in the Gene Expession Omnibus database (http://www.ncbi.nlm.nih.gov/geo/) at GSE series accession numbers GSE4183 (8 normal, 15 ad- enoma and 15 CRC), GSE10714 (3 normal, 5 adenoma and 7 CRC), GSE37364 (38 normal, 29 adenoma and 27 CRC)) and GSE15960 (laser microdissected colonic epithelial cells from 6 normal, 6 adenoma and 6 CRC).Clinical data of pa- tients involved in the analysed gene expression studies can be found in Additional file 1: Table S1.
Although the bioinformatic analysis and the candidate selection was based on previously performed and pub- lished raw gene expression data of HGU133 Plus 2.0 mi- croarrays, the aim of the present study was substantially different from the previously published studies’. We aimed to identify genes with gradually altering expres- sion in adenoma and tumour samples that can be poten- tially regulated by DNA methylation. The data sets GSE4183 [10], GSE10714 [11], GSE 37364 [9], and GSE15960 [8] were analysed to identify genes potentially regulated by DNA methylation. Transcripts with grad- ually decreasing or increasing expression along the adenoma-carcinoma sequence were selected on the basis of Kendall (tau coefficient) rank correlation analysis (−0.5≤tau coefficient≤0.5). DNA methylation analysis was performed for genes with CpG island(s) on the basis of in silico prediction by the CpG Plot EMBOSS application (http://www.ebi.ac.uk/Tools/seqstats/emboss_cpgplot/) [12].
Expression of the selected gene set was also analysed on gene expression data sets of human colorectal cell lines before and after DNA demethylation treatment with 5-Aza (GSE29060: 10μM 5-Aza treatment for 72 h on HT-29 cell line; GSE14526: 3 μM 5-Aza treatment for 72 h on HCT116 and SW480 cell lines; GSE32323:
0.5 μM 5-Aza treatment for 72 h on Colo32, HCT116, HT-29, RKO and SW480 cell lines.
Student's t -test and Benjamini-Hochberg method were applied in order to determine significance of gene expression and DNA methylation level compari- sons (p< 0.05). For logFc, abs (differences of average of intensity values) > 1 threshold was applied.
Tissue sample collection
For DNA methylation analysis, tissue specimens were obtained from surgically removed colon tumours (mod- erately differentiated, Dukes B-C stages; MSS) (n= 15) and from histologically normal adjacent tissue (NAT) (n= 15) derived from the furthest available area away from the tumour. In addition, adenomas (n= 15) were also analysed, containing biopsy samples (n= 10) and fresh frozen tissue samples (n= 5), as well. Fresh fro- zen samples were snapfrozen in liquid nitrogen dir- ectly after surgery and were stored at −80 °C. Written informed consent was obtained from all patients; and
the study was approved by the local ethics committee (Ethics Committee approval was obtained Nr.: TUKEB 2005/037 and TUKEB Nr.: 2008/69, Semmelweis University Regional and Institutional Committee of Science and Re- search Ethics, Budapest, Hungary). The study was performed according to the ethical standards of the revised version of Helsinki Declaration. Clinical data of patients involved in the study can be found in Additional file 2: Table S2.
Laser capture microdissection, macrodissection
Frozen tissue samples were embedded in OCT compound (Sakura Finetek, Japan). Then, 10μm cryosections were cut at−20 °C in a cryostat instrument and mounted on PALM Membrane Slides 1.0 PEN (Carl Zeiss, Bernried, Germany).
After fixation with 70 % ethanol for 5 min and absolute ethanol for 2 min, slides were stained with cresyl violet acetate (Sigma-Aldrich, St. Louis, USA). Colonic epithelial and stromal cells (approx. 103 cells) were collected using the PALM Microbeam laser capture microdissection sys- tem (PALM, Bernried, Germany). Macrodissected samples were collected from cryosections after toluidine blue stain- ing. Selected areas containing both stromal and epithelial cells were harvested by scratching the tissue slide with a single-use needle.
DNA methylation analysis Bisulfite conversion
Bisulfite conversion was performed using the EZ DNA Methylation Direct Kit (Zymo Research) without prior DNA isolation. Proteinase K digestion was performed in 20μl (according to Section I Protocol A) followed by bi- sulfite conversion. The elution volume was 20μl.
Bisulfite-specific PCR (BS-PCR)
In silico CpG island prediction was performed by CpG Plot EMBOSS Application (http://www.ebi.ac.uk/Tools/
seqstats/emboss_cpgplot/). Bisulfite-specific PCR reac- tions were performed using primers designed with Pyro- Mark Assay Design software (SW 2.0, Qiagen, Hilden, Germany) to be specific for non-CpG regions in order to amplify the bisulfite converted DNA samples without discriminating between methylated and non-methylated sequences (Table 1). PCR primers in the opposite dir- ection of sequencing primers were biotin labelled. Pri- mer specificities were tested in silico by BiSearch software (http://bisearch.enzim.hu) [13].
BS-PCR reactions were performed using AmpliTaq Gold 360 mastermix (2x) (Life Technologies, Carlsbad, USA), LightCycler 480 ResoLight Dye (40x) (Roche Applied Science), primer mix (200 nM final concentra- tion), bisulfite converted DNA samples (approx. 10 ng bcDNA/well) in 15 μl final volume. Real-time PCR amplification was carried out with the following thermo- cycling conditions on the LightCycler 480 System: 95 °C
for 10 min, then 95 °C for 30 s, 60 °C with a 0.4 °C de- crease/cycle for 30 s, 72 °C for 30 s for 10 touchdown cy- cles, followed by the amplification at 95 °C for 30 s, 56 °C for 30 s, and 72 °C for 30 s in 40 cycles.
Providing single-base resolution information about the methylation status of a CpG island direct sequencing is one of the most robust methods to analyse BS-PCR prod- ucts. After bisulfite treatment and BS-PCR, all cytosines are converted to thymines except for those originally meth- ylated. Two different pyrosequencing technologies were applied to analyse DNA methylation of BS-PCR products i.e. the Qiagen PyroMark System and the Roche GS Junior System utilising the 454 technology. The read length of the different technologies differs. With the PyroMark system sequences, up to 60 bp can be analysed, while up to 400 bp read length could be achieved with the 454 technology.
PyroMark Q24 sequencing
Pyrosequencing was performed on a PyroMark Q24 in- strument (Qiagen) using PyroMark Gold Q24 Reagents (Qiagen) according to the manufacturer’s recommenda- tions. Purification and subsequent processing of the bio- tinylated single-stranded DNA were performed in two consecutive runs by applying two different sequencing primers in order to cover more CpG sites in the Table 1Genes analysed in the study. Genes with gradually decreasing or increasing expression along the adenoma- carcinoma sequence with predictable CpG islands were selected on the basis of Kendall (tau coefficient) rank correlation analysis (−0.5≤tau coefficient≤0.5)
Gene symbol Gene name
ALDH1A3 aldehyde dehydrogenase 1 family, member A3
BCL2 B-cell CLL/lymphoma 2
CDX1 caudal type homeobox 1
COL1A2 collagen, type I, alpha 2
CYP27B1 cytochrome P450, family 27, subfamily B, polypeptide 1 ENTPD5 ectonucleoside triphosphate diphosphohydrolase 5 FADS1 fatty acid desaturase 1
MAL mal, T-cell differentiation protein PRIMA1 proline rich membrane anchor 1 PTGDR prostaglandin D2 receptor (DP) PTGS2 prostaglandin-endoperoxide synthase 2 SFRP1 secreted frizzled-related protein 1 SFRP2 secreted frizzled-related protein 2 SOCS3 suppressor of cytokine signaling 3
SULF1 sulfatase 1
SULT1A1 sulfotransferase family, cytosolic, 1A, phenol-preferring, member 1
THBS2 thrombospondin 2
TIMP1 metallopeptidase inhibitor 1
amplicons [14, 15]. Sequencing results were analysed using the PyroMark Q24 software v2.0.6 (Qiagen).
GS Junior sequencing
Library preparation with ligated adaptors and emulsion- PCR amplification were as described in “Guidelines for Amplicon Experimental Design”. The concentrations of BS-PCR amplicons were measured by Qubit fluorometer with High Sensitivity dsDNA reagent (Life Technologies).
Amplicons belonging to the same sample were pooled at an equimolar ratio and PCR products were purified with AMPure beads (Agencourt, Beckman Coulter Genomics, Pasadena, USA) according to the manufacturer’s standard protocol. The Agilent Bioanalyzer was used with the High Sensitivity DNA Chip (Agilent, Santa Clara, USA) to as- sess sample quality. Fragment End Repair was performed using the GS FLX Titanium Rapid Library Preparation Kit (Rapid Library Preparation Method Manual 3.2). RL MID Adaptor Ligation was carried out using GS FLX Titanium Rapid Library Preparation Kit (Rapid Library Preparation Method Manual 3.4). After ligation, purification of ampli- con libraries was performed with AMPure beads, and as- sessment of library quality was done using the Agilent Bioanalyzer with High Sensitivity DNA Chip. Library quantification was performed based on fluorometric mea- surements with Qubit High Sensitivity dsDNA reagent.
Equimolar mixing of the libraries was performed by MIDs identifying different samples with different MID adaptors.
Amplicon library pools were then amplified by emPCR at a 0.5 DNA molecule per bead ratio using the Lib-L emPCR Kit. Since amplicon lengths were short, the emPCR procedure was performed with reduced Amp Pri- mer quantity (emPCR Amplification Method Manual – Lib-L, GS Junior Titanium Series, Live Amp Mix for paired end libraries). Bead enrichment and sequencing were performed using the GS Junior Titanium Sequencing Kit and the method described in the Sequencing Method Manual, GS FLX Titanium Series.
The Smith-Waterman algorithm with Gotoh’s im- provement was used for matching the reads to template sequences in the JAligner software package [16, 17]. As 454 technology can result in sequencing errors with ho- mopolymer stretches e.g. in bisulfite-sequencing tem- plates [18], gaps or insertions were frequently observed in the sequenced reads. Reads with a minimum of 80 % of maximum alignment score were analysed further, after which the actual nucleotides at the potential methylation sites were summarised.
miRNA analysis
miRNA analysis was performed on an independent formalin-fixed, paraffin-embedded (FFPE) sample set in- cluding CRC (n= 3), adenomas (n= 3) and NAT (n= 3) samples. miRNA isolation was performed with the High
Pure miRNA kit (Roche) and the expression of approxi- mate 800 miRNA were assessed on Human Panel I + II (Exiqon) with the miRCURYTMUniversal RT microRNA PCR protocol according to the manufacturer’s instruc- tions. Normalisation of raw Ct data was performed with interplate calibrators followed by miR-423-5p, as a house- keeping gene expressed at relatively constant levels in our analysed samples. In silico miRNA prediction was per- formed for all analysed genes using the miRWALK data- base prediction algorithm including validated mRNA targets [19] in order to select experimentally verified miRNA interaction information associated with genes, pathways, organs, diseases, cell lines, OMIM disorders, and literature on miRNAs. Subsequently, expression of se- lected miRNAs in normal, adenoma and cancer samples was compared.
Immunohistochemistry
Among the analysed 18 genes, SFRP1 protein level was ana- lysed because of the special interest of our working group.
Surgically removed colonic tissues from NAT (n= 10), AD (n= 10), and CRC specimens (n= 10) were fixed in formalin and embedded in paraffin and tissue microarrays (TMA) were constructed. Four μm sections were cut, deparaffi- nised, and rehydrated. For SFRP1 staining, antigen retrieval was performed in TRIS EDTA buffer (pH 9.0) using a microwave (900 W for 10 min, 340 W for 40 min). Samples were incubated with anti–SFRP1 rabbit polyclonal antibody (ab4193, Abcam, Cambridge, UK) diluted 1:800 for 60 min at 37 °C. EnVision + HRP system (Labeled Polymer Anti- Mouse, K4001, Dako) and diaminobenzidine-hydrogen per- oxidase–chromogen substrate system (Cytomation Liquid DAB + Substrate Chromogen System, K3468, Dako) were used with hematoxylin counterstaining. Slides were digita- lised using the Pannoramic Scanner p250 Flash instrument (software version 1.11.25.0, 3DHISTECH Ltd., Budapest, Hungary), and analysed with a digital microscope software (Pannoramic Viewer, v. 1.11.43.0. 3DHISTECH Ltd., Budapest, Hungary). The semiquantitative Quick-score (Q) method was applied for SFRP1 protein level alteration ana- lysis. Every TMA core was scored by multiplying the per- centage of positive cells by the given intensity value (0 for no staining, +1 for weak, +2 for moderate, and +3 for strong diffuse immunostaining).
Results
Gene expression analysis
Genes potentially regulated by DNA methylation were selected on the basis of whole genome gene expression data from previously performed microarray experiments of 49 normal, 49 adenoma, and 49 tumour biopsy sam- ples [9]. Based on Kendall analysis, a set of 18 tran- scripts was selected showing continuously altering expression (p≤0.01) in the biopsy samples along the
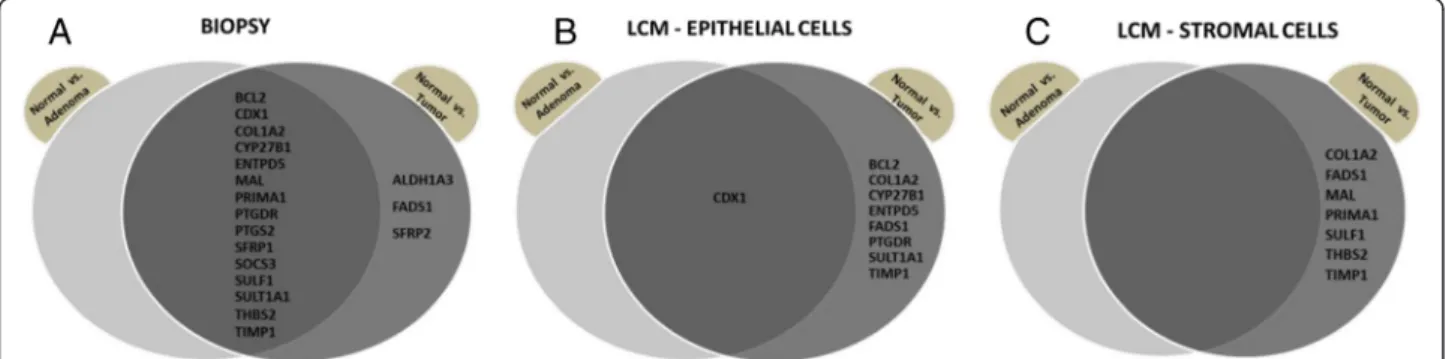
adenoma-carcinoma sequence (Table 1). Along colorectal adenoma-carcinoma progression, the following genes showed downregulation: BCL2, CDX1, ENTPD5, MAL, PRIMA1, PTGDR, SFRP1, andSULT1A1while the follow- ing genes showed upregulation: ALDH1A3, COL1A2, CYP27B1, FADS1, PTGS2, SFRP2, SOCS3, SULF1, THBS2, and TIMP1. Gene expression alteration of BCL2, CDX1, CYP27B1, ENTPD5, MAL, PRIMA1, PTGDR, PTGS2, SFRP1, SOCS3 SULT1A1, and TIMP1 were found to be significant (p< 0.05) in the adenoma versus healthy and also in the tumour versus healthy comparison. In addition, ALDH1A3, COL1A2, FADS1, SFRP2, SULF1, andTHBS2 were found to be significantly (p< 0.01) differentially expressed in tumour samples but not in adenomas com- pared to healthy samples (Fig. 1, Table 2, Additional file 3:
Figure S1, Additional file 4: Table S3).
In order to investigate the cellular origin of altered gene expression of the analysed transcript set during colorectal cancer formation, laser capture microdissection was ap- plied to separate epithelial and stromal cells from the co- lonic mucosa. Significantly altered expression (p< 0.05) of SOCS3and PRIMA1 could be detected in epithelial cells from normal versus adenomatous samples. Gene expres- sion changes of BCL2, CYP27B1, COL1A2, FADS1, and SULT1A1were significant (p< 0.05) only in tumours com- pared to healthy samples, whileCDX1, ENTPD5, PTGDR ,and TIMP1 showed gene expression difference in both normal vs. adenoma and normal vs. tumour comparisons (Fig. 1, Table 2, Additional file 4: Table S3).
No significant gene expression alterations could be de- tected in the stromal cells isolated from adenomas com- pared to the normals, but COL1A2, FADS1, MAL, PRIMA1, SULF1, THBS2, TIMP1 genes’ transcripts showed significant differences (p< 0.05) in logFc values for the tumour versus normal comparison (Fig. 1;
Additional file 4: Table S3). As stromal cells showed the fewest gene expression alterations, we further focused on biopsy and laser microdissected epithelial samples.
Demethylation treatment on colon adenocarcinoma cell lines
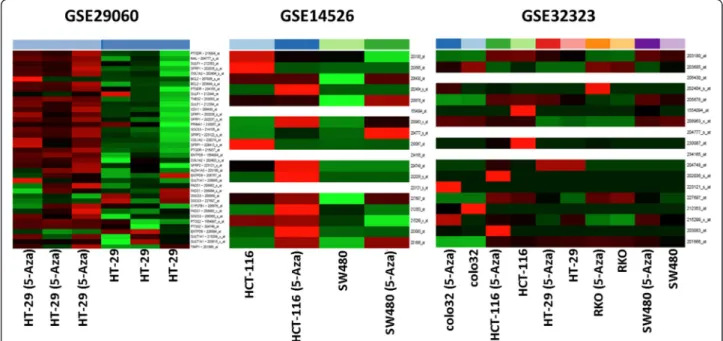
Gene expression of the selected marker set was analysed on data sets containing control and 5-Aza treated colon adenocarcinoma cell lines. According to GSE29060 data, in HT-29 adenocarcinoma cells after a demethylation treatment 4 transcripts showed a minimally decreased ex- pression (TIMP1, FADS1, CYP27B and SULT1A1), while PTGS2 was found to be upregulated. HCT-116 cells showed higher re-expression of the selected genes, as PTGS2, THBS2 and TIMP1 also showed upregulation (1 < logFccontrol-treated) and TIMP1 was also upregu- lated in 5-Aza treated SW480 cells according to GSE14526. Among the 5 CRC cell lines of GSE32323 SULT1A1 in Colo32 cells, PTGS2 in HCT-116 cells, ALDH1A3 and SOCS3 in HT-29 cells and ALDH1A3 and TIMP1in SW480 cells showed remarkable upregula- tion after demethylation treatment (Fig. 2, Additional file 4:
Table S3).
DNA methylation analysis
DNA methylation was assessed in human colonic samples using two different pyrosequencing systems.
Firstly, routinely collected biopsy samples and macro- dissected specimens naturally containing both epithe- lial and stromal cells were analysed. Among the 18 analysed markers (Table 1), DNA methylation was significantly (p< 0.05) altered for six loci belonging to four genes, in which COL1A2, SFRP2, SOCS3 showed hypermethylation and THBS2 showed hypomethyla- tion both in AD and in CRC samples compared to NAT. Three additional genes, BCL2, PRIMA1, and PTGDR showed hypermethylation only in tumour samples (Table 3, Additional file 5: Figure S2).
Interestingly, two of the analysed regions in theTHBS2 promoter conferred hypomethylation along tumour for- mation, while the third locus examined showed signifi- cant hypermethylation in tumours compared to NAT.
Fig. 1Summary of genes with altered expression levels in the analysed samples. Venn diagrams display genes that exhibit significantly altered gene expression patterns (p< 0.05) in (a) colon biopsy samples, (b) laser capture microdissected (LCM) epithelial cells, and (c) stromal cells in the normal versus adenoma, normal versus tumour comparisons and their intersections. The majority of gene expression changes could be detected in biopsy samples, while LCM epithelial and stromal cells show fewer altered transcript levels, primarily in normal vs. tumour comparison
Unsupervised clustering of genes with DNA hypermethylation
Unsupervised hierarchical clustering of DNA methyla- tion data revealed three groups of markers in biopsy and
macrodissected sample groups. The first group of genes (SFRP2, COL1A2, THBS2, SOCS3, CYP27B1, SULT1A1, PRIMA1 and MAL) showed a relatively high degree of DNA methylation already in AD and also in CRC Table 2Gene expression data of biopsies and laser microdissected (LCM) colon epithelial cells
Normal Adenoma CRC P-value
(N vs. Ad) P-value
(N vs. CRC) P-value (Ad vs. CRC) Mean normalised intensity
values ± SD
Mean normalised intensity values ± SD
Mean normalised intensity values ± SD
Biopsy samples
203180_at (ALDH1A3) 6.36 ± 0.92 6.53 ± 0.86 7.29 ± 1.45 0.34 p< 0.01 p< 0.01
203685_at (BCL2) 8.90 ± 0.52 7.96 ± 1.08 6.98 ± 1.22 p< 0.01 p< 0.01 p< 0.01
206430_at (CDX1) 11.70 ± 0.28 11.17 ± 0.35 10.84 ± 0.73 p< 0.01 p< 0.01 p< 0.01
202404_s_at (COL1A2) 9.75 ± 0.78 10.25 ± 1.11 12.31 ± 1.67 0.01 p< 0.01 p< 0.01
205676_at (CYP27B1) 2.55 ± 0.10 2.88 ± 0.54 3.15 ± 0.95 p< 0.01 p< 0.01 0.09
1554094_at (ENTPD5) 6.41 ± 0.70 4.56 ± 0.79 4.15 ± 1.29 p< 0.01 p< 0.01 0.06
208963_x_at (FADS1) 4.82 ± 0.70 5.05 ± 1.14 6.36 ± 1.65 0.22 p< 0.01 p< 0.01
204777_s_at (MAL) 6.02 ± 0.62 4.86 ± 0.37 4.88 ± 0.59 p< 0.01 p< 0.01 0.86
230087_at (PRIMA1) 4.09 ± 0.97 2.20 ± 0.61 2.31 ± 0.83 p< 0.01 p< 0.01 0.47
234165_at (PTGDR) 5.84 ± 1.08 3.91 ± 1.75 2.81 ± 0.85 p< 0.01 p< 0.01 p< 0.01
204748_at (PTGS2) 4.96 ± 1.33 6.84 ± 2.50 9.88 ± 2.74 p< 0.01 p< 0.01 p< 0.01
202036_s_at (SFRP1) 4.05 ± 1.47 2.18 ± 0.62 2.51 ± 1.28 p< 0.01 p< 0.01 0.11
223121_s_at (SFRP2) 2.87 ± 0.11 2.92 ± 0.28 3.94 ± 1.74 0.29 p< 0.01 p< 0.01
227697_at (SOCS3) 6.10 ± 1.11 7.42 ± 1.65 9.81 ± 2.06 p< 0.01 p< 0.01 p< 0.01
212353_at (SULF1) 6.29 ± 1.04 7.12 ± 1.16 9.23 ± 2.15 p< 0.01 p< 0.01 p< 0.01
215299_x_at (SULT1A1) 11.94 ± 0.53 10.40 ± 0.85 10.34 ± 0.95 p< 0.01 p< 0.01 0.72
203083_at (THBS2) 2.61 ± 0.44 3.46 ± 1.54 7.67 ± 3.13 p< 0.01 p< 0.01 p< 0.01
201666_at (TIMP1) 10.29 ± 0.75 12.20 ± 0.69 12.80 ± 1.04 p< 0.01 p< 0.01 p< 0.01
LCM - colon epithelial cells
203180_at (ALDH1A3) 3.44 ± 0.83 3.35 ± 0.34 3.61 ± 0.73 0.80 0.72 0.45
203685_at (BCL2) 7.02 ± 0.64 6.94 ± 1.56 4.52 ± 2.00 0.91 p< 0.05 p< 0.05
206430_at (CDX1) 10.35 ± 0.57 9.51 ± 0.47 9.38 ± 0.53 p< 0.05 p< 0.05 0.65
202404_s_at (COL1A2) 4.27 ± 1.50 3.28 ± 0.69 7.55 ± 1.02 0.18 p< 0.01 p< 0.01
205676_at (CYP27B1) 2.75 ± 0.04 2.79 ± 0.05 3.07 ± 0.24 0.10 p< 0.01 p< 0.05
1554094_at (ENTPD5) 4.51 ± 0.68 3.80 ± 0.69 2.51 ± 0.08 0.10 p< 0.01 p< 0.01
208963_x_at (FADS1) 3.24 ± 0.21 3.18 ± 0.17 4.44 ± 1.49 0.57 0.08 0.07
204777_s_at (MAL) 2.38 ± 0.17 2.30 ± 0.00 2.31 ± 0.02 0.29 0.34 0.30
230087_at (PRIMA1) 2.63 ± 0.29 3.88 ± 1.08 2.43 ± 0.12 p< 0.05 0.14 p< 0.01
234165_at (PTGDR) 4.71 ± 0.73 3.77 ± 1.02 2.39 ± 0.09 0.10 p< 0.01 p< 0.01
204748_at (PTGS2) 2.61 ± 0.15 2.68 ± 0.24 2.51 ± 0.04 0.59 0.14 0.13
202036_s_at (SFRP1) 2.71 ± 0.35 2.76 ± 0.33 2.54 ± 0.00 0.80 0.27 0.13
223121_s_at (SFRP2) 2.35 ± 0.09 2.36 ± 0.16 2.30 ± 0.00 0.81 0.28 0.34
227697_at (SOCS3) 4.97 ± 1.91 2.82 ± 0.43 4.33 ± 1.69 p< 0.05 0.55 0.06
212353_at (SULF1) 3.08 ± 0.81 2.73 ± 0.09 3.99 ± 1.44 0.32 0.21 0.06
215299_x_at (SULT1A1) 9.35 ± 0.31 8.57 ± 1.16 7.20 ± 0.95 0.14 p< 0.01 p< 0.05
203083_at (THBS2) 2.58 ± 0.14 2.53 ± 0.00 3.54 ± 1.43 0.48 0.13 0.12
201666_at (TIMP1) 4.11 ± 1.06 6.54 ± 1.62 7.85 ± 0.57 p< 0.05 p< 0.01 0.09
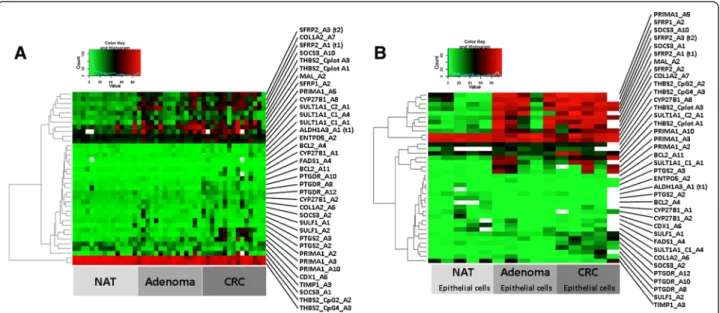
samples. The second group included most markers and did not show remarkable difference among different sample groups, while the third minor cluster included only twoTHBS2loci with high methylation levels across all samples (Fig. 3a). Unsupervised hierarchical cluster- ing of LCM epithelial cells revealed similar relationships to those in biopsy and macrodissected samples above.
Certain genes showed relatively high DNA methylation levels in both biopsies and epithelial cells in adenoma and cancer cases, as PRIMA1, SFRP1, SFRP2, MAL, SOCS3, CYP27B1, COL1A2 and SULT1A1. THBS2 showed high methylation levels across all samples. The second major marker group included most genes and did not show remarkable difference between the differ- ent sample groups (Fig. 3b).
miRNA analysis
We used the miRWALK database to predict miRNAs that could target genes of our selected set. Multiple miR- NAs could be predicted using the miRWALK ’Validated Target’in silico searching application. Certain groups of miRNAs were predicted to target more genes analysed in our present study; miR-21 (predicted forBCL2, MAL, PTGS2, SFRP1, SOCS3) expression was found to be re- markably upregulated in CRC compared to NAT (Fig. 4).
Furthermore, miR-21* (predicted for BCL2, MAL, SFRP1, SOCS3, PTGS2), miR-181c (predicted for ALDH1A3, BCL2, MAL), and let-7i* (predicted for BCL2, CYP27B1,and SOCS3) were also found to be up- regulated in AD and CRC samples (Fig. 4).
Immunohistochemistry
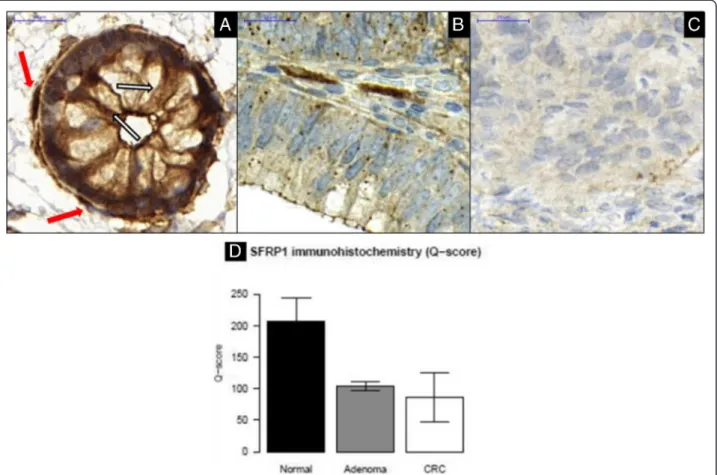
Colonic FFPE tissue samples were immunostained for SFRP1. In NAT epithelium, moderate diffuse cytoplasmic staining (+2) could be detected (Fig. 5a, white arrows) in contrast to adjacent myofibroblasts (we identified they by their localisation and morphology) with strong diffuse im- munostaining (+3) (Fig. 5a, red arrows). In tubular AD samples, weak diffuse cytoplasmic protein expression (+1) was accompanied by strong and spotted immunostaining (+2/+3) (Fig. 5b). The majority of CRC cases (9 out of 10 cases) showed weak (+1) or no (0) SFRP1 immunostaining (Fig. 5c). According to Q-score values used for semi- quantitative immunohistochemistry analysis, the over- all SFRP1 protein expression decreased along the colorectal adenoma-carcinoma sequence (Fig. 5).
Discussion
The goal of this study was to identify DNA methylation and miRNA markers associated with the sequence of adenoma-carcinoma formation leading to CRC. The can- didate markers were selected based on whole genome gene expression array data, DNA methylation analysis, and in silicoprediction and validation of miRNA expression.
The study identified set of 18 transcripts showing con- tinuous gene expression alterations that correlated with CRC progression. Microarray experiments revealed 12 genes (BCL2, CDX1, CYP27B1, ENTPD5, MAL, PRIMA1, PTGDR, PTGS2, SFRP1, SOCS3, SULT1A1, and TIMP1) with significantly different transcriptional activities in AD compared to NAT controls, while 6 genes (ALDH1A3,
Fig. 2Heat map of gene expression data of the selected marker set in 5-aza-2’-deoxycytidine-treated human colon adenocarcinoma cells (GSE29060; GSE14526; GSE32323). Intensity values on the colour scale were as follows: red–high intensity, black–intermediate intensity, green–low intensity. Demethylation treatment resulted in varying degrees of upregulation of certain transcripts
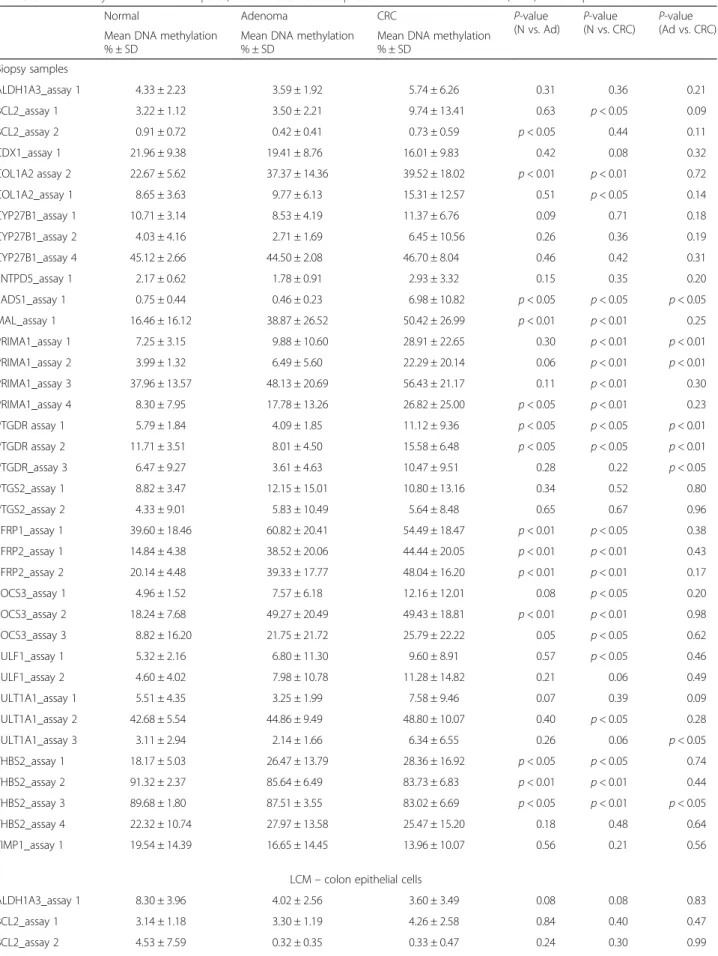
Table 3DNA methylation data of biopsies, macrodissected samples and laser microdissected (LCM) colon epithelial cells
Normal Adenoma CRC P-value
(N vs. Ad) P-value
(N vs. CRC) P-value (Ad vs. CRC) Mean DNA methylation
% ± SD
Mean DNA methylation
% ± SD
Mean DNA methylation
% ± SD Biopsy samples
ALDH1A3_assay 1 4.33 ± 2.23 3.59 ± 1.92 5.74 ± 6.26 0.31 0.36 0.21
BCL2_assay 1 3.22 ± 1.12 3.50 ± 2.21 9.74 ± 13.41 0.63 p< 0.05 0.09
BCL2_assay 2 0.91 ± 0.72 0.42 ± 0.41 0.73 ± 0.59 p< 0.05 0.44 0.11
CDX1_assay 1 21.96 ± 9.38 19.41 ± 8.76 16.01 ± 9.83 0.42 0.08 0.32
COL1A2 assay 2 22.67 ± 5.62 37.37 ± 14.36 39.52 ± 18.02 p< 0.01 p< 0.01 0.72
COL1A2_assay 1 8.65 ± 3.63 9.77 ± 6.13 15.31 ± 12.57 0.51 p< 0.05 0.14
CYP27B1_assay 1 10.71 ± 3.14 8.53 ± 4.19 11.37 ± 6.76 0.09 0.71 0.18
CYP27B1_assay 2 4.03 ± 4.16 2.71 ± 1.69 6.45 ± 10.56 0.26 0.36 0.19
CYP27B1_assay 4 45.12 ± 2.66 44.50 ± 2.08 46.70 ± 8.04 0.46 0.42 0.31
ENTPD5_assay 1 2.17 ± 0.62 1.78 ± 0.91 2.93 ± 3.32 0.15 0.35 0.20
FADS1_assay 1 0.75 ± 0.44 0.46 ± 0.23 6.98 ± 10.82 p< 0.05 p< 0.05 p< 0.05
MAL_assay 1 16.46 ± 16.12 38.87 ± 26.52 50.42 ± 26.99 p< 0.01 p< 0.01 0.25
PRIMA1_assay 1 7.25 ± 3.15 9.88 ± 10.60 28.91 ± 22.65 0.30 p< 0.01 p< 0.01
PRIMA1_assay 2 3.99 ± 1.32 6.49 ± 5.60 22.29 ± 20.14 0.06 p< 0.01 p< 0.01
PRIMA1_assay 3 37.96 ± 13.57 48.13 ± 20.69 56.43 ± 21.17 0.11 p< 0.01 0.30
PRIMA1_assay 4 8.30 ± 7.95 17.78 ± 13.26 26.82 ± 25.00 p< 0.05 p< 0.01 0.23
PTGDR assay 1 5.79 ± 1.84 4.09 ± 1.85 11.12 ± 9.36 p< 0.05 p< 0.05 p< 0.01
PTGDR assay 2 11.71 ± 3.51 8.01 ± 4.50 15.58 ± 6.48 p< 0.05 p< 0.05 p< 0.01
PTGDR_assay 3 6.47 ± 9.27 3.61 ± 4.63 10.47 ± 9.51 0.28 0.22 p< 0.05
PTGS2_assay 1 8.82 ± 3.47 12.15 ± 15.01 10.80 ± 13.16 0.34 0.52 0.80
PTGS2_assay 2 4.33 ± 9.01 5.83 ± 10.49 5.64 ± 8.48 0.65 0.67 0.96
SFRP1_assay 1 39.60 ± 18.46 60.82 ± 20.41 54.49 ± 18.47 p< 0.01 p< 0.05 0.38
SFRP2_assay 1 14.84 ± 4.38 38.52 ± 20.06 44.44 ± 20.05 p< 0.01 p< 0.01 0.43
SFRP2_assay 2 20.14 ± 4.48 39.33 ± 17.77 48.04 ± 16.20 p< 0.01 p< 0.01 0.17
SOCS3_assay 1 4.96 ± 1.52 7.57 ± 6.18 12.16 ± 12.01 0.08 p< 0.05 0.20
SOCS3_assay 2 18.24 ± 7.68 49.27 ± 20.49 49.43 ± 18.81 p< 0.01 p< 0.01 0.98
SOCS3_assay 3 8.82 ± 16.20 21.75 ± 21.72 25.79 ± 22.22 0.05 p< 0.05 0.62
SULF1_assay 1 5.32 ± 2.16 6.80 ± 11.30 9.60 ± 8.91 0.57 p< 0.05 0.46
SULF1_assay 2 4.60 ± 4.02 7.98 ± 10.78 11.28 ± 14.82 0.21 0.06 0.49
SULT1A1_assay 1 5.51 ± 4.35 3.25 ± 1.99 7.58 ± 9.46 0.07 0.39 0.09
SULT1A1_assay 2 42.68 ± 5.54 44.86 ± 9.49 48.80 ± 10.07 0.40 p< 0.05 0.28
SULT1A1_assay 3 3.11 ± 2.94 2.14 ± 1.66 6.34 ± 6.55 0.26 0.06 p< 0.05
THBS2_assay 1 18.17 ± 5.03 26.47 ± 13.79 28.36 ± 16.92 p< 0.05 p< 0.05 0.74
THBS2_assay 2 91.32 ± 2.37 85.64 ± 6.49 83.73 ± 6.83 p< 0.01 p< 0.01 0.44
THBS2_assay 3 89.68 ± 1.80 87.51 ± 3.55 83.02 ± 6.69 p< 0.05 p< 0.01 p< 0.05
THBS2_assay 4 22.32 ± 10.74 27.97 ± 13.58 25.47 ± 15.20 0.18 0.48 0.64
TIMP1_assay 1 19.54 ± 14.39 16.65 ± 14.45 13.96 ± 10.07 0.56 0.21 0.56
LCM–colon epithelial cells
ALDH1A3_assay 1 8.30 ± 3.96 4.02 ± 2.56 3.60 ± 3.49 0.08 0.08 0.83
BCL2_assay 1 3.14 ± 1.18 3.30 ± 1.19 4.26 ± 2.58 0.84 0.40 0.47
BCL2_assay 2 4.53 ± 7.59 0.32 ± 0.35 0.33 ± 0.47 0.24 0.30 0.99
COL1A2, FADS1, SFRP1, SULF1, and THBS2) showed unique gene expression alterations only in CRC samples.
More specifically, looking at cellular components of the abovementioned stages of CRC formation, the results showed that epithelial cells in AD express decreased amounts ofSOCS3andPRIMA1,whereas those in CRC ex- press less BCL2, CYP27B1, COL1A2, FADS1, and SULT1A1.
Demethylation treatment of colon adenocarcinoma cell lines led to varying degrees of upregulation of cer- tain transcripts. In HT-29 cell line ALDH1A3 and SOCS3 was found to be upregulated by 0.5 μM 5-Aza.
Interestingly, in HCT-116 cells PTGS2; and in SW480 cell lineTIMP1 showed higher expression after 0.5 and 3μM 5-Aza treatments, as well.
From the resulting marker set, COL1A2, SFRP2, and SOCS3 were hypermethylated and THBS2 was hypo- methylated in both AD and CRC samples compared to NAT. Based on the literature, hypermethylation of COL1A2 was confirmed in head and neck cancer [20], melanoma [21], and bladder cancer [22]. This is suggest- ive that COL1A2 may contribute to the formation of various cancers by modulating cell proliferation and migra- tion. In the gastrointestinal tract, expression of COL1A2 Table 3DNA methylation data of biopsies, macrodissected samples and laser microdissected (LCM) colon epithelial cells(Continued)
CDX1_assay 1 11.26 ± 19.16 1.64 ± 1.16 2.43 ± 2.43 0.29 0.40 0.54
COL1A2 assay 2 19.18 ± 6.95 61.72 ± 18.25 53.46 ± 18.52 p< 0.01 p< 0.01 0.50
COL1A2_assay 1 6.46 ± 3.34 14.06 ± 6.37 22.84 ± 7.00 p< 0.05 p< 0.01 0.07
CYP27B1_assay 1 10.20 ± 12.19 3.28 ± 0.94 7.88 ± 7.06 0.24 0.75 0.19
CYP27B1_assay 2 7.14 ± 8.88 0.50 ± 0.31 6.38 ± 8.64 0.13 0.90 0.17
CYP27B1_assay 4 43.56 ± 2.13 44.90 ± 3.89 45.90 ± 5.26 0.52 0.38 0.74
ENTPD5_assay 1 1.68 ± 0.56 1.74 ± 0.11 1.88 ± 0.60 0.80 0.62 0.62
FADS1_assay 1 12.76 ± 17.16 4.70 ± 7.95 2.94 ± 5.80 0.37 0.26 0.70
MAL_assay 1 11.76 ± 10.80 61.16 ± 40.61 84.68 ± 11.92 p< 0.05 p< 0.01 0.25
PRIMA1_assay 1 4.00 ± 0.85 32.56 ± 31.71 26.42 ± 33.03 0.08 0.17 0.77
PRIMA1_assay 2 2.34 ± 1.13 29.82 ± 22.74 29.45 ± 35.82 p< 0.05 0.13 0.99
PRIMA1_assay 3 21.70 ± 25.92 73.64 ± 28.56 93.55 ± 3.06 p< 0.05 p< 0.01 0.21
PRIMA1_assay 4 0.62 ± 0.73 43.61 ± 29.53 59.91 ± 31.31 p< 0.05 p< 0.01 0.42
PTGDR assay 1 2.95 ± 0.80 3.16 ± 2.52 28.94 ± 10.72 0.87 p< 0.01 p< 0.01
PTGDR assay 2 6.40 ± 3.82 3.56 ± 1.26 23.81 ± 10.40 0.15 p< 0.01 p< 0.01
PTGDR_assay 3 1.63 ± 3.23 1.14 ± 1.45 25.72 ± 20.81 0.77 p< 0.05 p< 0.05
PTGS2_assay 1 5.80 ± 6.58 2.33 ± 0.33 3.05 ± 1.00 0.27 0.44 0.17
PTGS2_assay 2 9.66 ± 8.80 0.83 ± 0.80 18.19 ± 36.43 0.06 0.62 0.32
SFRP1_assay 1 19.03 ± 25.20 78.72 ± 23.36 91.08 ± 5.91 p< 0.01 p< 0.01 0.28
SFRP2_assay 1 12.53 ± 5.01 55.95 ± 31.32 90.78 ± 1.56 p< 0.05 p< 0.01 0.06
SFRP2_assay 2 16.34 ± 9.82 68.90 ± 27.80 85.16 ± 2.56 p< 0.01 p< 0.01 0.29
SOCS3_assay 1 3.86 ± 0.84 6.57 ± 5.39 25.07 ± 14.20 0.30 p< 0.05 p< 0.05
SOCS3_assay 2 14.28 ± 8.30 68.61 ± 35.98 90.36 ± 8.66 p< 0.05 p< 0.01 0.28
SOCS3_assay 3 2.59 ± 2.72 55.24 ± 43.52 85.04 ± 12.02 p< 0.05 p< 0.01 0.23
SULF1_assay 1 4.62 ± 4.06 7.52 ± 8.25 16.12 ± 17.25 0.50 0.18 0.34
SULF1_assay 2 4.75 ± 4.58 8.35 ± 12.00 8.46 ± 4.78 0.59 0.31 0.99
SULT1A1_assay 1 2.54 ± 1.05 4.63 ± 3.81 4.02 ± 2.15 0.27 0.20 0.76
SULT1A1_assay 2 45.35 ± 7.51 38.07 ± 4.36 56.53 ± 26.33 0.10 0.39 0.16
SULT1A1_assay 3 13.90 ± 16.07 7.69 ± 8.11 7.87 ± 12.23 0.47 0.57 0.98
THBS2_assay 1 13.64 ± 6.67 45.55 ± 25.89 49.61 ± 8.64 p< 0.05 p< 0.01 0.75
THBS2_assay 2 90.83 ± 2.02 84.92 ± 8.28 83.33 ± 10.87 0.16 0.17 0.80
THBS2_assay 3 90.16 ± 2.37 87.54 ± 3.22 78.65 ± 8.85 0.18 p< 0.05 0.07
THBS2_assay 4 24.84 ± 18.37 42.88 ± 8.47 42.48 ± 18.50 0.11 0.33 0.97
TIMP1_assay 1 32.62 ± 21.75 15.35 ± 20.90 5.35 ± 2.27 0.24 p< 0.05 0.32
Fig. 3Heatmap representing level of DNA methylation ina) NAT, AD, and CRC biopsies and macrodissected samples and inb) NAT, AD and CRC LCM epithelial cells. Intensity values on the colour scale were as follows: red - high intensity, black - intermediate intensity, green - low intensity.
Samples are shown in columns, selected genes are in rows. Similar DNA methylation pattern could be found in both sample types, asPRIMA1, SFRP1,SFRP2,MAL,SOCS3,CYP27B1,COL1A2andSULT1A1showed relatively high DNA methylation levels in colon biopsies and LCM epithelial cells
Fig. 4Normalised Ct values of selected miRNAs (hsa-miR-21, hsa-miR-21*, hsa-miR-181c, hsa-let-7i*) targeting the selected marker set. Raw Ct data were substracted from the maximal qPCR cycle number (45) and data were normalised with interplate calibrators and also with miR-423-5p Ct values. Red dots represent individual miRNA normalised Ct values, box plots represent median and standard deviation of the data
may be associated with endothelial-to-mesenchymal transi- tion [23]. Collagen production of carcinoma cells decreases during oncogenic transformation [24]; and, hypermethyla- tion of COL1A2 was confirmed in several CRC cell lines (HCT 116, SW480, and SW620) as well as in primary CRC tissues [25].SFRP2is a member of the well-known inhibi- tors of Wnt pathway, abnormal activation of which (e.g. via APCmutation or beta-catenin translocation) is a frequent and early event in the genesis of CRC [26]. It has already been shown to be hypermethylated in colorectal cancer cell lines (e.g. HCT116) as well as primary CRC [27, 28]. Fur- thermore, it has recently been recognised as a promising and sensitive marker of stool-based screening of CRC [26].
SOCS3is a negative regulator of the JAK-STAT3 pathway;
therefore, it may effect cell proliferation and cell cycle [29].
Mutational analysis of the gene revealed no marked associ- ation betweenSOCS3promoter region polymorphisms and the risk of developing metastatic colorectal cancer [30]. Epi- genetic inactivation ofSOCS3was reported in human ma- lignant melanomas and glioblastoma multiforme [31, 32].
Reduced gene expression ofSOCS3was found in the colitis
ulcerosa (UC) to CRC progression from low-grade dyspla- sia to CRC. Related to this, DNA methylation of SOCS3 could also be detected in colonic biopsies of UC-CRC pa- tients but not from healthy controls or from inactive UC patients [33, 34]. THBS2 hypermethylation might be re- sponsible for altered expression of thrombospondin-2 pro- tein in ovarian cancer and endometrial adenocarcinomas [35]. Thrombospondin-2 is an antiangiogenetic factor in CRC and its expression was associated with angiogenesis and metastasis formation inhibition in CRC [36].
The set ofBCL2, PRIMA1,and PTGDRshowed hyper- methylation only in CRC. BCL2 (B-cell CLL/lymphoma 2) is an apoptotic inhibitor. Its hypermethylation was documented in breast cancer [37] and bladder cancer [38]. Bcl-2 protein plays a role in CRC formation [39]
and has a reduced expression in CRCs with microsatel- lite instability [40]. DNA hypermethylation ofBCL2was detected in CRC cases; however, there was no relation- ship between gene expression and methylation of spe- cific CpG sites [41]. PRIMA1 encodes a membrane protein anchoring acetylcholinesterase to cell membranes
Fig. 5Continuously decreasing SFRP1 protein expression could be observed along colorectal adenoma-carcinoma development in epithelial/CRC compartment of NAT (a), AD (b), and CRC (c) samples. SFRP1 protein expression of healthy epithelial cells (a,white arrows) was compared to that in endogenous myofibroblasts (a,red arrows) with strong (+3) immunopositivity (digital microscopy images, 90x magnification, scale bar: 20μm).
Semiquantitative immunohistochemistry results (Q-score values) of NAT, AD, and CRC specimens are summarised as bar charts with whiskers representing standard deviation (d)
[42]. Its promoter hypermethylation was detected in major depressive disorder with a concomitant decrease in gene expression [43]. It has not yet been associated with CRC development. Decreased mRNA expression levels of PTGDRgenes in colorectal AD and CRC caused by DNA methylation were previously described [8].
In summaryMAL, PRIMA1, PTGDRandSFRP1showed a downregulation of gene expression and in parallel in- creasing DNA methylation level that correlated with CRC development. Meanwhile, BCL2, CDX1, ENTPD5 and SULT1A1 dowregulation was not accompanied with sig- nificant DNA methylation changes; thus, other regulatory processes should be further investigated to understand these changes in gene expression.
After DNA methylation analysis of candidate genes with altered gene expression, the potential influence of DNA methylation on the protein level was also investi- gated. Significantly decreasing protein levels of SFRP1 could be observed along the adenoma-carcinoma se- quence. This result is in accordance with the literature, as epigenetic regulation ofSFRP1 can lead to decreased protein levels [44, 45].
On a limited sample set miRNAs with upregulation along the AD-CRC sequence were also identified. miR- 21 was found to be remarkably upregulated in AD and CRC samples compared to NAT controls. On the basis of in silicoprediction miR-21 can target genes showing no remarkable alteration in their promoter methylation (e.g. BCL2, MAL, PTGS2) during CRC development, that might influence their gene expression levels. miR- 21 is known to play role in tumour formation and was also found to be upregulated in CRC tissues along tumour formation [46, 47]. The expression level of miR- 21 is elevated both in colorectal adenomas and cancers, and the degree of upregulation correlates with more ad- vanced stages of CRC [7]. This small non-coding RNA could have a fundamental role in the progression of CRC, as elevated level of miR-21 was found to be pre- dictive of poor survival [48], that may increase prolifera- tion, migration and invasion. In CRC cell lines with the EMT phenotype the expression of miR-21 oncomiR is regulated by AP-1 and ETS transciption factors and also by epigenetic factors. Activating histone modifications (H3K3me3, H3K914ac, H3K27ac), but no inactivating were detected on miR-21 promoter region [49]. These epigenetic mechanisms can affect the binding affinity of transcription factors to the miR-21 promoter regulating its expression level. Upregulated miR-181 in CRC cases might also influence gene expression level of the Bcl-2 family members [50].
Conclusion
In summary, we identified 18 transcripts with changes in gene expression that correlate with CRC development. On
the basis of genome-wide gene expression-based screening we could identify genes potentially downregulated by pro- moter hypermethylation. Silencing of the markers identi- fied in our study by hypermethylation or miRNA upregulation can result in reduced gene expression lead- ing to decreased protein levels contributing to CRC formation.
Additional files
Additional file 1: Table S1.Clinical data of the analysed gene expression datasets (GSE4183, GSE37364, GSE10714 and GSE15960).
(DOC 249 kb)
Additional file 2: Table S2.Clinical data of patients involved in the study. (DOCX 24 kb)
Additional file 3: Figure S1.Gene expression of the selected marker set in normal (n= 49), adenoma (n= 49), and tumour (n= 49) biopsy samples. Results are represented as pairwise box plots showing single gene expession in the biopsy and in the laser microdissected epithelial cells from normal (n= 6), adenoma (n= 6), and tumour (n= 6). Red dots are normalised gene expression values, box plots represent median and standard deviation of the data. Asterisk (*) represents significance (p< 0.05) in adenoma and tumour samples compared to normals and double asterisk (**) represents significance (p< 0.05) in tumour samples compared to adenomas. Each box plot has individual scale of gene expression. Changes in the direction of gene expression was found to be similar in colon biopsies and in LCM epithelial cells. (PDF 296 kb) Additional file 4: Table S3.Summary of gene expression and DNA methylation data. (XLS 49 kb)
Additional file 5: Figure S2.Box plot representation of DNA methylation alterations of analysed genes in biopsies and macrodissected specimens of NAT (n= 10), AD (n= 10), and CRC (n= 10) and in LCM epithelial cells of NAT (n= 5), AD (n= 5) and CRC (n= 5). Red dots are individual DNA methylation percent values, box plots represent median and standard deviation of the data. Asterisk (*) represents significance (p< 0.05) in adenoma and tumour samples compared to normals and double asterisk (**) represents significance (p< 0.05) in tumour samples compared to adenomas. Each box plot has individual scale of DNA methylation percent. Certain genes showe hypermethylation in colon biopsies and also in LCM epithelial cells (e.g.MAL, PRIMA1, PTGDR, SFRP2), while there were genes with no remarkable DNA methylation level alterations (e.g.BCL2, CDX1, PTGS2, SULF1). Macro = macrodissected samples, LCM = laser microdissected epithelial cells. (PDF 359 kb)
Abbreviations
NAT:Normal tissue adjacent to tumour; AD: Adenoma; CRC: Colorectal cancer; LCM: Laser capture microdissection; CpG: CG dinucleotide;
bcDNA: bisulfite-converted DNA; BS-PCR: Bisulfite-sequencing PCR;
emPCR: emulsion-PCR; FFPE: Formalin-fixed and paraffin-embedded;
TMA: Tissue microarray.
Competing interests
The authors declare that they have no competing interests.
Authors’contributions
AK, BP, PH, and AVP performed the DNA methylation analysis; OG, SS, KT, and KL performed the microarray experiments; BW and AB conducted bioinformatical analyses; GV analysed immunhistochemistry results; NZS performed miRNA expression experiments, ZT, IK, BM contributed to the design and critical review of the manuscript. All authors read and approved the final manuscript.
Acknowledgements
This study was supported by the National Office for Research and Technology, Hungary (TECH_08-A1/2-2008-0114 and NFÜ-KMR 12-1-2012-0216 grants) and by the Hungarian Scientific Research Fund (OTKA-103244 and OTKA-K111743