Orsolya Galamb, Barnabás Wichmann, Gábor Valcz, Zsolt Tulassay, Béla Molnár, Molecular Medicine Research Group, Hungarian Academy of Sciences, H-1088 Budapest, Hungary Orsolya Galamb, Alexandra Kalmár, Barbara Kinga Barták, Árpád V Patai, Katalin Leiszter, Bálint Péterfia, 2nd Department of Internal Medicine, Semmelweis University, H-1088 Budapest, Hungary
Gábor Veres, 1st Department of Paediatrics, Semmelweis University, H-1083 Budapest, Hungary
Author contributions: Galamb O, Kalmár A, Péterfia B and Molnár B designed the study; Patai AV, Veres G and Molnár B collected the samples; Galamb O, Patai AV, Leiszter K, Valcz G and Veres G contributed to the collection of clinical data and histological analysis of the samples; Galamb O, Kalmár A, Barták BK and Patai AV performed the experiments; Galamb O, Kalmár A, Wichmann B and Valcz G analyzed the experimental data; Tulassay Z and Molnár B contributed to the design and critical review of the manuscript, obtained fundings; all authors were involved in writing the paper, made a critical revision of the manuscript for important intellectual content and had final approval of the submitted and published versions.
Supported by the National Research, Development and Innovation Office, No. KMR-12-1-2012-0216; and the Hungarian Scientific Research Fund, No. OTKA-K111743.
Institutional review board statement: All routine colonic biopsy samples from the patients were taken after informed consent and ethical permission was obtained for participation in the study.
Conflict-of-interest statement: The authors declare that no conflict of interest exists.
Data sharing statement: Additional data are available in a supplementary file.
Open-Access: This article is an open-access article which was selected by an in-house editor and fully peer-reviewed by external reviewers. It is distributed in accordance with the Creative
Commons Attribution Non Commercial (CC BY-NC 4.0) license, which permits others to distribute, remix, adapt, build upon this work non-commercially, and license their derivative works on different terms, provided the original work is properly cited and the use is non-commercial. See: http://creativecommons.org/
licenses/by-nc/4.0/
Manuscript source: Invited manuscript
Correspondence to: Orsolya Galamb, PhD, 2nd Department of Internal Medicine, Semmelweis University, Szentkirályi str 46, H-1088 Budapest, Hungary. orsg1@yahoo.com
Telephone: +36-1-2660926 Fax: +36-1-2660816 Received: June 22, 2016
Peer-review started: June 24, 2016 First decision: August 22, 2016 Revised: September 20, 2016 Accepted: November 12, 2016 Article in press:
Published online: December 21, 2016
Abstract
AIMTo analyze colorectal carcinogenesis and age-related DNA methylation alterations of gene sequences associated with epigenetic clock CpG sites.
METHODS
In silico DNA methylation analysis of 353 epigenetic clock CpG sites published by Steve Horvath was performed using methylation array data for a set of 123 colonic tissue samples [64 colorectal cancer (CRC), 42 adenoma, 17 normal; GEO accession number:
GSE48684]. Among the differentially methylated age- related genes, secreted frizzled related protein 1 (SFRP1) promoter methylation was further investigated in colonic tissue from 8 healthy adults, 19 normal DOI: 10.3748/wjg.v22.i47.10325 © 2016 Baishideng Publishing Group Inc. All rights reserved.
ORIGINAL ARTICLE
Aging related methylation influences the gene expression of key control genes in colorectal cancer and adenoma
Basic Study
Orsolya Galamb, Alexandra Kalmár, Barbara Kinga Barták, Árpád V Patai, Katalin Leiszter, Bálint Péterfia, Barnabás Wichmann, Gábor Valcz, Gábor Veres, Zsolt Tulassay, Béla Molnár
children, 20 adenoma and 8 CRC patients using bisulfite-specific PCR followed by methylation-specific high resolution melting (MS-HRM) analysis. mRNA expression of age-related “epigenetic clock” genes was studied using Affymetrix HGU133 Plus2.0 whole transcriptome data of 153 colonic biopsy samples (49 healthy adult, 49 adenoma, 49 CRC, 6 healthy children) (GEO accession numbers: GSE37364, GSE10714, GSE4183, GSE37267). Whole promoter methylation analysis of genes showing inverse DNA methylation- gene expression data was performed on 30 colonic samples using methyl capture sequencing.
RESULTS
Fifty-seven age-related CpG sites including hyper- methylated PPP1R16B, SFRP1, SYNE1 and hypo- methylated MGP, PIPOX were differentially methylated between CRC and normal tissues (P < 0.05, ∆β ≥ 10%). In the adenoma vs normal comparison, 70 CpG sites differed significantly, including hypermethylated DKK3, SDC2, SFRP1, SYNE1 and hypomethylated CEMIP, SPATA18 (P < 0.05, ∆β ≥ 10%). In MS-HRM analysis, the SFRP1 promoter region was significantly hypermethylated in CRC (55.0% ± 8.4 %) and adenoma tissue samples (49.9% ± 18.1%) compared to normal adult (5.2% ± 2.7%) and young (2.2% ± 0.7%) colonic tissue (P < 0.0001). DNA methylation of SFRP1 promoter was slightly, but significantly increased in healthy adults compared to normal young samples (P < 0.02). This correlated with significantly increased SFRP1 mRNA levels in children compared to normal adult samples (P
< 0.05). In CRC tissue the mRNA expression of 117 age- related genes were changed, while in adenoma samples 102 genes showed differential expression compared with normal colonic tissue (P < 0.05, logFC > 0.5). The change of expression for several genes including SYNE1, CLEC3B, LTBP3 and SFRP1, followed the same pattern in aging and carcinogenesis, though not for all genes (e.g., MGP).
CONCLUSION
Several age-related DNA methylation alterations can be observed during CRC development and progression affecting the mRNA expression of certain CRC- and adenoma-related key control genes.
Key words: DNA methylation; Aging; Colorectal cancer;
Adenoma; Epigenetic drift; Epigenetic clock; Secreted frizzled related protein 1
© The Author(s) 2016. Published by Baishideng Publishing Group Inc. All rights reserved.
Core tip: Several age-related DNA methylation altera- tions could be observed during colorectal cancer (CRC) formation and progression affecting the mRNA expression of certain CRC- and adenoma-related key control genes such as hypermethylated secreted frizzled related protein 1 (SFRP1), spectrin repeat containing nuclear envelope protein 1 and hypomethylated cell migration-inducing protein. For the first time
significantly lower SFRP1 methylation levels were demonstrated in colonic tissue from children (under 18 years) compared to healthy adults. The main CRC- associated signal transduction pathways, such as WNT signaling and PI3K/Akt pathways are also influenced during aging.
Galamb O, Kalmár A, Barták BK, Patai AV, Leiszter K, Péterfia B, Wichmann B, Valcz G, Veres G, Tulassay Z, Molnár B. Aging related methylation influences the gene expression of key control genes in colorectal cancer and adenoma. World J Gastroenterol 2016; 22(47): 10325-10340 Available from: URL: http://www.
wjgnet.com/1007-9327/full/v22/i47/10325.htm DOI: http://
dx.doi.org/10.3748/wjg.v22.i47.10325
INTRODUCTION
DNA methylation alterations in connection with aging include epigenetic drift and epigenetic clock phenomena. Epigenetic drift is defined as the global DNA methylation changes caused by random and environmental individual-specific factors, while the epigenetic clock is defined as a group of progressive age-related epigenetic alterations at specific geno- mic sites which are common across individuals and occassionally across various tissue types[1,2]. The epigenetic clock concept is an approach to biological age prediction of different tissues based on the DNA methylation status of 353 CpG sites measured using the Illumina Beadchip450K methylation array platform[2].
Although age-related (A type) and cancer-related (C type) DNA methylation are often distinguished, the main age-related disease is cancer and the age of patients is one of the risk factor for carcinogenesis[3]. In human development, following a transient increase in average DNA methylation in early childhood (during the first year of life)[4,5], global hypomethylation is characteristic during aging[6,7]. Similarly global hypomethylation is observed in various types of cancers including colorectal cancer (CRC)[8]. With aging, besides global hypomethylation, local hypermethylation can occur on promoters of certain genes, including tumor suppressor gene promo- ters in various types of cancers, and many tumor suppressor genes were reported among the age- dependently hypermethylated genes[6]. Among others, promoter hypermethylation of APC[7,9-12], CDKN2A[7,9], ESR1[7,13,14], GATA5[15,16], HPP1[7,15,17], SFRP1[7,12,15,18-23]
and SFRP2[7,18-21] genes was reported for colonic tissues during both aging and colorectal carcinogenesis.
Although DNA methylation data from adult colonic tissue samples has been expansively published, data for children/young patients are limited.
In this study, we analyzed DNA methylation and/or gene expression changes of genes covered by the 353 epigenetic clock CpG sites[2] for patients of different
ages as well as stages in the progression through to CRC in order to study the possible relationship between age-related and cancer-associated epigenetic alterations. Gene expression analysis was performed using colonic tissue samples from healthy children, healthy adults, and patients with adenomas and CRC.
Among the differentially methylated/expressed age- related genes, secreted frizzled related protein 1 (SFRP1) promoter methylation was further analyzed in healthy, premalignant and cancerous colonic tissue samples, and to our knowledge this is the first study to also include colonic biopsy specimens from children.
MATERIALS AND METHODS
In silico DNA methylation analysis
The DNA methylation status of 353 age-related CpG sites[2] was analyzed in silico using methylation array data from the Illumina BeadChip450K.
Analysis was performed on 123 CRC, adenoma and normal tissue samples available in the NCBI Gene Expression Database database (GEO accession number: GSE48684[24]). Differences between average methylation values of the compared diagnostic groups (∆β-values) and P values were determined for each CpG site (cg IDs). For statistical evaluation, normal distribution was checked using Kolmogorov-Smirnov test. Hence normal distribution was observed in any cases, Student’s t-test with Benjamini and Hochberg correction was applied for paired group comparisons.
Significance criteries were P < 0.05 in all cases.
In silico gene expression analysis
The expression of age-related “epigenetic clock”
genes was analyzed using whole transcriptome data from Affymetrix HGU133 Plus2.0. Data was obtained from 153 colonic biopsy samples (49 healthy, 49 adenoma, 49 CRC and 6 healthy children) previously hybridized by our research group (GEO serial accession numbers: GSE37364[25], GSE10714[26], GSE4183[27], GSE37267[28]). Gene expression levels were compared using unpaired Student’s t-test with Benjamini and Hochberg correction (P value of < 0.05 was considered as significant). For gene expression analysis, normal distribution was found using Kolmogorov-Smirnov test, therefore Student’s t-test (in case of differentiation of two groups with equal variances) or Welch-test (in case of differentiation of two groups with unequal variances) and ANOVA (when more than two groups were compared) were applied. For paired comparisons Benjamini and Hochberg correction was applied. In case of ANOVA, Tukey HSD post-test was used in order to find out which group refers to the differentiation if any. Significance criteries were P < 0.05 in any cases.
For the logFC calculation, the differences between the averages of groups were considered (abs logFC ≥ 0.5 criteria).
Methyl capture sequencing - in silico data analysis Whole methylome data from 6 normal adjacent tissue (NAT), 15 adenoma and 9 CRC tissue samples were determined in a previous study using methyl capture sequencing[12]. Using this dataset, the whole promoter methylation status of genes showing an inverse relation between gene expression and DNA methylation was evaluated. Differentially methylated genes were deter- mined as described earlier[12]. For statistical evaluation normal distribution was determined and the applied tests were chosen according to the above-mentioned criteria. Differences with P < 0.05 were considered as significant. Methylation alterations between diagnostic groups were characterized by ∆β-values (the differences of the average β-values of sample groups).
Clinical samples
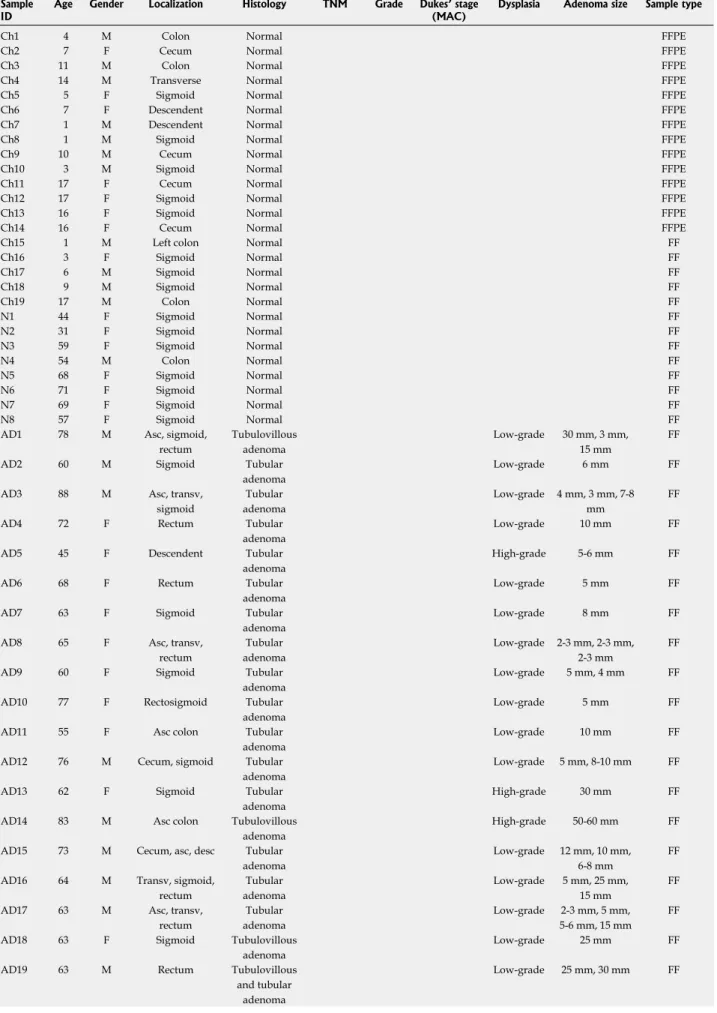
All patients provided informed consent. Colorec- tal biopsy samples were obtained during routine endoscopic intervention at the 2nd Department of Internal Medicine and 1st Department of Paediatrics, Semmelweis University, Budapest, Hungary. In total 55 colonic tissue samples (from 19 healthy children (under age of 18 years), 8 healthy adults, 20 patients with adenomas and 8 CRC samples) were tested in SFRP1 methylation-specific high resolution melting (MS-HRM) study (Table 1). Biopsy samples from all adults and 5 of children were stored in RNALater Stabilization Solution (Ambion, ThermoFisher Scientific) at -80 ℃ until use. Biopsy samples from the same site were immediately fixed in buffered formalin for histological evaluation. For 14 children, only FFPE blocks were available. Histological diagnoses were established by experienced pathologists. Altogether 27 tissue samples (19 from children and 8 from adults) with normal histology (so called healthy normal colonic tissue samples) were involved in SFRP1 MS-HRM study.
Children and adults in the study had been referred to the outpatient clinic with rectal bleeding, constipation or chronic abdominal pain. Ileocolonoscopy was part of their diagnostic procedure (exclude organic disease) and the biopsy specimens showed normal macroscopic appearance and histology[28]. The study was conducted according to the Helsinki declaration and approved by the local ethics committee and government authorities (Regional and Institutional Committee of Science and Research Ethics (TUKEB) Nr.: 69/2008, 202/2009 and 23970/2011 Semmelweis University, Budapest, Hungary).
DNA isolation
Tissue samples were homogenized in 2% sodium dodecyl sulphate, and digested with 4 mg/mL proteinase K for 16 h at 56 ℃. Genomic DNA was isolated using the High Pure PCR Template Preparation Kit (Roche Applied Science) according to the manufacturer’s instructions[18].
Table 1 Clinical data of samples involved in the high resolution melting study Sample
ID Age Gender Localization Histology TNM Grade Dukes’ stage
(MAC) Dysplasia Adenoma size Sample type
Ch1 4 M Colon Normal FFPE
Ch2 7 F Cecum Normal FFPE
Ch3 11 M Colon Normal FFPE
Ch4 14 M Transverse Normal FFPE
Ch5 5 F Sigmoid Normal FFPE
Ch6 7 F Descendent Normal FFPE
Ch7 1 M Descendent Normal FFPE
Ch8 1 M Sigmoid Normal FFPE
Ch9 10 M Cecum Normal FFPE
Ch10 3 M Sigmoid Normal FFPE
Ch11 17 F Cecum Normal FFPE
Ch12 17 F Sigmoid Normal FFPE
Ch13 16 F Sigmoid Normal FFPE
Ch14 16 F Cecum Normal FFPE
Ch15 1 M Left colon Normal FF
Ch16 3 F Sigmoid Normal FF
Ch17 6 M Sigmoid Normal FF
Ch18 9 M Sigmoid Normal FF
Ch19 17 M Colon Normal FF
N1 44 F Sigmoid Normal FF
N2 31 F Sigmoid Normal FF
N3 59 F Sigmoid Normal FF
N4 54 M Colon Normal FF
N5 68 F Sigmoid Normal FF
N6 71 F Sigmoid Normal FF
N7 69 F Sigmoid Normal FF
N8 57 F Sigmoid Normal FF
AD1 78 M Asc, sigmoid,
rectum
Tubulovillous adenoma
Low-grade 30 mm, 3 mm, 15 mm
FF
AD2 60 M Sigmoid Tubular
adenoma
Low-grade 6 mm FF
AD3 88 M Asc, transv,
sigmoid
Tubular adenoma
Low-grade 4 mm, 3 mm, 7-8 mm
FF
AD4 72 F Rectum Tubular
adenoma
Low-grade 10 mm FF
AD5 45 F Descendent Tubular
adenoma
High-grade 5-6 mm FF
AD6 68 F Rectum Tubular
adenoma
Low-grade 5 mm FF
AD7 63 F Sigmoid Tubular
adenoma
Low-grade 8 mm FF
AD8 65 F Asc, transv,
rectum
Tubular adenoma
Low-grade 2-3 mm, 2-3 mm, 2-3 mm
FF
AD9 60 F Sigmoid Tubular
adenoma
Low-grade 5 mm, 4 mm FF
AD10 77 F Rectosigmoid Tubular
adenoma
Low-grade 5 mm FF
AD11 55 F Asc colon Tubular
adenoma
Low-grade 10 mm FF
AD12 76 M Cecum, sigmoid Tubular
adenoma
Low-grade 5 mm, 8-10 mm FF
AD13 62 F Sigmoid Tubular
adenoma
High-grade 30 mm FF
AD14 83 M Asc colon Tubulovillous
adenoma
High-grade 50-60 mm FF
AD15 73 M Cecum, asc, desc Tubular
adenoma
Low-grade 12 mm, 10 mm, 6-8 mm
FF
AD16 64 M Transv, sigmoid,
rectum
Tubular adenoma
Low-grade 5 mm, 25 mm, 15 mm
FF
AD17 63 M Asc, transv,
rectum
Tubular adenoma
Low-grade 2-3 mm, 5 mm, 5-6 mm, 15 mm
FF
AD18 63 F Sigmoid Tubulovillous
adenoma
Low-grade 25 mm FF
AD19 63 M Rectum Tubulovillous
and tubular adenoma
Low-grade 25 mm, 30 mm FF
DNA was eluted in 2 × 100 μL RNase- and DNase-free water and stored at -20 ℃. The quantity of the isolated DNA samples was measured by Qubit fluorometer using the Qubit dsDNA HS Assay (Invitrogen, ThermoFisher Scientific).
Bisulfite-specific PCR and MS-HRM experiments for SFRP1 promoter methylation analysis
Bisulfite conversion was performed using the EZ DNA Methylation Direct™ Kit (Zymo Research, Irvine, CA, United States) according to the manufacturer’s instructions. For fresh frozen samples, 500 ng isolated DNA was converted, while for FFPE samples the total recovered DNA after deparaffinization and digestion was bisulfite converted. Bisulfite-specific PCR (BS- PCR) reactions were performed in 15 μL volume using LightCycler 480 Probes Master (Roche Applied Science), LightCycler® 480 ResoLight Dye (Roche), SFRP1 primers at 0.2 μmol/L final concentrations and bisulfite converted DNA (bcDNA) samples (approx, 5 ng bcDNA/well). The sequences of the applied SFRP1 BS-PCR primers were previously described[19]. Real- time PCR amplification was carried out on LightCycler 480 System with the following thermocycling con- ditions: 95 ℃ for 10 min, then 95 ℃ for 30 s, 62 ℃ with 0.4 ℃ decreasement/cycle for 30 s, 72 ℃ for 30 s for 10 touchdown cycles, followed by the amplification at 95 ℃ for 30 s, 58 ℃ for 30 s, and 72 ℃ for 30 s in 50 cycles. For HRM calibration, unmethylated and methylated bisulfite converted control DNA (EpiTect PCR Control DNA Set, Qiagen) were used in different ratios (0%, 10%, 25%, 50%, 75% and 100%
methylated controls). HRM analyis was performed according to the following thermal conditions: after denaturation at 95 ℃ for 1 min, and cooling at 40 ℃ for 1 min, the reactions were continuously warmed up to 95 ℃ with a 25 acquisition/℃ rate. Raw HRM data were exported and the HRM peak heights of the negative derivative of fluorescence over temperature curves (-(d/dT) Fluorescence) of the biological sam- ples were retrieved at the melting temperatures of the methylated and unmethylated standards. The methylation percent was calculated by the ratio of values at the methylated and unmethylated melting temperatures. For statistical evaluation normal
distribution was determined and the applied tests were chosen according to the above-mentioned criteria.
SFRP1 immunohistochemistry
Parallel with our epigenetic examinations, 4 nm thick FFPE samples from healthy children (n = 6) and healthy adults (n = 7) were examined. SFRP1 immunohistochemistry was performed on colonic tissue samples of healthy adults (n = 7; mean age at histology examination: 48 ± 17 years; 5 f/2 m) and of children (mean age: 12 ± 6 years); 3f/3m). Histology was diagnosed by an expert pathologist on routinely stained HE sections. Following deparaffinization and rehydration, microwave based antigen retrieval was performed in TRIS EDTA buffer (pH 9.0) (900 W/10 min, then 340 W/40 min). Samples were immunostained with SFRP1 polyclonal antibody (ab4193, Abcam, Cambridge, United Kingdom, 1:80 dilution) with diaminobenzidine - hydrogen peroxidase - chromogen-substrate system (cat#30014.K, HISTOLS- DAB, Histopathology Ltd., Hungary) and were digitalized by Pannoramic 250 Flash II scanner (with Zeiss Plan- Apochromat 20 × objective; 3DHISTECH Ltd, Hungary).
Digital slides were semi-quantitatively analyzed with Pannoramic Viewer (ver.:1.15.3; 3DHISTECH) based on Q-score method (scored by multiplying the percentage of positive cells (P) by the intensity (I: +3, +2, +1, 0). Formula: Q = P × I; Maximum = 300). Epithelial and stromal compartments were examined separately, then these scores were summarized (Σ) (Σ Q-score maximum: 600) in order to have comparable results with our whole biopsy methylation analyses.
Statistical analysis
The applied statistical methods are outlined above after the descriptions of molecular and in silico analyses.
The statistical review of the study was performed by a biomedical statistician.
RESULTS
Gene ontology of 353 CpG sites of the "epigenetic clock"
The “epigenetic clock” signature includes 353 CpG sites[2] including different genes, gene promoters and
AD20 87 M Sigmoid, rectum Tubulovillous adenoma
Low-grade 20 mm, 15 mm FF
AD21 63 F Sigmoid Tubulovillous
adenoma
Low-grade 25 mm FF
CRC1 67 F Sigmoid Adenocarcinoma Unknown Unknown Unknown FF
CRC2 76 F Hepatic flexure Adenocarcinoma T2N0M0 2 B1 FF
CRC3 73 F Sigmoid Adenocarcinoma T3N2M1 2 D FF
CRC4 65 M Sigmoid Adenocarcinoma T2N0M0 1 B1 FF
CRC5 85 F Cecum Adenocarcinoma T2N0M0 2 B1 FF
CRC6 60 M Hepatic flexure Adenocarcinoma unknown D FF
CRC7 68 M Sigmoid, rectum Adenocarcinoma T3N0M0 1 B2 FF
CRC8 87 F Sigmoid Adenocarcinoma T3N0M0 2 B2 FF
Ch: Children; N: Normal; Ad: Adenoma; CRC: Colorectal cancer.
other genomic regions such as enhancers, insulators, Polycomb-repressed regions. From the above 353 CpG sites, DNA methylation levels of 193 were positively and of 160 were negatively correlated with age[2].
First we updated the annotation of the CpG sites and assigned official gene symbols according to the newest version of NCBI Gene Database. Approximately 80% of the genes belonging to 353 CpG sites could be classified into functional groups including highly represented transcriptional regulation, translation (15.93%), metabolism (12.36%), development and ontogenesis (8.24%) and transport (8.24%).
Approximately 20% of the genes had unknown function. According to the Encode ChromHMM results of nine human cell lines, the majority of the 353 CpG sites (76.2 %) were located in the promoter regions of genes. Also, 57.2% of them were categorized as active promoters (declared if it was found “active promoter” in at least one of the nine analyzed cell lines), while 19% were found to be “weak promoter”
(“weak promoter” in at least one of the nine analyzed cell lines). One fourth (23.8%) of the CpG sites was located in non-promoter regions such as enhancers, insulators, transcribed and repressed regions (Supple- mentary Table 1).
In silico DNA methylation analysis
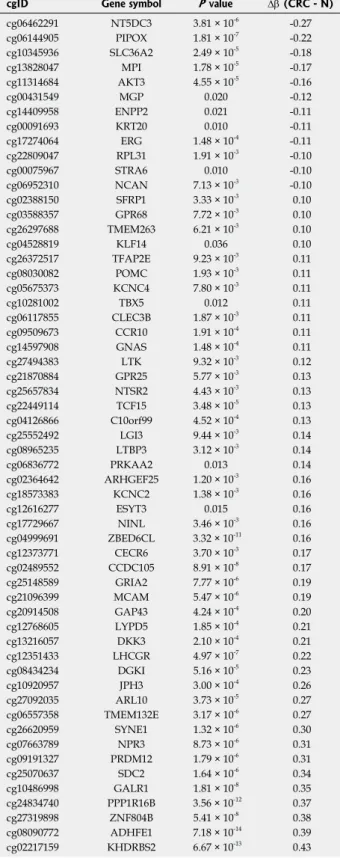
Analysis of the Illumnina Beadchip450K methylation array data set of Luo et al[24] showed 137 (38.8%) of the epigenetic clock CpG sites were found to be significantly differentially methylated between CRC and normal tissue samples (P < 0.05). Approximately two third of these CpG sites had similar methylation changes in CRC samples as during aging, while one third of these CpG sites showed opposite alterations in CRC tissue as during aging (Supplementary Table 1). Among these, 57 CpG sites showed at least a 10% methylation difference: from the 57 CpG sites 45 were hypermethylated (including ADHFE1/
cg08090772, MCAM/cg21096399, DKK3/cg13216057, SFRP1/cg02388150, SYNE1/cg26620959), while 12 CpG sites showed hypomethylation (such as MGP/
cg00431549, PIPOX/cg06144905, STRA6/cg00075967, ERG/cg17274064) in CRCs (P < 0.05, ∆β ≥ 10%) (Table 2, Supplementary Table 1). In the adenoma vs normal comparison, DNA methylation of 165 CpG sites (46.7%) were significantly altered from which 70 CpG sites showed a ≥ 10% methylation difference: 36 CpG sites were hypermethylated (e.g., SDC2/cg25070637, SFRP1/cg02388150, SYNE1/cg26620959) and 34 showed decreased methylation levels (including CEMIP/cg20828084, SPATA18/cg03103192, STRA6/
cg00075967) in adenoma samples (P < 0.05, ∆ β ≥ 10%) (Table 3). In CRC samples 33 CpG sites were found to be hypermethylated (such as KRT20/
cg00091693, STRA6/cg00075967, UROS/cg19346193) and only one (LTBP3/cg08965235) was hypomethylated compared to adenomas (P < 0.05, ∆β ≥ 10%) (Table 4).
A heatmap for the differentially methylated epigenetic clock CpG sites (P < 0.05, ∆β ≥ 10%), with hierarchical cluster analysis results of normal, adenoma and CRC samples is shown in Figure 1.
Table 2 Significant DNA methylation alterations of age- related CpG sites in CRC samples compared to normal tissue
cgID Gene symbol P value ∆β (CRC - N)
cg06462291 NT5DC3 3.81 × 10⁻⁶ -0.27
cg06144905 PIPOX 1.81 × 10⁻⁷ -0.22
cg10345936 SLC36A2 2.49 × 10⁻⁵ -0.18
cg13828047 MPI 1.78 × 10⁻⁵ -0.17
cg11314684 AKT3 4.55 × 10⁻⁵ -0.16
cg00431549 MGP 0.020 -0.12
cg14409958 ENPP2 0.021 -0.11
cg00091693 KRT20 0.010 -0.11
cg17274064 ERG 1.48 × 10⁻⁴ -0.11
cg22809047 RPL31 1.91 × 10⁻³ -0.10
cg00075967 STRA6 0.010 -0.10
cg06952310 NCAN 7.13 × 10⁻³ -0.10
cg02388150 SFRP1 3.33 × 10⁻³ 0.10
cg03588357 GPR68 7.72 × 10⁻³ 0.10
cg26297688 TMEM263 6.21 × 10⁻³ 0.10
cg04528819 KLF14 0.036 0.10
cg26372517 TFAP2E 9.23 × 10⁻³ 0.11
cg08030082 POMC 1.93 × 10⁻³ 0.11
cg05675373 KCNC4 7.80 × 10⁻³ 0.11
cg10281002 TBX5 0.012 0.11
cg06117855 CLEC3B 1.87 × 10⁻³ 0.11
cg09509673 CCR10 1.91 × 10⁻⁴ 0.11
cg14597908 GNAS 1.48 × 10⁻⁴ 0.11
cg27494383 LTK 9.32 × 10⁻³ 0.12
cg21870884 GPR25 5.77 × 10⁻³ 0.13
cg25657834 NTSR2 4.43 × 10⁻³ 0.13
cg22449114 TCF15 3.48 × 10⁻⁵ 0.13
cg04126866 C10orf99 4.52 × 10⁻⁴ 0.13
cg25552492 LGI3 9.44 × 10⁻³ 0.14
cg08965235 LTBP3 3.12 × 10⁻³ 0.14
cg06836772 PRKAA2 0.013 0.14
cg02364642 ARHGEF25 1.20 × 10⁻³ 0.16
cg18573383 KCNC2 1.38 × 10⁻³ 0.16
cg12616277 ESYT3 0.015 0.16
cg17729667 NINL 3.46 × 10⁻³ 0.16
cg04999691 ZBED6CL 3.32 × 10⁻¹¹ 0.16
cg12373771 CECR6 3.70 × 10⁻³ 0.17
cg02489552 CCDC105 8.91 × 10⁻⁸ 0.17
cg25148589 GRIA2 7.77 × 10⁻⁶ 0.19
cg21096399 MCAM 5.47 × 10⁻⁶ 0.19
cg20914508 GAP43 4.24 × 10⁻⁴ 0.20
cg12768605 LYPD5 1.85 × 10⁻⁴ 0.21
cg13216057 DKK3 2.10 × 10⁻⁴ 0.21
cg12351433 LHCGR 4.97 × 10⁻⁷ 0.22
cg08434234 DGKI 5.16 × 10⁻⁵ 0.23
cg10920957 JPH3 3.00 × 10⁻⁴ 0.26
cg27092035 ARL10 3.73 × 10⁻⁵ 0.27
cg06557358 TMEM132E 3.17 × 10⁻⁶ 0.27
cg26620959 SYNE1 1.32 × 10⁻⁶ 0.30
cg07663789 NPR3 8.73 × 10⁻⁶ 0.31
cg09191327 PRDM12 1.79 × 10⁻⁶ 0.31
cg25070637 SDC2 1.64 × 10⁻⁶ 0.34
cg10486998 GALR1 1.81 × 10⁻⁸ 0.35
cg24834740 PPP1R16B 3.56 × 10⁻¹² 0.37
cg27319898 ZNF804B 5.41 × 10⁻⁸ 0.38
cg08090772 ADHFE1 7.18 × 10⁻¹⁴ 0.39
cg02217159 KHDRBS2 6.67 × 10⁻¹³ 0.43 N: Normal; CRC: Colorectal cancer.
In silico gene expression analysis
Genes belonging to 353 age-related CpG sites were mapped to 768 Affymerix transcript IDs. In the CRC vs N comparison, 215 “epigenetic clock” genes were found to be significantly differentially expressed (P <
0.05), of which 117 were altered with absolute logFC >
0.5 (70 upregulated such as ERG, MGP, MCAM, CEMIP and 47 downregulated like SFRP1, KRT20, CLEC3B, SYNE1) (Supplementary Table 2A). Expression of 196 “epigenetic clock” genes changed significantly (P
< 0.05) in adenoma samples compared to healthy normal controls, 102 with absolute logFC higher than 0.5 (47 overexpressed such as CEMIP, PLK1, CCNF and 55 underexpressed like SFRP1, SDC2, SYNE1) (Supplementary Table 2B). Forty-three genes including MCAM, MGP and AKT3 showed increased expression in Table 3 Significant DNA methylation changes of age-related
CpG sites in adenoma samples compared to normal tissue
cgID Gene symbol P value ∆β (AD - N)
cg10345936 SLC36A2 3.49 × 10⁻¹⁰ -0.34
cg00091693 KRT20 2.49 × 10⁻¹² -0.30
cg00075967 STRA6 2.58 × 10⁻⁹ -0.26
cg11314684 AKT3 1.03 × 10⁻⁹ -0.26
cg06462291 NT5DC3 7.45 × 10⁻⁵ -0.25
cg17099569 GLI2 1.25 × 10⁻¹⁰ -0.23
cg00168942 GJD4 2.48 × 10⁻⁷ -0.20
cg20828084 CEMIP 1.33 × 10⁻⁹ -0.19
cg17274064 ERG 1.82 × 10⁻¹⁰ -0.19
cg07408456 PGLYRP2 2.41 × 10⁻¹² -0.19
cg03019000 TEX264 2.25 × 10⁻⁷ -0.19
cg17589341 SLC14A1 1.42 × 10⁻⁹ -0.19
cg02580606 KRT33B 9.08 × 10⁻⁵ -0.17
cg00436603 CYP2E1 1.37 × 10⁻⁸ -0.16
cg19346193 UROS 6.59 × 10⁻⁷ -0.15
cg03103192 SPATA18 1.39 × 10⁻⁷ -0.15
cg25564800 KPNA1 2.18 × 10⁻⁸ -0.14
cg06144905 PIPOX 3.63 × 10⁻⁷ -0.14
cg06952310 NCAN 2.72 × 10⁻⁴ -0.14
cg13038560 C2orf47 2.13 × 10⁻⁵ -0.13
cg22190114 NLRP8 1.67 × 10⁻⁴ -0.13
cg13302154 MGP 7.27 × 10⁻⁶ -0.13
cg01262913 DSCR9 2.67 × 10⁻⁶ -0.13
cg14258236 OR5V1 3.71 × 10⁻⁴ -0.12
cg13828047 MPI 1.01 × 10⁻³ -0.12
cg01459453 SELP 1.65 × 10⁻⁴ -0.12
cg14894144 LAMA3 2.29 × 10⁻⁴ -0.12
cg07337598 ANXA9 2.02 × 10⁻⁵ -0.12
cg03270204 DDR1 7.47 × 10⁻⁵ -0.12
cg12946225 HMG20B 1.37 × 10⁻⁶ -0.11
cg09646392 TNFSF13B 2.66 × 10⁻⁵ -0.10
cg19305227 SLC28A2 0.033 -0.10
cg03578041 LARP6 2.22 × 10⁻⁵ -0.10
cg07455279 NDUFA3 0.013 -0.10
cg13899108 PDE4C 5.00 × 10⁻⁶ 0.10
cg04999691 ZBED6CL 4.92 × 10⁻⁵ 0.10
cg14597908 GNAS 9.38 × 10⁻⁵ 0.10
cg21870884 GPR25 9.49 × 10⁻³ 0.11
cg12616277 ESYT3 0.022 0.12
cg12373771 CECR6 3.55 × 10⁻³ 0.12
cg17729667 NINL 4.43 × 10⁻³ 0.13
cg02364642 ARHGEF25 2.33 × 10⁻³ 0.14
cg22449114 TCF15 2.39 × 10⁻⁵ 0.14
cg03565323 ZNF287 4.52 × 10⁻³ 0.14
cg02388150 SFRP1 1.20 × 10⁻⁷ 0.15
cg12768605 LO×L2 8.01 × 10⁻³ 0.15
cg25657834 NTSR2 1.46 × 10⁻⁴ 0.16
cg20914508 GAP43 9.41 × 10⁻⁴ 0.16
cg10281002 TBX5 1.26 × 10⁻⁵ 0.17
cg02489552 CCDC105 7.16 × 10⁻⁸ 0.18
cg05675373 KCNC4 1.82 × 10⁻⁶ 0.18
cg25148589 GRIA2 6.11 × 10⁻⁷ 0.18
cg13216057 DKK3 9.64 × 10⁻⁴ 0.18
cg27092035 ARL10 8.81 × 10⁻⁴ 0.19
cg12351433 LHCGR 2.20 × 10⁻⁶ 0.20
cg18573383 KCNC2 5.43 × 10⁻⁷ 0.21
cg08434234 DGKI 6.60 × 10⁻⁵ 0.22
cg21096399 MCAM 5.20 × 10⁻⁸ 0.22
cg10920957 JPH3 1.03 × 10⁻⁴ 0.25
cg08965235 LTBP3 6.03 × 10⁻¹⁰ 0.25
cg27319898 ZNF804B 5.48 × 10⁻⁵ 0.26
cg26620959 SYNE1 3.89 × 10⁻⁶ 0.29
cg25070637 SDC2 1.82 × 10⁻⁵ 0.30
cg07663789 NPR3 6.41 × 10⁻⁷ 0.31
cg09191327 PRDM12 4.08 × 10⁻⁷ 0.31
cg06557358 TMEM132E 2.04 × 10⁻⁸ 0.33
cg10486998 GALR1 2.61 × 10⁻⁹ 0.36
cg24834740 PPP1R16B 2.23 × 10⁻⁹ 0.36
cg08090772 ADHFE1 5.19 × 10⁻¹¹ 0.39
cg02217159 KHDRBS2 1.87 × 10⁻¹¹ 0.41 N: Normal; Ad: Adenoma.
Table 4 Significant DNA methylation alterations of age- related CpG sites in colorectal cancer samples compared to adenoma tissue
cgID Gene symbol P value ∆β (CRC - AD)
cg08965235 LTBP3 9.09 × 10⁻⁴ -0.11
cg00945507 SEC61G 1.64 × 10⁻⁵ 0.10
cg15974053 HSD17B14 2.27 × 10⁻³ 0.10
cg24262469 TIPARP 5.33 × 10⁻⁸ 0.10
cg07158339 FXN 1.84 × 10⁻⁷ 0.10
cg11314684 AKT3 4.52 × 10⁻⁴ 0.10
cg03578041 LARP6 2.57 × 10⁻⁹ 0.10
cg17853587 NDST3 5.94 × 10⁻⁴ 0.10
cg07408456 PGLYRP2 1.51 × 10⁻⁷ 0.11
cg02580606 KRT33B 1.22 × 10⁻⁴ 0.11
cg03019000 TEX264 5.39 × 10⁻⁵ 0.11
cg27319898 ZNF804B 0.023 0.12
cg00436603 CYP2E1 1.97 × 10⁻⁶ 0.12
cg15804973 MAP3K5 6.27 × 10⁻¹² 0.12
cg06117855 CLEC3B 1.73 × 10⁻⁷ 0.13
cg24126851 DCHS1 3.58 × 10⁻⁸ 0.13
cg16034652 UNC79 4.23 × 10⁻¹¹ 0.13
cg01262913 DSCR9 1.64 × 10⁻⁸ 0.13
cg26372517 TFAP2E 9.80 × 10⁻⁶ 0.13
cg03270204 DDR1 4.24 × 10⁻⁷ 0.13
cg17589341 SLC14A1 7.35 × 10⁻¹⁰ 0.13
cg22679120 SNX8 8.16 × 10⁻⁹ 0.14
cg20828084 CEMIP 2.00 × 10⁻⁸ 0.14
cg19305227 SLC28A2 1.11 × 10⁻⁶ 0.14
cg00168942 GJD4 1.18 × 10⁻⁷ 0.14
cg13038560 C2orf47 8.96 × 10⁻⁸ 0.15
cg26614073 SCAP 1.33 × 10⁻⁹ 0.15
cg19346193 UROS 2.09 × 10⁻⁸ 0.16
cg00075967 STRA6 4.87 × 10⁻⁷ 0.16
cg03103192 SPATA18 6.07 × 10⁻¹² 0.16
cg10345936 SLC36A2 4.09 × 10⁻⁶ 0.16
cg17099569 GLI2 9.04 × 10⁻⁷ 0.16
cg04126866 C10orf99 4.23 × 10⁻¹⁰ 0.18
cg00091693 KRT20 1.17 × 10⁻⁸ 0.19
N: Normal; Ad: Adenoma; CRC: Colorectal cancer.
CRC compared to adenoma samples, while 17 genes including CEMIP, SPATA18 were downregulated (P <
0.05, absolute logFC > 0.5) (Supplementary Table 2C).
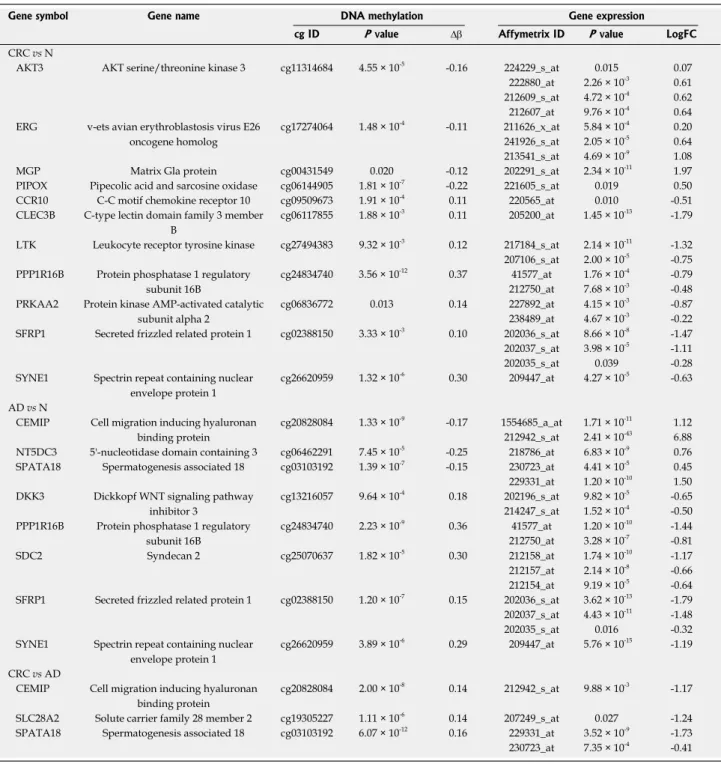
For genes with an inverse relation between gene expression and promoter methylation, the genes with both significant mRNA expression changes with absolute logFC > 0.5 and significant DNA methylation alterations with at least 10% difference were taken into consideration. Based on these criteria, eleven genes, including ERG, MGP, PIPOX, CLEC3B, LTK, SFRP1 and SYNE1 were found to be inversely expressed with the promoter methylation status in CRC compared to normal tissue. Compared to the promoter methylation alterations, the expression of 8 genes, including CEMIP, SPATA18, SDC2, SFRP1 and SYNE1 changed oppositely in AD vs N comparison, while in CRC vs AD tissues 3 genes, namely CEMIP, SPATA18 and SLC28A2 showed this expression pattern. The genes showing an inverse relation between gene expression and DNA methylation in CRC vs normal, AD vs normal and CRC vs AD comparisons are represented in Table 5.
In the comparison of healthy young colonic samples and normal adult tissues, 150 genes showed significantly altered expression from which 94 genes with absolute logFC > 0.5 including overexpressed LTBP3, REEP1, MGP, PLK1, SFRP1, SYNE1 and
downregulated PRKG2, PDCD6IP and TMEM56 (P
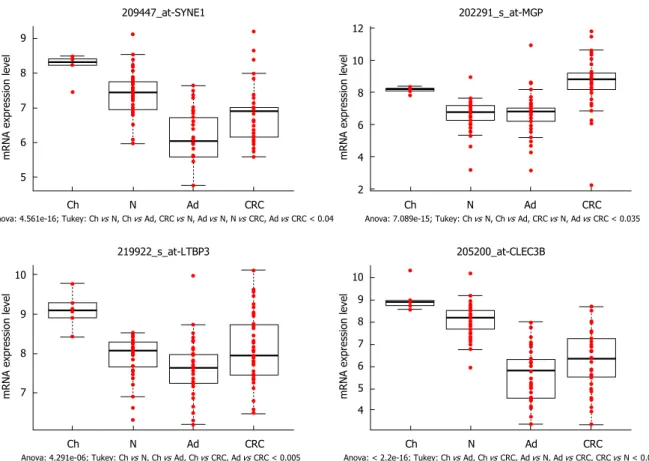
< 0.05) (Supplementary Table 2D). The pattern of expression of several genes including SYNE1, CLEC3B, LTBP3 (Figure 2) and SFRP1 (Figure 3A-C) was similar for increased age as that observed for cancer progression. However, there were some genes such as MGP (Figure 2) which showed similar expression pattern in young people and in cancer patients compared to healthy adult tissue.
Whole promoter methylation status of genes showing inverse relationship between gene expression and DNA methylation
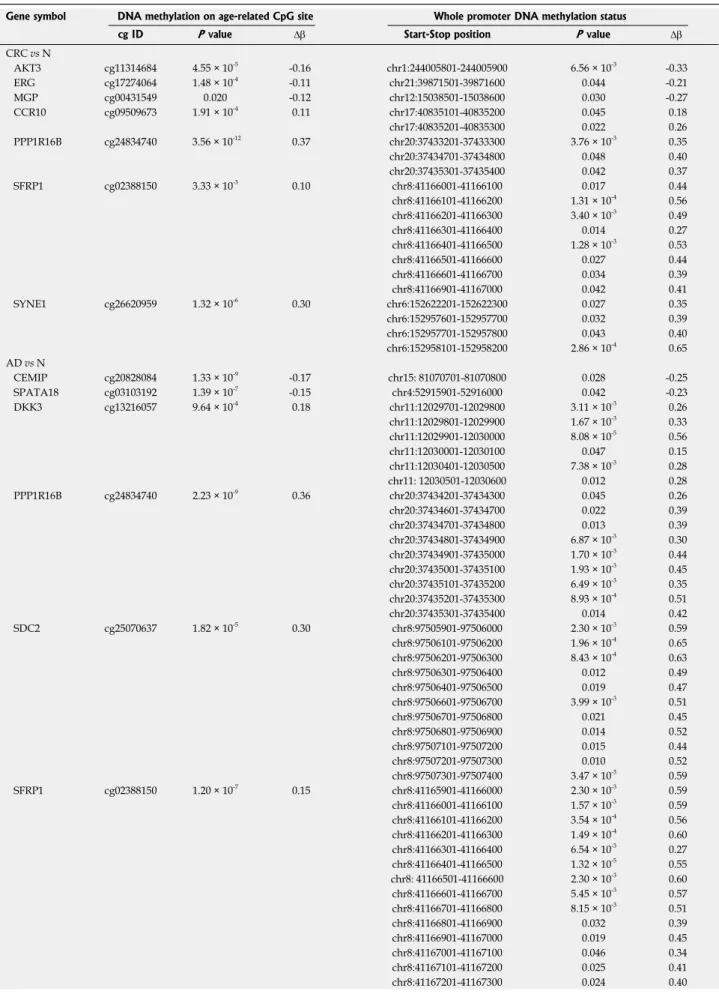
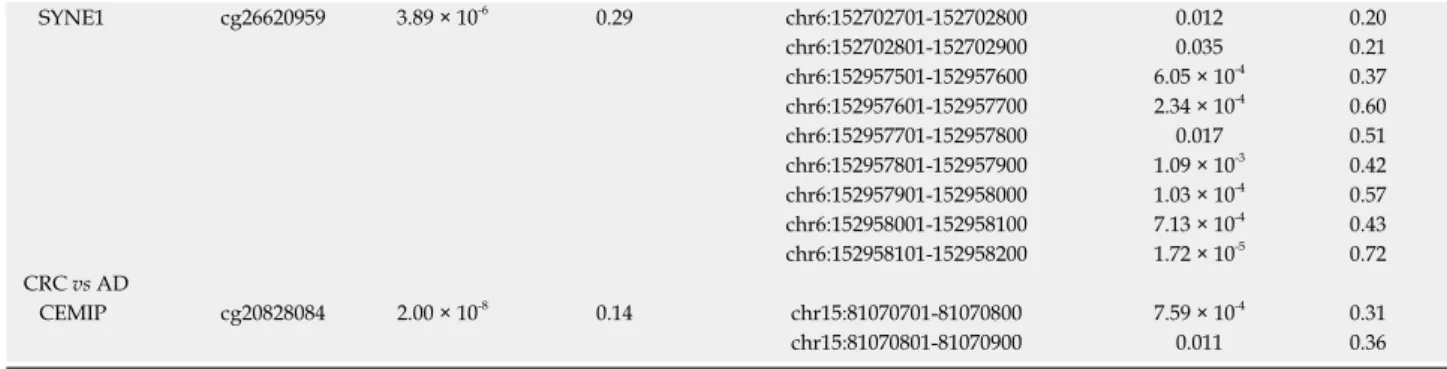
The DNA methylation status of whole promoter regions of genes showing an inverse relation between gene expression and DNA methylation (Table 5) was determined using methyl capture sequencing data of 6 NAT, 15 adenoma and 9 CRC tissue samples[12]. In the CRC vs N/NAT comparison, similar DNA methylation alterations (such as hypomethylated AKT3, MGP promoters and hypermethylated PPP1R16B, SFRP1, SYNE1 promoters) were observed in the promoter regions of 7 of the 11 inversely expressed genes (Table 6). Between adenoma and normal samples, promoter regions of 7 of the 8 inversely expressed genes showed DNA methylation differences (e.g.,
Color key and histogram 500
200 Count 0
Figure 1 DNA methylation heatmap of normal, adenoma and colorectal carcinoma samples according to the methylation status of age-related CpG sites. From the 353 epigenetic clock CpG sites (cg IDs)[2] significantly differentially methylated in CRC vs normal, adenoma vs normal and CRC vs adenoma comparisons were selected and colonic tissue samples (GSE48684[24]) were classified according to their methylation levels. The analyzed samples are illustrated on X axis, significantly altered CpG sites (cg IDs) are represented on Y axis. DNA methylation intensities (β values) are visualized, red shows hypermethylation, while hypomethylation was marked with green color. CRC: Colorectal carcinoma (light green); Ad: Adenoma (dark blue); N: Normal (light blue).
-4 -2 0 2 4 Row Z-score
hypomethylated CEMIP/KIAA1199, SPATA18 pro- moters and hypermethylated DKK3, SDC2, SFRP1, SYNE1 promoters) (Table 6) as detected in case of age-related CpG sites. In CRC samples compared to adenoma tissue, significant hypermethylation of CEMIP/KIAA199 promoter could be demonstrated in “epigenetic clock” CpG sites and whole promoter methylation analyses (Table 6).
SFRP1 promoter methylation analysis in healthy children, healthy adult, adenoma and CRC tissues Based on the gene expression analysis results, SFRP1 was found to be overexpressed in normal adult samples compared to adenoma and CRC biopsy specimens, and in healthy young patients even higher SFRP1 mRNA levels could be detected than in normal adult samples (Figure 3A-C). As SFRP1 is proven to be a methylation- regulated gene with literature data regarding its age- related DNA methylation alterations, hence it was chosen for detailed methylation analysis of normal, premalignant and cancerous colonic specimens including tissue samples from healthy children.
SFRP1 promoter sequences were highly methylated in CRC samples (average methylation% = 55.0% ±
8.4%) and in adenoma tissue (49.9% ± 18.1 %), while low methylation levels could be measured in colonic tissues of both healthy adults (5.2% ± 2.7%) and children (2.2% ± 0.7%). Significant considerable hypermethylation was found in SFRP1 promoter both between CRC and adult normal and between CRC and healthy children colonic tissue samples (P <
0.0001) (Figure 3D). In the healthy adult vs healthy children comparison, significant, but moderate DNA methylation alterations were detected: in adults higher DNA methylation levels were found in the analyzed region of SFRP1 promoter (P = 0.017) (Figure 3E).
SFRP1 protein expression in colonic tissue samples of healthy normal children and adults
In healthy children samples the epithelial layer showed strong (representative scoring values: +3 and +2), diffuse SFRP1 expression both in cytoplasmic and nuclear region (Q-score: 226.67 ± 17.51), whereas the stromal cells showed heterogeneous protein expression (scoring values: form +3 to 0; Q-score:
176.66 ± 18.61; ΣQ-score: 403.33 ± 22.51; Figure 4A). Among stromal cells subepithelial fibroblast and several immune cells showed strong cytoplasmic Figure 2 Genes showing both age- and carcinogenesis-related expression alterations. SYNE1 (spectrin repeat containing nuclear envelope protein 1), LTBP3 (latent transforming growth factor beta binding protein 3) and CLEC3B (C-type lectin domain family 3 member B) genes were downregulated during the colorectal carcinogenesis, similar decreasing expression was found during aging (significantly higher mRNA levels were detected in young colonic samples than in healthy adult biopsy specimens). MGP (matrix Gla protein) was overexpressed in children and in CRC samples compared to adenoma and healthy adults (P < 0.035), hence its opposite expression was found during aging and colorectal carcinogenesis. X axis shows the analyzed sample groups, the normalized mRNA expression can be seen on Y axis. Red dots indicate the normalized mRNA expression values, boxplots represent the medians and standard deviations. Ch: Children; N: Normal; Ad:
Adenoma; CRC: Colorectal cancer.
9
8
7
6
5
mRNA expression level
Ch N Ad CRC
Anova: 4.561e-16; Tukey: Ch vs N, Ch vs Ad, CRC vs N, Ad vs N, N vs CRC, Ad vs CRC < 0.04 209447_at-SYNE1
12
10
8
6
4
2
mRNA expression level
202291_s_at-MGP
10
9
8
mRNA expression level 7
Ch N Ad CRC Anova: 4.291e-06; Tukey: Ch vs N, Ch vs Ad, Ch vs CRC, Ad vs CRC < 0.005
219922_s_at-LTBP3
10 9 8 7 6 5 4
mRNA expression level
Ch N Ad CRC
Anova: < 2.2e-16; Tukey: Ch vs Ad, Ch vs CRC, Ad vs N, Ad vs CRC, CRC vs N < 0.01 205200_at-CLEC3B
Ch N Ad CRC Anova: 7.089e-15; Tukey: Ch vs N, Ch vs Ad, CRC vs N, Ad vs CRC < 0.035
and/or nuclear SFRP1 expression. Not significantly, but remarkably lower (representative scoring value:
+2) SFRP1 protein expression was detectable both in epithelial (Q-score: 202.14 ± 24.12) and stromal component (140.71 ± 41.47; Σ Q-score: 351.42 ± 68.66; Figure 4B) of adult persons (P values: 0.063, 0.073 and 0.105 respectively).
DISCUSSION
Cancer is considered a primary age-related disease[3], and therefore age-related molecular changes including
epigenetic alterations such as epigenetic drift and epigenetic clock[1,2] necessarily show relationship with carcinogenesis-associated differences. Besides global hypomethylation, local, genomic site specific hypermethylation principally in the promoter regions of tumor suppressor genes can occur during both processes[6-8].
In this study, the potential correspondence between age-related and CRC-associated DNA methylation changes was studied using the 353 epigenetic clock CpG sites published by Horvath[2] as a model for age-related DNA methylation changes.
Table 5 Genes showing inverse DNA methylation and gene expression data
Gene symbol Gene name DNA methylation Gene expression
cg ID P value ∆β Affymetrix ID P value LogFC
CRC vs N
AKT3 AKT serine/threonine kinase 3 cg11314684 4.55 × 10⁻⁵ -0.16 224229_s_at 0.015 0.07 222880_at 2.26 × 10⁻³ 0.61 212609_s_at 4.72 × 10⁻⁴ 0.62 212607_at 9.76 × 10⁻⁴ 0.64 ERG v-ets avian erythroblastosis virus E26
oncogene homolog
cg17274064 1.48 × 10⁻⁴ -0.11 211626_x_at 5.84 × 10⁻⁴ 0.20 241926_s_at 2.05 × 10⁻⁵ 0.64 213541_s_at 4.69 × 10⁻⁹ 1.08
MGP Matrix Gla protein cg00431549 0.020 -0.12 202291_s_at 2.34 × 10⁻¹¹ 1.97
PIPOX Pipecolic acid and sarcosine oxidase cg06144905 1.81 × 10⁻⁷ -0.22 221605_s_at 0.019 0.50 CCR10 C-C motif chemokine receptor 10 cg09509673 1.91 × 10⁻⁴ 0.11 220565_at 0.010 -0.51 CLEC3B C-type lectin domain family 3 member
B
cg06117855 1.88 × 10⁻³ 0.11 205200_at 1.45 × 10⁻¹³ -1.79 LTK Leukocyte receptor tyrosine kinase cg27494383 9.32 × 10⁻³ 0.12 217184_s_at 2.14 × 10⁻¹¹ -1.32 207106_s_at 2.00 × 10⁻⁵ -0.75 PPP1R16B Protein phosphatase 1 regulatory
subunit 16B
cg24834740 3.56 × 10⁻¹² 0.37 41577_at 1.76 × 10⁻⁴ -0.79 212750_at 7.68 × 10⁻³ -0.48 PRKAA2 Protein kinase AMP-activated catalytic
subunit alpha 2
cg06836772 0.013 0.14 227892_at 4.15 × 10⁻³ -0.87
238489_at 4.67 × 10⁻³ -0.22 SFRP1 Secreted frizzled related protein 1 cg02388150 3.33 × 10⁻³ 0.10 202036_s_at 8.66 × 10⁻⁸ -1.47 202037_s_at 3.98 × 10⁻⁵ -1.11
202035_s_at 0.039 -0.28
SYNE1 Spectrin repeat containing nuclear envelope protein 1
cg26620959 1.32 × 10⁻⁶ 0.30 209447_at 4.27 × 10⁻⁵ -0.63 AD vs N
CEMIP Cell migration inducing hyaluronan binding protein
cg20828084 1.33 × 10⁻⁹ -0.17 1554685_a_at 1.71 × 10⁻¹¹ 1.12 212942_s_at 2.41 × 10-43 6.88 NT5DC3 5'-nucleotidase domain containing 3 cg06462291 7.45 × 10⁻⁵ -0.25 218786_at 6.83 × 10⁻⁹ 0.76 SPATA18 Spermatogenesis associated 18 cg03103192 1.39 × 10⁻⁷ -0.15 230723_at 4.41 × 10⁻⁵ 0.45 229331_at 1.20 × 10⁻¹⁰ 1.50 DKK3 Dickkopf WNT signaling pathway
inhibitor 3
cg13216057 9.64 × 10⁻⁴ 0.18 202196_s_at 9.82 × 10⁻⁵ -0.65 214247_s_at 1.52 × 10⁻⁴ -0.50 PPP1R16B Protein phosphatase 1 regulatory
subunit 16B
cg24834740 2.23 × 10⁻⁹ 0.36 41577_at 1.20 × 10⁻¹⁰ -1.44 212750_at 3.28 × 10⁻⁷ -0.81
SDC2 Syndecan 2 cg25070637 1.82 × 10⁻⁵ 0.30 212158_at 1.74 × 10⁻¹⁰ -1.17
212157_at 2.14 × 10⁻⁸ -0.66 212154_at 9.19 × 10⁻⁵ -0.64 SFRP1 Secreted frizzled related protein 1 cg02388150 1.20 × 10⁻⁷ 0.15 202036_s_at 3.62 × 10⁻¹³ -1.79 202037_s_at 4.43 × 10⁻¹¹ -1.48
202035_s_at 0.016 -0.32
SYNE1 Spectrin repeat containing nuclear envelope protein 1
cg26620959 3.89 × 10⁻⁶ 0.29 209447_at 5.76 × 10⁻¹⁵ -1.19 CRC vs AD
CEMIP Cell migration inducing hyaluronan binding protein
cg20828084 2.00 × 10⁻⁸ 0.14 212942_s_at 9.88 × 10⁻³ -1.17 SLC28A2 Solute carrier family 28 member 2 cg19305227 1.11 × 10⁻⁶ 0.14 207249_s_at 0.027 -1.24 SPATA18 Spermatogenesis associated 18 cg03103192 6.07 × 10⁻¹² 0.16 229331_at 3.52 × 10⁻⁹ -1.73 230723_at 7.35 × 10⁻⁴ -0.41 N: Normal; Ad: Adenoma; CRC: Colorectal cancer.