RESEARCH PAPER
Aberrant DNA methylation of WNT pathway genes in the development and progression of CIMP-negative colorectal cancer
Orsolya Galamba, Alexandra Kalmarb, Balint Peterfiab, Istvan Csabaic, Andras Bodorc, DezsoRiblic, Tibor Krenacsd,e, Arp ad V. Pataib, Barnabas Wichmanna, Barbara Kinga Bartakb, Kinga Tothb, Gabor Valcza, Sandor Spisakf,
Zsolt Tulassaya,b, and Bela Molnara
aMolecular Medicine Research Group, Hungarian Academy of Sciences, Budapest, Hungary;b2nd Department of Internal Medicine, Semmelweis University, Budapest, Hungary;cDepartment of Physics of Complex Systems, E€otv€os Lorand University, Budapest, Hungary;d1st Department of Pathology and Experimental Cancer Research, Semmelweis University, Budapest, Hungary;eTumor Progression Research Group, Hungarian Academy of Sciences–Semmelweis University, Budapest, Hungary;fDepartment of Medical Oncology, Dana-Farber Cancer Institute, Boston, MA, USA
ARTICLE HISTORY Received 11 March 2016 Revised 26 April 2016 Accepted 11 May 2016 ABSTRACT
The WNT signaling pathway has an essential role in colorectal carcinogenesis and progression, which involves a cascade of genetic and epigenetic changes. We aimed to analyze DNA methylation affecting the WNT pathway genes in colorectal carcinogenesis in promoter and gene body regions using whole methylome analysis in 9 colorectal cancer, 15 adenoma, and 6 normal tumor adjacent tissue (NAT) samples by methyl capture sequencing. Functional methylation was confirmed on 5-aza- 20-deoxycytidine-treated colorectal cancer cell line datasets. In parallel with the DNA methylation analysis, mutations of WNT pathway genes (APC, b-catenin/CTNNB1) were analyzed by 454 sequencing on GS Junior platform. Most differentially methylated CpG sites were localized in gene body regions (95% of WNT pathway genes). In the promoter regions, 33 of the 160 analyzed WNT pathway genes were differentially methylated in colorectal cancer vs. normal, including hypermethylatedAXIN2, CHP1, PRICKLE1, SFRP1, SFRP2, SOX17, and hypomethylatedCACYBP, CTNNB1, MYC; 44 genes in adenoma vs. NAT; and 41 genes in colorectal cancer vs. adenoma comparisons.
Hypermethylation of AXIN2, DKK1, VANGL1, and WNT5A gene promoters was higher, while those of SOX17, PRICKLE1, DAAM2, and MYC was lower in colon carcinoma compared to adenoma. Inverse correlation between expression and methylation was confirmed in 23 genes, including APC, CHP1, PRICKLE1, PSEN1, andSFRP1. Differential methylation affected both canonical and noncanonical WNT pathway genes in colorectal normal-adenoma-carcinoma sequence. Aberrant DNA methylation appears already in adenomas as an early event of colorectal carcinogenesis.
KEYWORDS Adenoma;b-catenin mutation;APC; colorectal cancer; promoter and gene body methylation; gene expression; whole methylome analysis; WNT signaling pathway
Introduction
Colorectal cancer (CRC) is one of the most frequent cancers world-wide with an annual incidence of approximately 1 300 000 newly diagnosed cases, and a very high global mortal- ity of more than 690 000/year.1Although more and more CRC- associated molecular alterations are determined, epidemiologi- cal data emphasize the necessity of further research of this dis- ease. CRC can develop through several distinct molecular pathways (adenoma-carcinoma sequence, serrated neoplastic pathway or on the basis of long-standing inflammatory bowel disease) involving a cascade of genetic, epigenetic events affect- ing gene expression changes.2-4The analysis of these pathways can improve our understanding of colorectal carcinogenesis and can reveal potential diagnostic, prognostic, and therapeutic predictive markers.
Abnormalities of epigenetic regulation such as DNA methyl- ation alterations can contribute to malignant transition.5-6It is well known that global hypomethylation and promoter
hypermethylation of several tumor suppressor genes are characteristic in cancers.7 Furthermore, with the advent of whole methylome analysis, several studies allude to the impor- tant role of methylation alterations in the transcribed regions of genes (gene body region)7 with a remarkable proportion of differentially methylated CpG sites located there5-6 and influ- encing the regulation of gene expression.8-9
The WNT signaling pathway (Table 1, Supplementary Table 1) has an essential role in colorectal carcinogenesis and progression, which is characterized by accumulation of genetic and epigenetic changes. The most known WNT path- way alterations, such as APC and AXIN2 inactivation by mutations or loss of heterozygosity, affect the APC-GSK3- Axin complex leading to b-catenin stabilization, thereby resulting in the constitutive activation of canonical WNT sig- naling in CRC.10Promoter hypermethylation of negative reg- ulators of canonical WNT pathway like secreted frizzled- related proteins (SFRPs),11-18 dickkopf family proteins
CONTACT Orsolya Galamb PhD. orsg1@yahoo.com 2nd Department of Internal Medicine Semmelweis, University Szentkiralyi str 46, 1088, Budapest, Hungary.
Supplemental data for this article can be accessed on thepublisher’s website.
© 2016 Taylor & Francis Group, LLC 2016, VOL. 11, NO. 8, 588–602
http://dx.doi.org/10.1080/15592294.2016.1190894
(DKKs),11,17,19-21
and WIF1 WNT inhibitory factor11,17,21has also been described in malignancies, including CRC. Methyl- ation patterns of CRC and normal adjacent tissue samples were compared in most of the previous global methylation studies focusing on WNT signaling pathway.20,22 Colorectal adenoma samples were involved in methylation analyses for selected WNT pathway genes11,15,17,23,24 focusing mainly on promoter methylation level alterations. Serrated adenoma samples—representing another neoplastic pathway of CRC development—were also profiled in several previous methyl- ation projects.23,25-27
Illumina BeadChip technology is a frequently used method in global methylation studies22,28,29 and allows the determina- tion of the methylation status of>485,000 CpG sites at single- nucleotide resolution. Next generation sequencing of the methylated DNA regions, such as methyl capture sequencing (MethylCap-seq), is another option for genome-wide methyla- tion analysis for revealing novel differentially methylated regions (DMRs).30,31MethylCap-seq provides a more extensive overview of whole-genome methylation than BeadChip methyl- ation arrays; however, it has lower resolution and sensitivity.31
In this study, we aimed to analyze the most frequent genetic and global DNA methylation alterations of WNT pathway genes in parallel during colorectal normal-ade- noma-carcinoma sequence progression. We tested both pro- moter and gene body DNA methylation alterations using MethylCap-seq and studied the potential regulatory role of the identified DMRs on mRNA expression of WNT signaling pathway genes. Approximately 15-20% of CRCs belong to the distinct molecular subtype of cancers called CpG island methylator phenotype (CIMP) with high degree of DNA methylation of certain genes (CIMP-high).7 However, the DNA methylation changes also affect CIMP-negative (CIMP-zero or CIMP-low) CRCs, which represent the majority (approximately 75%) of sporadic CRCs.7,17 In this study, we focused on CIMP-negative CRCs and their precan- cerous lesions in order to find common DNA methylation alterations of WNT pathway genes typical in development and progression of sporadic colorectal cancer.
Results
Determination of microsatellite instability (MSI) and CpG island methylation phenotype (CIMP) status
According to the results of immunohistochemical staining for MMR genes (MLH1, MSH2, MSH6, PMS2), all samples were found to be microsatellite stable (MSS). Using dichotomized CIMP status determination [CIMP-negative (CIMP-zero or CIMP-low) or CIMP-positive (CIMP-high)], all tumor samples were proven to be CIMP-negative, according to both classic7,32 and Weisenberger CIMP status panel.33
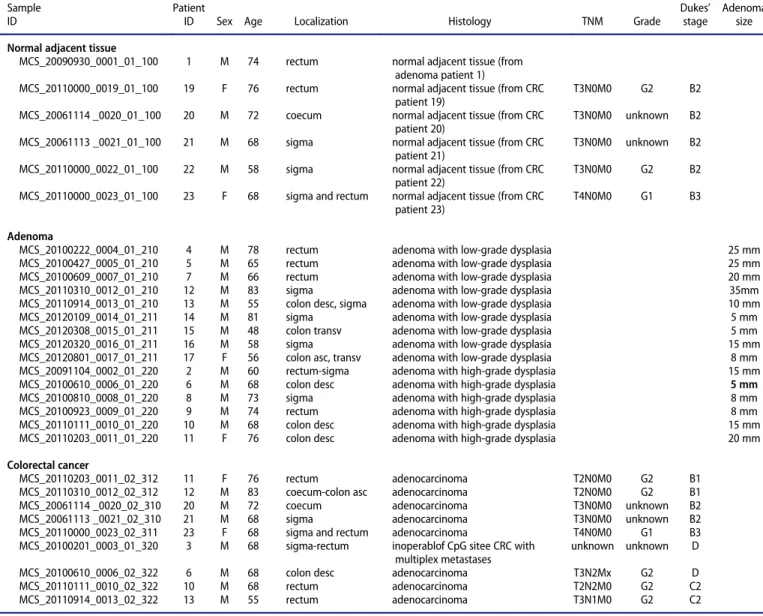
DNA methylator analysis of WNT signaling pathway genes Methylation status of 160 WNT pathway-related genes (Gene symbols shown in Table 1 and detailed gene information shown in Supplementary Table 1) was analyzed at 100 bp reso- lution in 30 colorectal tissue samples [9 colorectal cancer (CRC), 15 adenoma (AD), 6 normal adjacent tissue (NAT)] by MethylCap-seq (Table 2andTable 3).
Methylated CpG containing DNA fragments were effectively isolated using MethylCap protein (Supplementary Figure 1A).
Recovery was 12.51§10.14% in methyl-captured DNA sam- ples, while the unmethylated fraction was slightly detected (0.41§0.16%). Sequencing results of all samples fulfilled the quality criteria, according to the MEDIPS quality control proto- col.34 Pearson correlation coefficient of saturation analysis exceeded the 0.5 threshold for every sample (0.71 § 0.07).
Coverage of at least 5% of the methylation sites (11.43 § 2.56%) was more than 5 times for each sample during the CpG coverage analysis. According to the CpG enrichment test, the efficacy of the methyl capture was proven to be appropriate as all samples showed value well above the 1.4 threshold (enrich- ment score relH: 2.87§0.42) (Supplementary Figure 1B, C, D).
During the determination of DMRs both in promoter and in gene body regions, methylation changes were considered signif- icant ifP-values were under 0.05 and at least a 10% methylation difference could be measured (absolute value ofDbwas>0.1).
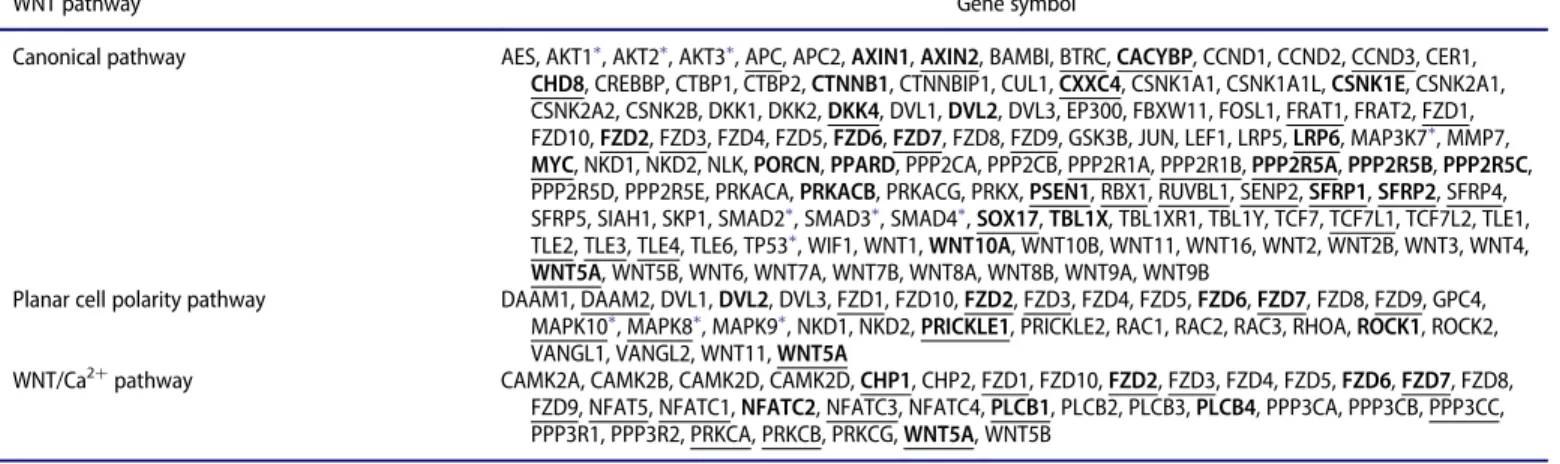
Table 1.Analyzed WNT pathway genes.
WNT pathway Gene symbol
Canonical pathway AES, AKT1, AKT2, AKT3, APC, APC2,AXIN1,AXIN2, BAMBI, BTRC,CACYBP, CCND1, CCND2, CCND3, CER1, CHD8, CREBBP, CTBP1, CTBP2,CTNNB1, CTNNBIP1, CUL1,CXXC4, CSNK1A1, CSNK1A1L,CSNK1E, CSNK2A1, CSNK2A2, CSNK2B, DKK1, DKK2,DKK4, DVL1,DVL2, DVL3, EP300, FBXW11, FOSL1, FRAT1, FRAT2, FZD1, FZD10,FZD2, FZD3, FZD4, FZD5,FZD6,FZD7, FZD8, FZD9, GSK3B, JUN, LEF1, LRP5,LRP6, MAP3K7, MMP7, MYC, NKD1, NKD2, NLK,PORCN,PPARD, PPP2CA, PPP2CB, PPP2R1A, PPP2R1B,PPP2R5A,PPP2R5B,PPP2R5C, PPP2R5D, PPP2R5E, PRKACA,PRKACB, PRKACG, PRKX,PSEN1, RBX1, RUVBL1, SENP2,SFRP1,SFRP2, SFRP4, SFRP5, SIAH1, SKP1, SMAD2, SMAD3, SMAD4,SOX17,TBL1X, TBL1XR1, TBL1Y, TCF7, TCF7L1, TCF7L2, TLE1, TLE2, TLE3, TLE4, TLE6, TP53, WIF1, WNT1,WNT10A, WNT10B, WNT11, WNT16, WNT2, WNT2B, WNT3, WNT4, WNT5A, WNT5B, WNT6, WNT7A, WNT7B, WNT8A, WNT8B, WNT9A, WNT9B
Planar cell polarity pathway DAAM1, DAAM2, DVL1,DVL2, DVL3, FZD1, FZD10,FZD2, FZD3, FZD4, FZD5,FZD6,FZD7, FZD8, FZD9, GPC4, MAPK10, MAPK8, MAPK9, NKD1, NKD2,PRICKLE1, PRICKLE2, RAC1, RAC2, RAC3, RHOA,ROCK1, ROCK2, VANGL1, VANGL2, WNT11,WNT5A
WNT/Ca2Cpathway CAMK2A, CAMK2B, CAMK2D, CAMK2D,CHP1, CHP2, FZD1, FZD10,FZD2, FZD3, FZD4, FZD5,FZD6,FZD7, FZD8, FZD9, NFAT5, NFATC1,NFATC2, NFATC3, NFATC4,PLCB1, PLCB2, PLCB3,PLCB4, PPP3CA, PPP3CB, PPP3CC, PPP3R1, PPP3R2, PRKCA, PRKCB, PRKCG,WNT5A, WNT5B
Official gene symbols of WNT pathway genes according to KEGG WNT signaling map. Detailed data for these genes can be seen in Supplementary Table 1.
WNT signaling pathway genes in other intracellular pathways, such as PI3K-AKT, TGFB, P53, and MAPK signaling. Genes with differentially methylated promoters in CRC vs. NAT comparison are indicated in bold; genes with differentially methylated promoters in adenoma vs. NAT comparison are underlined.
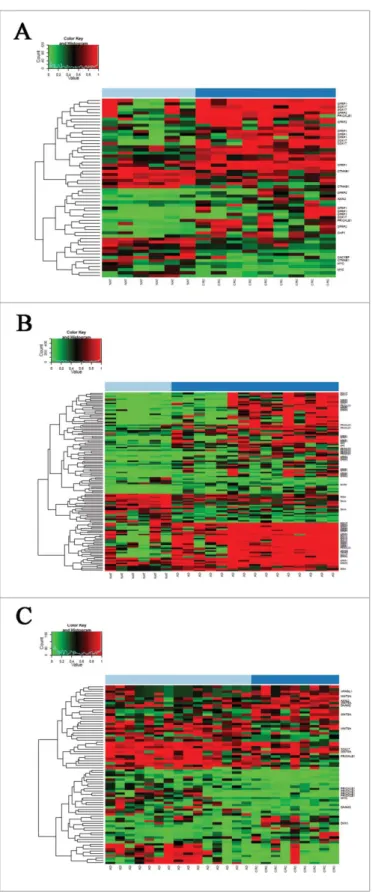
The promoter regions of 33 out of the 160 analyzed WNT pathway genes were differentially methylated in CRC compared to NAT, including hypermethylatedAXIN2, CHP1, PRICKLE1, SFRP1, SFRP2, SOX17, and hypomethylatedCACYBP, CTNNB1, MYC(Fig. 1A,Table 1). In AD vs. NAT comparison, altered pro- moter methylation of 44 WNT signaling genes was detected, including hypermethylated APC, AXIN2, DAAM2, DKK4, PRICKLE1, SOX17, SFRP1, SFRP2andSFRP4, and hypomethy- latedCACYBP, FZD3 (Fig. 1B, Table 1). Forty-one genes were identified showing different promoter methylation levels between CRC and AD samples. Hypermethylation of AXIN2, DKK1, VANGL1, and WNT5Agene promoters was increased in CRC compared to AD, while promoter methylation of SOX17, PRICKLE1, DAAM2, and MYC genes was higher in AD than in CRC (Fig. 1C). The whole gene list, including genomic positions and P- andb-values for DMRs, is shown in Supplemen- tary Table 2A (CRC vs. NAT), 2B (AD vs. NAT), and 2C (CRC vs. AD).
Promoter methylation alterations have been firstly men- tioned, since their effect on gene expression is well described, but most of the detected differentially methylated CpG sites were localized in gene body regions. In CRC samples, 93.75%
(150 out of 160) of the analyzed WNT pathway genes had DMRs in their gene body region (all together, 3788 DMRs). In the adenoma group, a similar proportion (96.88%) of WNT pathway genes showed aberrant gene body methylation, with approximately 1.5-fold higher number of DMRs (total of 5737 DMRs).
In silico DNA methylation analysis of WNT pathway genes CpG sites belonging to the significant DMRs in our Methyl- Cap-sey study were searched using the Illumina BeadChip 450K array data sets from Luo et al.28(GEO accession number:
GSE48684;Table 3) andP- andDb-values were determined in CRC vs. NAT, AD vs. NAT, and CRC vs. AD comparisons.
Approximately one third of significant promoter DMRs detected by MethylCap-seq were represented in the Illumina BeadChip 450K data set by at least one cg ID (one CpG site;
Table 4). Within the represented regions, 58% of the promoter methylation changes could be validated between CRC and NAT samples, 83% between AD and NAT samples, and 30% in CRC vs. AD comparison. In the case of gene body alterations, only approximately 3% of significant DMRs obtained by
Table 2.Clinical data of colorectal tissue samples used in MethylCap-seq study.
Sample ID
Patient
ID Sex Age Localization Histology TNM Grade
Dukes’ stage
Adenoma size Normal adjacent tissue
MCS_20090930_0001_01_100 1 M 74 rectum normal adjacent tissue (from adenoma patient 1)
MCS_20110000_0019_01_100 19 F 76 rectum normal adjacent tissue (from CRC patient 19)
T3N0M0 G2 B2
MCS_20061114 _0020_01_100 20 M 72 coecum normal adjacent tissue (from CRC patient 20)
T3N0M0 unknown B2 MCS_20061113 _0021_01_100 21 M 68 sigma normal adjacent tissue (from CRC
patient 21)
T3N0M0 unknown B2 MCS_20110000_0022_01_100 22 M 58 sigma normal adjacent tissue (from CRC
patient 22)
T3N0M0 G2 B2
MCS_20110000_0023_01_100 23 F 68 sigma and rectum normal adjacent tissue (from CRC patient 23)
T4N0M0 G1 B3
Adenoma
MCS_20100222_0004_01_210 4 M 78 rectum adenoma with low-grade dysplasia 25 mm
MCS_20100427_0005_01_210 5 M 65 rectum adenoma with low-grade dysplasia 25 mm
MCS_20100609_0007_01_210 7 M 66 rectum adenoma with low-grade dysplasia 20 mm
MCS_20110310_0012_01_210 12 M 83 sigma adenoma with low-grade dysplasia 35mm
MCS_20110914_0013_01_210 13 M 55 colon desc, sigma adenoma with low-grade dysplasia 10 mm
MCS_20120109_0014_01_211 14 M 81 sigma adenoma with low-grade dysplasia 5 mm
MCS_20120308_0015_01_211 15 M 48 colon transv adenoma with low-grade dysplasia 5 mm
MCS_20120320_0016_01_211 16 M 58 sigma adenoma with low-grade dysplasia 15 mm
MCS_20120801_0017_01_211 17 F 56 colon asc, transv adenoma with low-grade dysplasia 8 mm
MCS_20091104_0002_01_220 2 M 60 rectum-sigma adenoma with high-grade dysplasia 15 mm
MCS_20100610_0006_01_220 6 M 68 colon desc adenoma with high-grade dysplasia 5 mm
MCS_20100810_0008_01_220 8 M 73 sigma adenoma with high-grade dysplasia 8 mm
MCS_20100923_0009_01_220 9 M 74 rectum adenoma with high-grade dysplasia 8 mm
MCS_20110111_0010_01_220 10 M 68 colon desc adenoma with high-grade dysplasia 15 mm
MCS_20110203_0011_01_220 11 F 76 colon desc adenoma with high-grade dysplasia 20 mm
Colorectal cancer
MCS_20110203_0011_02_312 11 F 76 rectum adenocarcinoma T2N0M0 G2 B1
MCS_20110310_0012_02_312 12 M 83 coecum-colon asc adenocarcinoma T2N0M0 G2 B1
MCS_20061114 _0020_02_310 20 M 72 coecum adenocarcinoma T3N0M0 unknown B2
MCS_20061113 _0021_02_310 21 M 68 sigma adenocarcinoma T3N0M0 unknown B2
MCS_20110000_0023_02_311 23 F 68 sigma and rectum adenocarcinoma T4N0M0 G1 B3
MCS_20100201_0003_01_320 3 M 68 sigma-rectum inoperablof CpG sitee CRC with multiplex metastases
unknown unknown D
MCS_20100610_0006_02_322 6 M 68 colon desc adenocarcinoma T3N2Mx G2 D
MCS_20110111_0010_02_322 10 M 68 rectum adenocarcinoma T2N2M0 G2 C2
MCS_20110914_0013_02_322 13 M 55 rectum adenocarcinoma T3N1M0 G2 C2
Table3.Samplesusedinthestudy. DNAMETHYLATIONANALYSISGENEEXPRESSIONANALYSIS InsilicoanalysisInsilicoanalysis GeneexpressionanalysisDemethylationstudy MethylCap-seq Bisulfite sequencing validation18
Methylation array analysis28 GSE37364GSE8671GSE18105/GSE32323GSE22242GSE9348GSE29060GSE32323GSE14526GSE41588 TISSUENAT/N61524383217412 AD15153229323 CRC915642717770 CELLLINEHT29CCC RKOC SW480CC HCT116CC COLO320C
MethylCap-seq were represented in the BeadChip 450K array, and 25–51% of the methylation alterations could be confirmed between the diagnostic groups (Table 4).
Gene expression analysis of WNT signaling pathway genes Gene expression data of colonic tissue samples from the Gene Expression Omnibus (GEO) database were involved inin silico mRNA expression analysis of 160 WNT pathway genes (GEO accession numbers: GSE37364,35 GSE8671,36 GSE18105,37 GSE32323,38 GSE22242,39GSE9348)40(Table 3). The log Fold Change (logFC) data of significantly differentially expressed WNT pathway genes, together with the methylation data, are shown in Supplementary Table 2 for AD vs. NAT, CRC vs.
NAT, and CRC vs. AD comparisons. Compared to promoter methylation alterations, the expression of 10 WNT signaling genes, includingCACYBP, CTNNB1, MYC, PRICKLE1, PSEN1, and SFRP1, changed oppositely in CRC vs. NAT comparison (Table 5). The expression of 14 WNT pathway genes, including APC, CHP1, DAAM2, PRICKLE1, RUVBL1, SFRP1, SFRP2, SFRP4, and TLE3, were inversely correlated with promoter methylation status in AD vs. NAT samples (Table 6). In CRC vs. AD tissues, the expression of 8 genes, includingCTNNB1, CXXC4, PRICKLE1, VANGL1,andSFRP2,was opposed to pro- moter methylation differences (Table 7). Inverse relation between promoter methylation and gene expression was found in CACYBP, CHP1, CTNNB1, CXXC4, PRICKLE1, SFRP1, SFRP2, and TLE3 genes, at least in 2 of the 3 comparisons (CRC vs. NAT, AD vs. NAT, and CRC vs. AD).
Demethylation analysis on colon cancer cell lines
Gene expression data of 5 5-aza-20-deoxycytidine-treated colon cancer cell lines were evaluated (GEO accession numbers:
GSE29060,41 GSE32323,38 GSE14526,42 and GSE4158843) (Table 3).
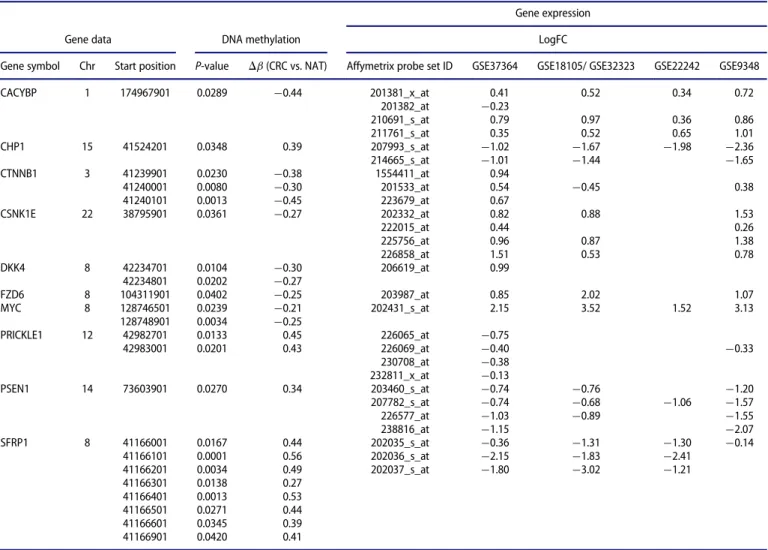
Upregulation of mRNA expression was observed—at least in one of the analyzed colon cancer cell lines after 5-aza-20-deoxycyti- dine demethylation treatment—for 7 genes (APC, CHP1, PRICKLE1, PRKCB, PSEN1, SFRP1,andTLE3) showing promoter hypermethylation and downregulated mRNA expression in benign and/or malignant colonic tissue samples. In SW480 and HCT116 colorectal adenocarcinoma cell lines, 86–100% of the genes showed opposite expression changes caused by the demethylation treat- ment (Fig. 2). GSE29060 and GSE41588 data sets were also evalu- ated, but mRNA expression of the above-mentioned genes was not restored in HT29 cell line by the demethylating treatment.
APC andb-catenin mutation analysis
Mutation analysis ofAPC andb-cateningenes was performed on the same sample set that was used in the whole methylome profiling.APCmutations were detected in 0% of NAT, 27% of adenoma, and 29% of CRC samples, while none of the samples showedb-cateninmutation. Two truncated protein resulting in frameshift mutations (COSM13113 and COSM296347) and 2 nonsense mutations with G/T substitution (COSM18775 and COSM18759) were detected. A SNP with G/A substitution (SNPrs41115) was found in 53% of adenoma samples and in
Figure 1.Differentially methylated regions in WNT pathway gene promoters.
Methylation probabilities (b-values) of 100 bp long analyzed regions were cal- culated with respect to genome wide CpG density dependent Poisson distri- butions, and are represented on a 0–1 scale. Promoter DMRs are shownA. in colorectal cancer (CRC) vs. normal adjacent tissue (NAT) comparisonB. in ade- noma (AD) vs. NAT comparison andC. between CRC vs. AD samples. Methyla- tion intensities are illustrated on a color scale: high methylation levels are marked with red, low methylation levels are represented by green. Gene sym- bols mentioned in the text are listed on the heat maps, the whole gene lists with genomic positions,P- andb-values of DMRs can be seen in Supplemen- tary Table 2.
71% of CRC samples at the targetedAPCsequence region. The list and details of the detected mutations can be seen inTable 8.
Discussion
Similarly to other malignancies, colorectal cancer arises as a conse- quence of accumulating genetic and epigenetic alterations. Beside the conventional mutations, altered DNA methylation has also been revealed as a causative factor in carcinogenesis and tumor progression. Gene silencing mediated by aberrant promoter DNA
methylation is one of the key features of carcinogenesis.8 Gene body regions are also strongly methylated, which can positively correlate with the gene expression.8,9 The importance of DNA methylation is further enhanced by the recently initiated trials using low-dose DNA demethylating agents as anticancer drugs.9
We focused on DNA methylation analysis of WNT signaling genes/gene promoters in CIMP-negative CRCs and precancer- ous adenomas. Although since the establishment of CIMP con- ception the main focus has been on DNA methylation analysis of CIMP-positive proximal colon cancers, notable epigenetic
Table 4.Comparison of BeadChip 450K28data and MethylCap-seq results for WNT pathway genes.
Comparison
Number of DMRs by MethylCap-seq
Number of DMRs represented in BeadChip 450K
Percentage (rate) of DMRs represented on BeadChip 450K
Number of correspondingly changed DMRs (represented on BeadChip 450K )
Percentage (rate) of correspondingly
changed DMRs PROMOTER
CRC vs. NAT 58 19 33% (19/58) 11 58% (11/19)
AD vs. NAT 129 47 36% (47/129) 39 83% (39/47)
CRC vs. AD 77 20 26% (20/77) 6 30% (6/20)
GENE BODY
CRC vs. NAT 3788 115 3.04% (115/3788) 30 26% (30/115)
AD vs. NAT 5737 167 2.91% (167/5737) 85 51% (85/167)
CRC vs. AD 4286 106 2.47% (106/4286) 26 25% (26/106)
Represented DMRs indicate the 100-bp-long differentially methylated regions detected by our MethylCap-seq study which are represented by at least one Illumina Bead- Chip 450K cg ID (CpG site). Correspondingly changed DMRs indicate differentially methylated regions represented on both analyses that were found to be concordant (similarly hyper- or hypo-methylated in the given comparison).
Table 5.WNT pathway genes showing inverse relation between DNA methylation and mRNA expression (CRC vs. NAT).
Gene expression
Gene data DNA methylation LogFC
Gene symbol Chr Start position P-value Db(CRC vs. NAT) Affymetrix probe set ID GSE37364 GSE18105/ GSE32323 GSE22242 GSE9348
CACYBP 1 174967901 0.0289 ¡0.44 201381_x_at 0.41 0.52 0.34 0.72
201382_at ¡0.23
210691_s_at 0.79 0.97 0.36 0.86
211761_s_at 0.35 0.52 0.65 1.01
CHP1 15 41524201 0.0348 0.39 207993_s_at ¡1.02 ¡1.67 ¡1.98 ¡2.36
214665_s_at ¡1.01 ¡1.44 ¡1.65
CTNNB1 3 41239901 0.0230 ¡0.38 1554411_at 0.94
41240001 0.0080 ¡0.30 201533_at 0.54 ¡0.45 0.38
41240101 0.0013 ¡0.45 223679_at 0.67
CSNK1E 22 38795901 0.0361 ¡0.27 202332_at 0.82 0.88 1.53
222015_at 0.44 0.26
225756_at 0.96 0.87 1.38
226858_at 1.51 0.53 0.78
DKK4 8 42234701 0.0104 ¡0.30 206619_at 0.99
42234801 0.0202 ¡0.27
FZD6 8 104311901 0.0402 ¡0.25 203987_at 0.85 2.02 1.07
MYC 8 128746501 0.0239 ¡0.21 202431_s_at 2.15 3.52 1.52 3.13
128748901 0.0034 ¡0.25
PRICKLE1 12 42982701 0.0133 0.45 226065_at ¡0.75
42983001 0.0201 0.43 226069_at ¡0.40 ¡0.33
230708_at ¡0.38
232811_x_at ¡0.13
PSEN1 14 73603901 0.0270 0.34 203460_s_at ¡0.74 ¡0.76 ¡1.20
207782_s_at ¡0.74 ¡0.68 ¡1.06 ¡1.57
226577_at ¡1.03 ¡0.89 ¡1.55
238816_at ¡1.15 ¡2.07
SFRP1 8 41166001 0.0167 0.44 202035_s_at ¡0.36 ¡1.31 ¡1.30 ¡0.14
41166101 0.0001 0.56 202036_s_at ¡2.15 ¡1.83 ¡2.41
41166201 0.0034 0.49 202037_s_at ¡1.80 ¡3.02 ¡1.21
41166301 0.0138 0.27
41166401 0.0013 0.53
41166501 0.0271 0.44
41166601 0.0345 0.39
41166901 0.0420 0.41
Log FC values are indicated only in cases ofP<0.05.
alterations, including promoter DNA hypermethylation, can be detected also in CIMP-negative CRCs representing the majority of sporadic CRCs.4,44A reliable plasma methylation marker test with high specificity and sensitivity—such as Epi proColon 2.0 analyzing SEPT9 promoter methylation45—should be based on systematic DNA methylation alterations identified and detect- able both in CIMP-negative and CIMP-positive CRCs.
In this study, systematic analysis of DNA methylation of WNT signaling pathway genes in relation to CRC development and progression was performed using methyl capture sequenc- ing (MethylCap-seq) and whole genomic expression microar- rays. MethylCap-seq can test both promoter and gene body regions in the entire genome. For comparing previous and our DNA methylation results, thein silicoanalysis of Luo et al.28 data, also including adenomas besides CRC and NAT samples,
was performed. Similarly to the work of Luo et al.,28 we com- pared a group of NAT samples to CRC and adenoma sample groups, instead of doing a pairwise comparison of CRC and NAT samples.
When compared to the methylation array, MethylCap-seq provides a more extensive overview of whole genome methyla- tion, although its resolution and sensitivity is lower than that of BeadChip methylation arrays.31 Concerning WNT signaling genes in our experiments, approximately one third of the sig- nificant DMRs was represented and could be analyzed on Bead- Chip array for gene promoters; only »3% of the identified DMRs for gene body regions was represented. The coexisting compatible regions in both test systems showed high DNA methylation similarity between the diagnostic groups, especially between adenoma and NAT samples (83%). Concordance
Table 6.WNT pathway genes showing inverse relation between DNA methylation and mRNA expression (adenoma vs. NAT).
Gene expression
Gene data DNA methylation LogFC
Gene symbol Chr Start position P-value Db(AD vs. NAT) Affymetrix probe set ID GSE37364 GSE8671 GSE22242
APC 5 112042901 0.0344 0.29 203525_s_at ¡0.83 ¡1.06 ¡1.00
112074301 0.0072 0.39 203526_s_at ¡1.49 ¡1.29 ¡1.72
203527_s_at ¡0.63 ¡0.54
215310_at ¡0.23 ¡0.11
216933_x_at ¡0.12 ¡0.57 ¡0.91
CACYBP 1 174967301 0.0447 ¡0.23 201381_x_at 0.23 0.54
174967501 0.0116 ¡0.25 210691_s_at 0.31 0.74
174967801 0.0009 ¡0.35 211761_s_at 0.49
174967901 0.0003 ¡0.50
174968001 0.0034 ¡0.44
CHP1 15 41524401 0.0155 0.28 207993_s_at ¡0.78 ¡1.65
214665_s_at ¡0.64 ¡0.46
CXXC4 4 105415501 0.0080 ¡0.26 220277_at 0.88 0.62
105415601 0.0265 ¡0.24 229774_at 0.48 0.32
DAAM2 6 39760001 0.0024 0.58 212793_at ¡1.95 ¡1.80 ¡1.28
39760301 0.0281 0.41
FZD1 7 90893001 0.0154 0.34 204451_at ¡1.24 ¡1.20 ¡0.74
204452_s_at ¡0.50 ¡0.29
NFAT5 16 69598901 0.0388 ¡0.24 215092_s_at 2.09
224984_at 0.46
PRICKLE1 12 42982701 0.0005 0.53 226065_at ¡1.22 ¡0.59
42982801 0.0337 0.36 226069_at ¡0.55 ¡0.41 ¡0.99
42983001 0.0046 0.46 230708_at ¡0.56 ¡0.11
42983101 0.0054 0.54
42983201 0.0241 0.37
PRKCB 16 23847601 0.0015 0.59 207957_s_at ¡1.48 ¡1.33 ¡1.24
23847801 0.0292 0.41 209685_s_at ¡1.52 ¡1.55 ¡0.86
227817_at ¡0.71 ¡0.39
230437_s_at 0.01
RUVBL1 3 127843201 0.0334 ¡0.35 201614_s_at 1.35 1.75 0.79
SFRP1 8 41165901 0.0023 0.59 202035_s_at ¡0.29 ¡0.19 ¡1.30
41166001 0.0016 0.59 202036_s_at ¡2.03 ¡1.00 ¡2.35
41166101 0.0004 0.56 202037_s_at ¡1.77 ¡2.23 ¡1.52
41166201 0.0001 0.60 228413_s_at
41166301 0.0065 0.27
SFRP2 4 154709401 0.0122 0.36 223121_s_at ¡5.87
154709501 0.0009 0.59 223122_s_at ¡0.26 ¡5.86
154709601 0.0046 0.55
154709701 0.0001 0.63
154709801 0.0012 0.57
SFRP4 7 37955801 0.0359 0.35 204051_s_at 0.01 ¡3.71
37955901 0.0067 0.49 204052_s_at 0.02 ¡2.65
37956101 0.0219 0.44
TLE3 15 70390701 0.0148 0,29 206472_s_at ¡0.62
212769_at ¡0.56 ¡0.28
212770_at ¡0.59 ¡0.64
228340_at ¡0.71 ¡0,72
C4 (PRICKLE1);C9 (SFRP1);C9 (SFRP2) hypermethylated DMRs see in Supplementary Table 3B. Log FC values are indicated only in cases ofP<0.05.
between CRC and NAT groups was 58%, but only 30% between CRC and AD. This partial discordance was most probably related to the difference between our patient cohorts concern- ing CIMP and MSI or mutation status. Regarding resolution, the Illumina BeadChip 450K array detects the methylation sta- tus of a given CpG site, while MethylCap-seq measures the summation of methylated CpG sites located within the given 100 bp long analysis window.
In our results, promoter methylation changes affected both canonical (WNT/b-catenin) and noncanonical [planar cell polarity (PCP) and WNT/Ca2C] WNT signaling pathways. In CRC samples, significant DMRs were found in 20.63% of the WNT pathway gene promoters, which was even higher in ade- noma samples (27.50%). Aberrant promoter methylation was mainly detected in the canonical WNT (22.3%) and WNT/
Ca2Cpathway genes (22.9%) in CRC, but the PCP pathway was also affected (18.8%). In AD samples, promoter methylation changes were principally observed in WNT/Ca2C pathway genes (40%), while high number of DMRs were also found in canonical and PCP WNT pathways genes (28.1%).
Similarly to our results, promoter hypermethylation of canonical WNT inhibitory genes, such as SFRP1,11,12 SFRP2,11,13-15and SOX17,11,24 was detected both in CRC and adenoma samples. However, in contrast to thefindings of Silva et al.,11 in our study these genes showed elevated promoter methylation in adenoma samples compared to CRC tissue. In accordance with our previous bisulfite sequencing findings,18 SFRP1andSFRP2promoter methylation in CRC and AD tissue
samples was also detected by MethylCap-seq at the same regions (Table 9).
Correspondingly to the previousfindings,11,17, 19-20
we found that another known inhibitor of canonical WNT pathway, DKK2, was significantly hypermethylated in CRC vs. NAT and AD vs. NAT comparisons. However, our promoter estimation considering the sequence in the region between 2000 bp upstream and 1000 bp downstream from the transcription start site (if the positive DNA strand was the coding strand) identi- fied‘active promoter’in at least one of the 9 analyzed cell lines, according to the ENCODE ChromHMM results.46The studied DMRs in DKK2 promoter were excluded because they were labeled as‘poised promoters’by ENCODE, despite their signifi- cance (P-value was between 0.00001 and 0.035 in CRC vs.
NAT; P<0.01 in AD vs. NAT) and highDb-values (0.41–0.72 in CRC vs. NAT and 0.49–0.60 in AD vs. NAT). The lack of significant changes in mRNA expression data between groups also supports the testedDKK2region as an inactive promoter.
Our MethylCap-seq results indicate that promoter DMRs of APC, AXIN1, AXIN2,andCSNK1genes may participate in the impairment/reduction of the APC-Axin-CSNK1-b-catenin complex leading to the constitutive activation of the canonical WNT pathway. APC hypermethylation has been already described in adenoma and CRC tissue and CRC plasma sam- ples.19,47,48 In accordance with findings of Judson et al.,48 hypermethylation in the active promoter of the APC gene in adenoma samples was detected in our study as well (Table 6).
Similar alteration appeared in CRC samples, but in a different
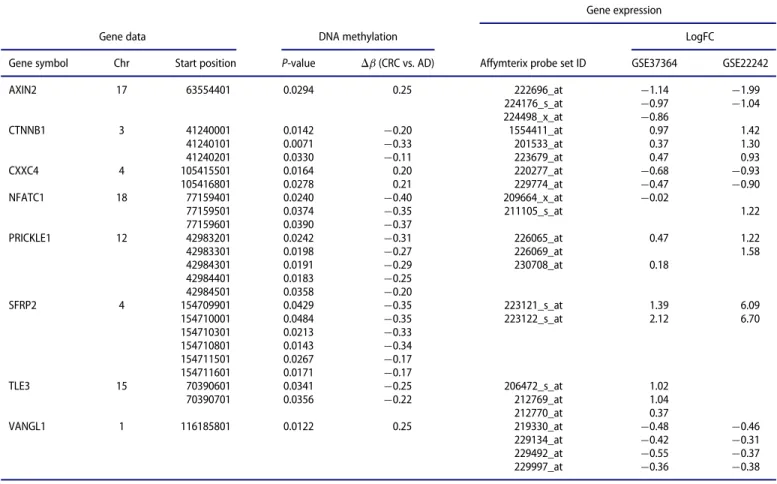
Table 7.WNT pathway genes showing inverse relation between DNA methylation and mRNA expression (CRC vs. adenoma).
Gene expression
Gene data DNA methylation LogFC
Gene symbol Chr Start position P-value Db(CRC vs. AD) Affymterix probe set ID GSE37364 GSE22242
AXIN2 17 63554401 0.0294 0.25 222696_at ¡1.14 ¡1.99
224176_s_at ¡0.97 ¡1.04
224498_x_at ¡0.86
CTNNB1 3 41240001 0.0142 ¡0.20 1554411_at 0.97 1.42
41240101 0.0071 ¡0.33 201533_at 0.37 1.30
41240201 0.0330 ¡0.11 223679_at 0.47 0.93
CXXC4 4 105415501 0.0164 0.20 220277_at ¡0.68 ¡0.93
105416801 0.0278 0.21 229774_at ¡0.47 ¡0.90
NFATC1 18 77159401 0.0240 ¡0.40 209664_x_at ¡0.02
77159501 0.0374 ¡0.35 211105_s_at 1.22
77159601 0.0390 ¡0.37
PRICKLE1 12 42983201 0.0242 ¡0.31 226065_at 0.47 1.22
42983301 0.0198 ¡0.27 226069_at 1.58
42984301 0.0191 ¡0.29 230708_at 0.18
42984401 0.0183 ¡0.25
42984501 0.0358 ¡0.20
SFRP2 4 154709901 0.0429 ¡0.35 223121_s_at 1.39 6.09
154710001 0.0484 ¡0.35 223122_s_at 2.12 6.70
154710301 0.0213 ¡0.33
154710801 0.0143 ¡0.34
154711501 0.0267 ¡0.17
154711601 0.0171 ¡0.17
TLE3 15 70390601 0.0341 ¡0.25 206472_s_at 1.02
70390701 0.0356 ¡0.22 212769_at 1.04
212770_at 0.37
VANGL1 1 116185801 0.0122 0.25 219330_at ¡0.48 ¡0.46
229134_at ¡0.42 ¡0.31
229492_at ¡0.55 ¡0.37
229997_at ¡0.36 ¡0.38
Log FC values are indicated only in cases ofP<0.05.
region upstream to theAPC gene, which was considered as a
‘weak promoter’or‘enhancer’. Reduced APC mRNA levels on microarrays indicate silencing by promoter hypermethylation, which impairs APC tumor suppressor function during colorec- tal carcinogenesis, besides the frequentAPC mutations. DNA methylation differences in APC promoter and mutation hot
spot regions could not been detected between samples with or without APC mutations. This supports that APC mutations andAPCpromoter hypermethylation are not exclusive factors, but rather 2 parallel mechanisms leading to the loss of APC function. We foundAPCmutations in approximately one third of the CRC samples, which is below the mutation rate described
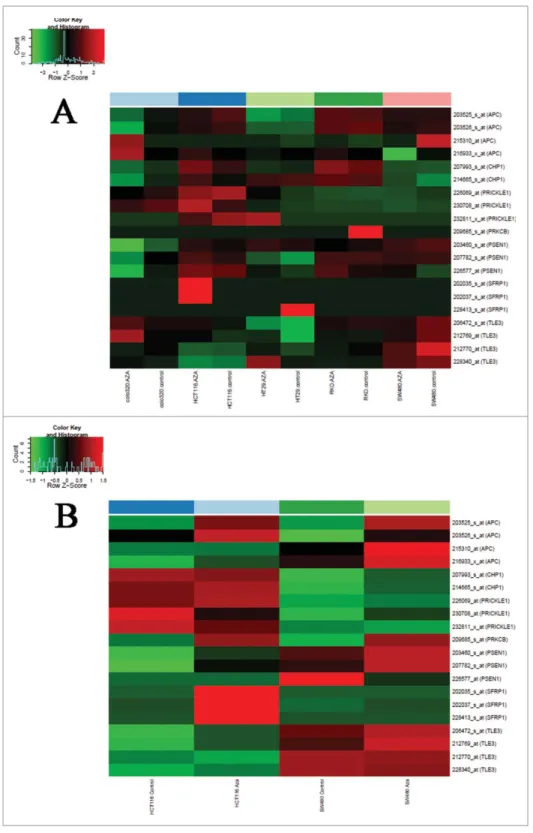
Figure 2.Effect of 5-aza-20-deoxycytidine demethylation treatment on colon cancer cell lines. Gene expression data of colon cancer cell lines under 5-aza-20-deoxycyti- dine demethylation treatment analyzed on Affymetrix HGU133 Plus 2.0 microarrays are shown (GEO accession numbers of gene expression data sets: GSE32323,38 GSE1452642). Demethylation agent treatment reversed (upregulated) mRNA expression of 7 WNT pathway genes showing promoter hypermethylation and downregu- lated mRNA expression in benign and/or malignant colonic tissue samples, principally in SW480 and HCT116 colorectal adenocarcinoma cell lines in varying degrees. A.
GSE32323 data set B. GSE14526 data set. Samples are shown in columns, selected transcripts are represented in rows. High mRNA expression intensities are marked in red, low expression levels are shown in green. AZAD5-aza-20-deoxycytidine.
by others (75–80%22). However, we only analyzed a limited region [BLAST: chr5:112,175,118–112,176,026 (Feb. 2009 GRCh37/hg19 Assembly)] with the most prevalentAPCmuta- tions. Still, our results were similar to those of Luo et al.28find- ingAPC mutations in 29.7% of CRC and 27.8% of adenoma tissue samples using larger sample size and testing longer APC regions.
Increased promoter methylation of the AXIN2 gene is thought to be associated with carcinogenesis of MSICCRC.49 We also detected AXIN2 promoter hypermethylation with
MethylCap-seq both in CRC and adenoma tissues compared to NAT samples, but the prevalence of DMRs was higher in gene body regions (25 hypermethylated DMRs, 13 hypomethylated DMRs).In silicoanalysis also revealed a remarkable upregula- tion of AXIN2 mRNA in both disease groups, suggesting the tumor promoting function of AXIN2,49especially in MSS CRC cases.
We also found b-catenin hypomethylation in CRC com- pared to NAT tissues, which was also detected earlier by others using Illumina methylation array and in methylation-sensitive
Table 8.Detected mutations in analyzed colonic tissue samples.
Gene symbol Variant cDNA position Amino acid alteration Affected cDNA sequence Annotation Affected samples
APC_1 96:C/T 3871 Q1291stop ATGTAATCAGACG COSM19072 —
APC_1 140:A/- 3915 Frameshift from aa 1306
Truncated protein (length 1366 aa instead of 2843 aa)
ATAGCAGAAATA — —
APC_1 141:G/T 3916 E1306stop ATAGCAGAAATA COSM18760 —
APC_2 31:G/T 3925 E1309stop ATAAAAGAAAAGA COSM18775 MCS_20100810_0008_01_220 (AD)
APC_2 33–37:AAAGA/—– 3927 Frameshift from aa 1309 Truncated protein (length 1311 aa instead of 2843 aa)
ATAAAAGAAAAGATTGG COSM13113 MCS_20100923_0009_01_220 (AD) MCS_20110203_0011_02_312 (CRC) MCS_20110000_0023_02_311 (CRC)
APC_2 70:G/T 3964 E1322stop TGTGAGCGAAGTTCC COSM18702 —
APC_2 139:G/T 4033 E1345stop ATCTTCAGAATCA COSM18759 MCS_20100427_0005_01_210 (AD)
APC_3 125:G/T 4135 E1379stop GTTCAGGAGACCCC COSM18834 —
APC_4 111.5:-/T 4241 Frameshift from aa 1415 Truncated protein (length 1421 aa instead of 2843 aa)
GAATGGTAAGTGGCA COSM19703 —
APC_5 67:A/- 4314 Frameshift from aa 1439
Truncated protein (length 1421 aa instead of 2843 aa)
TAAAACACCTCCAC COSM296347 MCS_20110111_0010_01_220 (AD)
APC_5 101:C/T 4348 R1450stop ACCAAGCGAGAAGTA COSM13127 —
APC_6 105:G/A 4479 Silent T1493T GCCACGGAAAGTA SNP rs41115 MCS_20091104_0002_01_220 (AD)
MCS_20100222_0004_01_210 (AD) MCS_20100610_0006_01_220 (AD) MCS_20100810_0008_01_220 (AD) MCS_20100923_0009_01_220 (AD) MCS_20110310_0012_01_210 (AD) MCS_20120109_0014_01_211 (AD) MCS_20120320_0016_01_211 (AD) MCS_20110203_0011_02_312 (CRC) MCS_20100610_0006_02_322 (CRC) MCS_20110111_0010_02_322 (CRC) MCS_20110310_0012_02_312 (CRC) MCS_20110000_0023_02_311 (CRC)
CTNNB1_1 123:C/T 47 P16L TGGAACCAGACAGA — —
CTNNB1_2 87:C/T S45F TCCTTCTCTGAGT COSM5667 —
aa: aminoacid
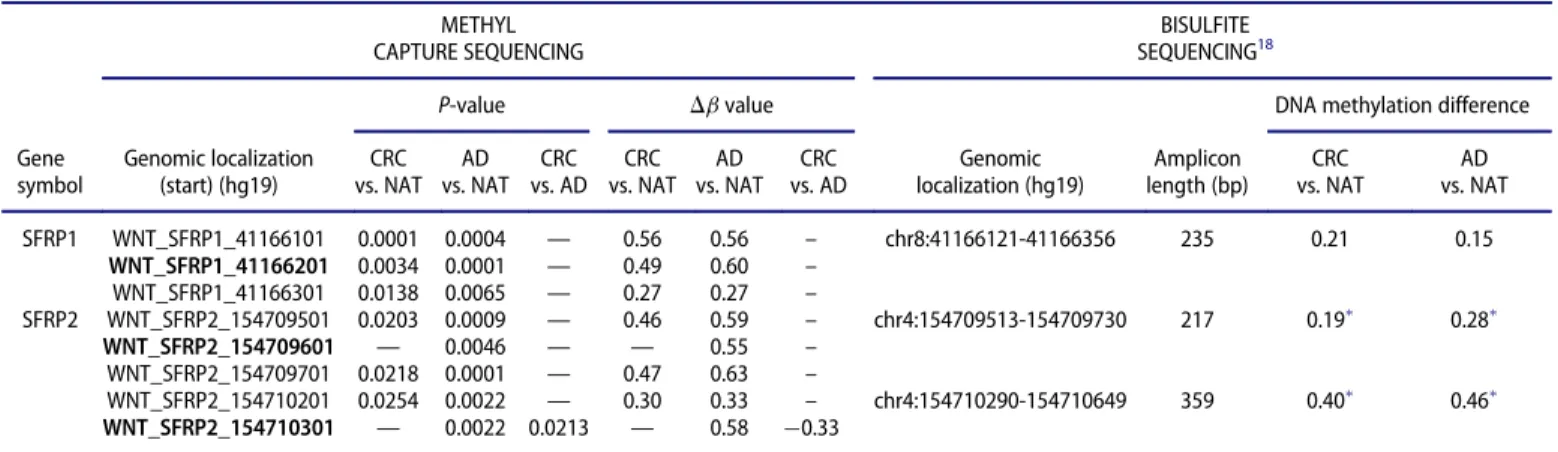
Table 9.Methyl capture and bisulfite sequencing18data for SFRP1 and SFRP2 promoter regions (overlapping regions).
METHYL CAPTURE SEQUENCING
BISULFITE SEQUENCING18
P-value Dbvalue DNA methylation difference
Gene symbol
Genomic localization (start) (hg19)
CRC vs. NAT
AD vs. NAT
CRC vs. AD
CRC vs. NAT
AD vs. NAT
CRC vs. AD
Genomic localization (hg19)
Amplicon length (bp)
CRC vs. NAT
AD vs. NAT
SFRP1 WNT_SFRP1_41166101 0.0001 0.0004 — 0.56 0.56 – chr8:41166121-41166356 235 0.21 0.15
WNT_SFRP1_41166201 0.0034 0.0001 — 0.49 0.60 – WNT_SFRP1_41166301 0.0138 0.0065 — 0.27 0.27 –
SFRP2 WNT_SFRP2_154709501 0.0203 0.0009 — 0.46 0.59 – chr4:154709513-154709730 217 0.19 0.28 WNT_SFRP2_154709601 — 0.0046 — — 0.55 –
WNT_SFRP2_154709701 0.0218 0.0001 — 0.47 0.63 –
WNT_SFRP2_154710201 0.0254 0.0022 — 0.30 0.33 – chr4:154710290-154710649 359 0.40 0.46 WNT_SFRP2_154710301 — 0.0022 0.0213 — 0.58 ¡0.33
MethylCap-seq analysis ofSFRP1andSFRP2promoters revealed that all 100 bp-long sequences overlapping with the regions analyzed by bisulfite sequencing showed elevated DNA methylation level in CRC and adenoma samples compared to NAT samples (P<0.05). In case of MethylCap-seq, only the significant (P<0.05) methyla- tion changes are represented. The 100-bp analysis windows completely overlapping with bisulfite-sequenced regions are marked in bold.
Significant methylation differences in bisulfite sequencing analysis18
high resolution melting analysis.20 The significantly hypome- thylated CpG site (41240163, Illumina ID: cg09678212) in the previous analysis20is located within WNT_CTNNB1_41240101 100 bp long analysis window in our study.In silico evaluation of Luo et al.28 Illumina methylation array data also resulted in significant (P<0.001) hypomethylation of this CpG site in CRC compared to NAT (Db= -0.20) and adenoma samples (Db= -0.12). Besides identifying the only b-catenin promoter hypomethylated CpG site found by the Illumina platform, our MethylCap-seq analysis revealed significant hypomethyla- tion in the 300 bp region (WNT_CTNNB1_41239901;
WNT_CTNNB1_41240001 and WNT_CTNNB1_41240101) of the CTNNB1 gene promoter. Hypomethylation of this region in CRC compared to NAT and adenoma samples suggests its contribution to aberrantly elevated intracellularb-catenin level in colorectal carcinogenesis. Supporting this, significant eleva- tion of CTNNB1 mRNA levels were observed in CRC com- pared to normal samples with logFC: 0.38–0.94, along with increased nuclear translocation ofb-catenin protein as a sign of the activation of the canonical WNT pathway during malignant transformation. Oncogenic function of canonical WNT path- way activation is known to occur at early stages of carcinogene- sis, and can be promoted by DNA methylation alterations from the precancerous adenoma stage.
The PCP pathway, as a noncanonical WNT signaling, can play multiple roles in oncogenesis.50 At an early stage, PCP pathway has a tumor suppressive effect as it can antagonize the canonical pathway.50 However, during tumor progression, it can be tumorigenic by promoting tumor cell motility and inva- sion, angiogenesis induction, and metastatic spreading.50DNA methylation changes both in promoters and transcribed regions of PCP pathway genes were detected at the adenoma stage.
DMRs were observed inFZD2, FZD7, PRICKLE1, andWNT5A gene promoters, both in adenoma and CRC samples, while pro- moter hypermethylation on DAAM2 and downregulation of its mRNA level were typical only in adenoma tissue compared to NAT samples. Increased FZD2 and WNT5A levels were mea- sured in cancer cell lines, including CRC and advanced tumors, and were shown to promote epithelial-mesenchymal transition and metastasis.50,51FZD7 can enhance migration and invasion of CRC mediated by noncanonical WNT signaling.50 PRICKLE1, a disheveled (Dvl) associated protein, may have a tumor suppressor function by antagonizing Dvl recruitment by Frizzled.52It can bind to Dvl3 and facilitate its ubiquitination- mediated degradation, suggesting that PRICKLE1 is a negative regulator of WNT/b-catenin pathway.52,53Promoter hyperme- thylation ofPRICKLE1, found in adenoma and CRC samples in our methylation study, also support this idea.DAAM2 and PRICKLE1 seems to be DNA methylation regulated genes as inverse correlation was found between their promoter hyper- methylation and reduced mRNA expression.
The noncanonical WNT/Ca2Cpathway, which can antago- nize b-catenin-dependent signaling and stimulate cell migra- tion,53 was the most affected by promoter methylation changes in adenomas. This involved the WNT5A (ligand), FZD1, 2 and 7 (receptors), and downstream elements, such as PLCB1, PRKCB, and NFAT5 genes in AD samples, whereas promoter hypermethylation of FZD2, FZD7, PLCB1, and PRKCB genes was in silico-validated in adenoma samples.28
Hypermethylation ofFZD2, FZD7, PLCB1, andWNT5A gene promoters was also detected in CRC, compared to NAT sam- ples. However, in many cases it was not accompanied by down- regulation of mRNA expression. WNT5A has a dual function:
it can act as tumor suppressor or as oncogene in a context- dependent manner. Depending on the type and level of co- receptors, it can activate noncanonical orb-catenin-dependent WNT signaling. Although its promoter was found to be hyper- methylated both in adenoma and CRC tissues, with only mod- erate difference in the gene body region, it was probably not a DNA methylation-regulated gene. The remarkable increase on its mRNA expression (AD vs. NAT: logFC: 0.65–1.02; CRC vs.
NAT logFC: 1.21–2.58) may be regulated by other mechanisms.
FZD2 and FZD7 genes, which were upregulated in CRC (FZD7 is already in adenomas) may promote migration and metastatic spreading.51 The connection between methylation and mRNA expression of these genes was controversial, since both increased mRNA expression and promoter hypermethylation were measured in CRC, which was further elevated in adenoma tissue samples.
An inverse relation was observed between gene expression and promoter DNA methylation in WNT-related 23 genes.
Among others, APC, CHP1, PRICKLE1, PRKCB, PSEN1, and SFRP1 genes were identified as methylation-regulated WNT pathway genes during colorectal normal-adenoma-carcinoma sequence progression in view of 5-aza-20-deoxycytidine (5-aza) demethylation treatment data of colon cancer cell lines, specifi- cally of HCT116 and SW480. SW480 is a MSS, CIMP-negative colorectal adenocarcinoma cell line54most similar to the clini- cal samples analyzed in our MethylCap-seq study. Demethyla- tion treatment was capable of inducing re-expression of these genes in CRC cell lines, suggesting a casual relationship between promoter hypermethylation and expression silencing of these genes. Restoration of APC, PRKCB, and SFRP1 expres- sion by 5-aza treatment was also observed earlier in different colon cancer cell lines.55-57
Despite having detected most of the DMRs in gene body regions, we discuss these only shortly here because their contri- bution is not well known or controversial. Approximately 95%
of the analyzed WNT pathway genes showed aberrant gene body methylation in adenoma and CRC compared to the NAT samples with»1.5-fold higher number of DMRs in adenomas.
Gene body methylation may positively regulate gene expres- sion8,9and can be involved in splicing regulation.8,58However, it can also contribute to gene silencing, according to the whole genomic bisulfite and RNA sequencing data of Lou et al.59 In the recent study of Wang et al. about the roles of genic methyla- tion in prostate tumorigenesis, 12 groups of genes with collabo- rative differential methylation patterns, including hyper- methylated promoter/hypermethylated gene body and hyper- methylated promoter/hypomethylated gene body, were identi- fied, assuming a gene activating role for gene body methylation.60In line with thesefindings, we identified strongly hypermethylated gene body associated with upregulated mRNA expression in WNT pathway genes, such as AXIN2, CSNK1E, MYC, NKD1, which expression was downregulated after 5-aza-20-deoxycytidine treatment in colon cancer cell lines. Also, in other genes, reduced expression was associated with intense gene body hypermethylation reversed by 5-aza