Colon cancer subtypes:
concordance, effect on survival and selection of the most
representative preclinical models
Zsófia Sztupinszki
1,2 & Balázs Győrffy1,2Multiple gene-expression-based subtypes have been proposed for the molecular subdivision of colon cancer in the last decade. We aimed to cross-validate these classifiers to explore their concordance and their power to predict survival. A gene-chip-based database comprising 2,166 samples from 12 independent datasets was set up. A total of 22 different molecular subtypes were re-trained including the CCHS, CIN25, CMS, ColoGuideEx, ColoGuidePro, CRCassigner, MDA114, Meta163, ODXcolon, Oncodefender, TCA19, and V7RHS classifiers as well as subtypes established by Budinska, Chang, DeSousa, Marisa, Merlos, Popovici, Schetter, Yuen, and Watanabe (first authors). Correlation with survival was assessed by Cox proportional hazards regression for each classifier using relapse-free survival data. The highest efficacy at predicting survival in stage 2–3 patients was achieved by Yuen (p = 3.9e-05, HR = 2.9), Marisa (p = 2.6e-05, HR = 2.6) and Chang (p = 9e-09, HR = 2.35). Finally, 61 colon cancer cell lines from four independent studies were assigned to the closest molecular subtype.
Colorectal cancer (CRC) is the fourth leading cause of cancer-related death. Chemotherapy and targeted ther- apy double the survival for patients with advanced disease up to 30 months1. The current set of agents includes the cytotoxic agents 5-fluorouracil, capecitabine, irinotecan, and oxaliplatin; the angiogenesis inhibitors bevaci- zumab and aflibercept; the anti-EGFR antibodies cetuximab and panitumumab; and the multi-kinase inhibitor regorafenib. In addition, a multitude of additional agents are in development so that soon it will be possible to target almost any genetic alteration.
However, colorectal cancer is not a single disease but rather a set of molecularly distinctive diseases having the same clinical presentation2. Thus, to achieve our goal of personalized therapy, first we have to stratify patients into clinically relevant molecular subtypes. In principle, classification using single genes or gene signatures is possible. The most commonly mutated pathways in colorectal cancer include APC (80% of patients)3, the mutu- ally exclusive RAS (hit in 43% of patients)4 and BRAF (15%)5 pathways and the Wnt pathway (93%)6. Of these, two isoforms of RAS, KRAS and NRAS, as well as BRAF are clinically used to select patients not eligible for anti-EGFR therapy. Markers that have been clinically introduced in colon cancer include RAS mutations that exclude anti-EGFR therapy and microsatellite instability (MSI) as a marker of good prognosis in stage II colon cancer.
On the other hand, a plethora of multigene signatures utilizing gene expression profiles obtained from tumour samples have been published in the last decade. These classify patients into molecular subtypes ranging from two up to six. Most of these classifiers focus on risk prediction – similarly to other oncologic disorders such as breast cancer (reviewed in ref. 7). In principle, this approach is therapeutically useful assuming that patients having a high risk of relapse will also benefit the most from chemotherapy.
However, there are multiple unsolved issues with the proposed subtypes. Although the performance of many of these classification schemes has been assessed using an independent set of patients, to date no study has compared them using the same set of patients. Secondly, the ability to select a clinically relevant subtype using patient-derived material does not ensure the immediate translation of these results into patient therapy. To this
1MTA TTK Lendület Cancer Biomarker Research Group, 1117, Budapest, Hungary. 22nd Dept. of Pediatrics, Semmelweis University, 1094, Budapest, Hungary. Correspondence and requests for materials should be addressed to B.G. (email: gyorffy.balazs@ttk.mta.hu)
received: 14 July 2016 accepted: 25 October 2016 Published: 16 November 2016
OPEN
end, agents specific for the given subdivision have to be developed and tested in an appropriate model system.
However, essentially none of the studies to date have provided guide for this initial step of any preclinical trial.
In this study, our goal was to evaluate published molecular subtypes using the same large set of patients. In addition to comparing the molecular subtypes to each other, we also ranked them according to their capability regarding prediction of survival. Moreover, we obtained gene expression signatures of colorectal cancer cell lines and evaluated each cell line to identify the most representative preclinical model for each subtype within each classifier.
Results
Validation datasets and clinical characteristics.
A summary of the database construction starting from a GEO search is presented in Fig. 1A. The complete database is based on following GEO datasets: GSE17538, GSE12945, GSE31595, GSE14333, GSE37892, GSE33114, GSE41258, GSE39582, GSE30540, GSE18088, Figure 1. Summary of pooled database setup and classifier selection. A flowchart depicting datasetidentification starting with the combination of “colon cancer” and the three different platforms in GEO (A). Composition of the entire database – the 12 datasets included and basic clinical characteristics – sample numbers are given for TNM because these data were available for only a fraction of the patients (B). Correlation between survival, TNM and stage in the entire database (C). Identification of classifiers through a PubMed search (D).
GSE26682, and GSE13294. The largest dataset (GSE39582) with 566 samples accounted for 26% of the entire database. For all patients, 57.4% were male and 74.2% were either stage II or III. The median relapse-free survival was 43.12 months and the median age 69 years. Aggregate clinical parameters for the entire database utilized in the validation analysis are depicted in Fig. 1B, and the clinical properties for each of the datasets including gender, grade, MSI, stage, age and location are listed in Supplementary Table 1.
Classification algorithms and most-central genes.
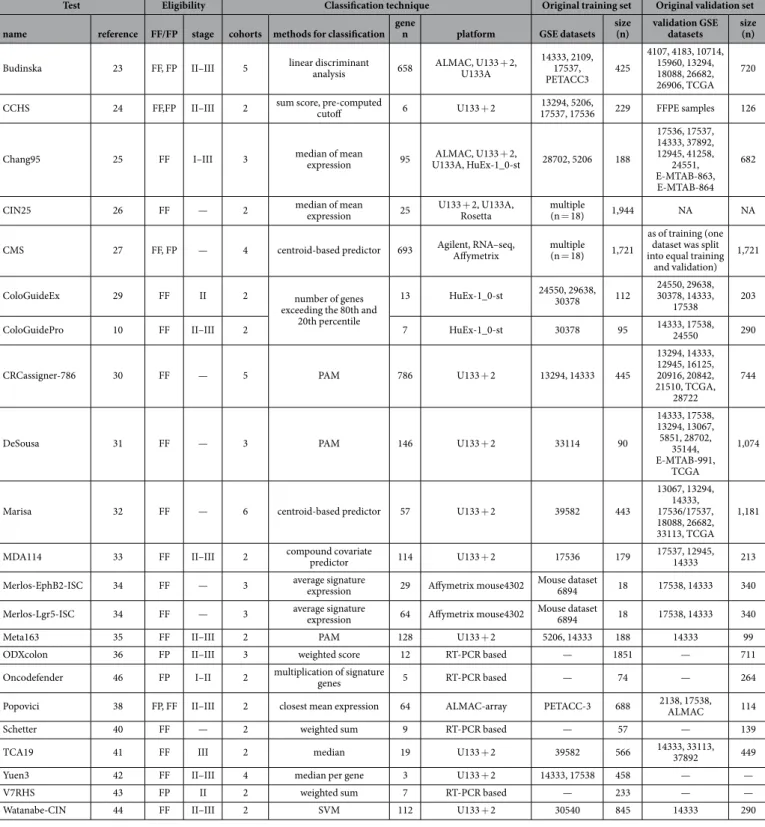
After screening the abstracts of 282 publications and reading the full text of 247 papers, we narrowed down the list of classifiers to n = 41. Either by employing the published supplementary material or by utilizing the original training datasets we were able to re-programme 22 of these. A flowchart of candidate classifier identification is portrayed in Fig. 1D. A complete list of all 22 classi- fiers implemented including patient eligibility, details of the classification algorithm and the parameters of the training and validation sets utilized in the original publication are shown in Table 1.To compare the composition of the classifiers and to assess the power of individual genes, we extracted the list of genes included in each of the classifiers (see Supplementary Table 2). Then, the genes were ranked after computing a gene score for each of the markers. The three highest scoring genes each included in four different classifiers were CTGF, GADD45B and FAP. When evaluating the correlation between these genes and survival in univariate analysis in the entire database using the median expression as a cutoff, each of them delivered high significance [CTGF: p = 2.7E-07, HR = 1.8 (1.4–2.3); GADD45B: p = 6.7E-05, HR = 1.6 (1.3–2.0) and FAP:
p = 4.6E-06, HR = 1.7 (1.3–2.1)].
Concordance in classification output.
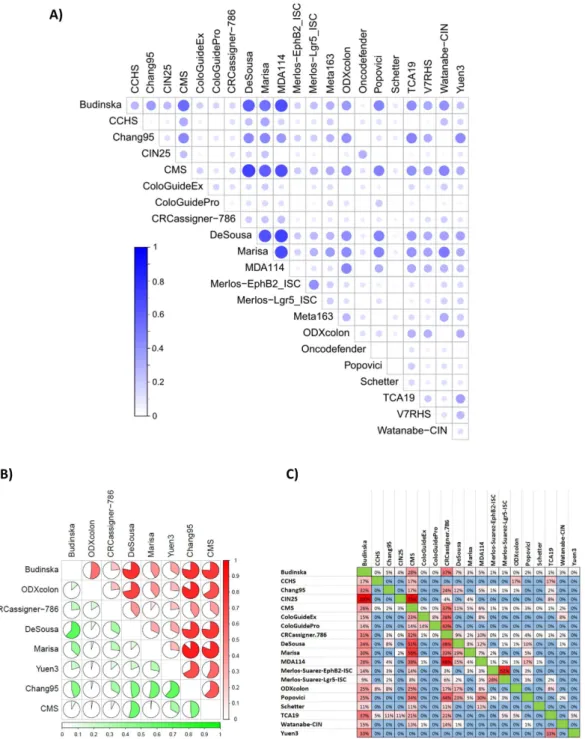
In the next step, we assigned each of the patients to one of the subtypes in each classifier. Supplementary Table 3 contains the designation for each sample.Because a general basis for the classification is the division of the samples into good-prognosis and bad-prognosis groups, it is possible to evaluate the concordance of the classification output across multiple clas- sifiers. In this analysis, we observed the highest overlap between MDA114 and DeSousa (Cramer’s V = 0.711).
Similarly high concordance was observed between Marisa and MDA114 (0.681) outputs, and between the Budinska and both the DeSousa (0.601) and MDA114 (0.665) outputs. Concordance of classification output for all tests is depicted in Fig. 2A. Cramer’s V values for each pair are listed in Supplementary Table 4.
A more exhaustive evaluation is possible if the assignment of a sample into a good or a bad prognosis cohort is assessed separately. This approach is particularly important because one generally does not have the opportunity to perform each of the classifiers separately, and thus high concordance for results among particular assays will enable more reliable interpretation. Because such a correlation is most relevant for tests with high actual predic- tive potential, we performed a detailed analysis for the eight best-performing tests. Concordant assignment to a cohort with bad prognosis was most probable when applying the Marisa and Chang95, ODXcolon and Chang95 and DeSousa and Marisa tests. Assignment to a cohort with good prognosis was most likely similar for DeSousa and Chang95 and for DeSousa and ColoGuideEx results. Detailed results for identifying a sample as having a good or bad prognosis are displayed in Fig. 2B.
In addition to classification concordance, the proportional overlap among the genes comprising the tests was also compared. The highest overlap was observed between the CIN25 and Budinska (100% - all genes of the CIN25 are included in Budinska), CIN25 and CMS (76%) and MDA114 and CRCassigner.786 (68%) tests. The results for all tests are listed in Fig. 2C.
Power to predict survival is different for each molecular classifier.
When investigating the cor- relation between clinical and pathological parameters and survival, the most robust significance was reached when comparing stage I and stage III patients (n = 619, HR = 9.09, p = 3.4E-12). (Significance was higher when comparing stage I and stage IV, but with a low sample number.) MSI was also significant (n = 618, HR = 2.78, p = 1.3E-04). Grade (p = 0.62), gender (p = 0.12) and location (p = 0.52) were not significantly correlated with relapse-free survival. When assessing the effect of T, N and M, the highest difference was found between samples with metastasis (M = “1”) compared to non-metastatic patients (n = 169, p < 1.9E-18, HR > 10). Survival plots for stage and TNM are displayed in Fig. 1C.Survival analysis was first performed by using stage II and III patients only because prediction in this cohort has the highest clinical relevance and because over 74% of all patients in the validation database fall into this cate- gory. As computation of the hazard rate can only include two cohorts, we selected the best- and worst-performing subtypes for each classifier. Thus, intermediate cohorts and samples not classified were excluded. A forest plot listing all the classifiers is presented in Fig. 3A, and all the survival plots for each of the 22 classifiers are displayed in Supplementary Figure 1. The best-performing classifiers were the Yuen3 (p = 3.9E-05, HR = 2.9), Marisa (p = 1.74E-05, HR = 2.8), Chang95 (p = 9E-09, HR = 2.35), ODXcolon (p = 6.6E-02, HR = 2.05) and DeSousa (p = 3.8E-05, HR = 1.7) (see Fig. 3B–E). Similar results were obtained when using all patients (forest plot in Supplementary Figure 2 for all patients, and in Supplementary Figures 3 and 4 for stage II and stage III patients separately. The individual KM-plots are presented in Supplementary Figure 5).
When comparing the prediction efficacy of the classifiers to MSI status, gender, MKI67 expression and CDX2 expression, only the CRCassigner.786, the Meta163, Watanabe-CIN, Marisa, Chang95, Yuen3, and CMS remained significant (detailed results in Supplementary Table 5).
Finally, in an additional analysis we split stage 2 and stage 3 patients and separately evaluated each of the clas- sifiers in the two cohorts. Three of the classifiers had over 50% improved predictive accuracy in stage 2 patients including Chang95 (p = 3.8E-06, HR = 3.11), Marisa (p = 2.4E-03, HR = 3.3) and ODXcolon (p = 5.6E-06, HR = 2.61), while Yuen3 was the only classifier delivering better results in stage 3 patients (p = 3.1E-4, HR = 3.1).
Effect of signature member genes on overall prognostic power.
To evaluate the power of the genes included in the classifiers, we first performed a univariate survival analysis for all genes included. In this approach, the median expression of the genes was used to define two groups. All together 29% of the genes reached signifi- cance at p < 0.05 and 16% did so at p < 0.01. We then evaluated the percentage of the genes that were significant within each of the classifiers. The highest proportion of significant genes was reached by the CIN25 signature (82%), followed by the Meta163 (78%), TCA19 (74%) and ODXcolon (73%) gene sets. The lowest proportions were achieved by the V7RHS (14%), Oncodefender (20%) and CCHS (20%) signatures.Test Eligibility Classification technique Original training set Original validation set
name reference FF/FP stage cohorts methods for classification gene
n platform GSE datasets size
(n) validation GSE datasets size
(n)
Budinska 23 FF, FP II–III 5 linear discriminant
analysis 658 ALMAC, U133 + 2, U133A
14333, 2109, 17537,
PETACC3 425
4107, 4183, 10714, 15960, 13294, 18088, 26682, 26906, TCGA
720
CCHS 24 FF,FP II–III 2 sum score, pre-computed
cutoff 6 U133 + 2 13294, 5206,
17537, 17536 229 FFPE samples 126
Chang95 25 FF I–III 3 median of mean
expression 95 ALMAC, U133 + 2,
U133A, HuEx-1_0-st 28702, 5206 188
17536, 17537, 14333, 37892, 12945, 41258,
24551, E-MTAB-863, E-MTAB-864
682
CIN25 26 FF — 2 median of mean
expression 25 U133 + 2, U133A,
Rosetta multiple
(n = 18) 1,944 NA NA
CMS 27 FF, FP — 4 centroid-based predictor 693 Agilent, RNA–seq,
Affymetrix multiple (n = 18) 1,721
as of training (one dataset was split into equal training
and validation) 1,721
ColoGuideEx 29 FF II 2 number of genes
exceeding the 80th and 20th percentile
13 HuEx-1_0-st 24550, 29638,
30378 112 24550, 29638, 30378, 14333,
17538 203
ColoGuidePro 10 FF II–III 2 7 HuEx-1_0-st 30378 95 14333, 17538,
24550 290
CRCassigner-786 30 FF — 5 PAM 786 U133 + 2 13294, 14333 445
13294, 14333, 12945, 16125, 20916, 20842, 21510, TCGA,
28722
744
DeSousa 31 FF — 3 PAM 146 U133 + 2 33114 90
14333, 17538, 13294, 13067, 5851, 28702,
35144, E-MTAB-991,
TCGA
1,074
Marisa 32 FF — 6 centroid-based predictor 57 U133 + 2 39582 443
13067, 13294, 14333, 17536/17537, 18088, 26682, 33113, TCGA
1,181
MDA114 33 FF II–III 2 compound covariate
predictor 114 U133 + 2 17536 179 17537, 12945,
14333 213
Merlos-EphB2-ISC 34 FF — 3 average signature
expression 29 Affymetrix mouse4302 Mouse dataset 6894 18 17538, 14333 340
Merlos-Lgr5-ISC 34 FF — 3 average signature
expression 64 Affymetrix mouse4302 Mouse dataset 6894 18 17538, 14333 340
Meta163 35 FF II–III 2 PAM 128 U133 + 2 5206, 14333 188 14333 99
ODXcolon 36 FP II–III 3 weighted score 12 RT-PCR based — 1851 — 711
Oncodefender 46 FP I–II 2 multiplication of signature
genes 5 RT-PCR based — 74 — 264
Popovici 38 FP, FF II–III 2 closest mean expression 64 ALMAC-array PETACC-3 688 2138, 17538,
ALMAC 114
Schetter 40 FF — 2 weighted sum 9 RT-PCR based — 57 — 139
TCA19 41 FF III 2 median 19 U133 + 2 39582 566 14333, 33113,
37892 449
Yuen3 42 FF II–III 4 median per gene 3 U133 + 2 14333, 17538 458 — —
V7RHS 43 FP II 2 weighted sum 7 RT-PCR based — 233 — —
Watanabe-CIN 44 FF II–III 2 SVM 112 U133 + 2 30540 845 14333 290
Table 1. Summary of the implemented classifiers. Abbreviations: FP: FFPE; FF: fresh frozen; U133:
Affymetrix HG-U133A; U133 + 2: Affymetrix HG-U133Plus2.0; ALMAC: Affymetrix Almac Xcel Array for FFPE; Rosetta: Rosetta custom 25 K array.
We compared the proportion of significant genes to the HR values achieved by the classifiers using Spearman Rank correlation. More significant genes increased the classification power (correlation coefficient = 0.47, p = 0.014, see Fig. 3F).
Assignment of preclinical cell line models.
We identified 151 gene arrays from 61 unique cell lines meet- ing the eligibility criteria. Of these, 55 lines were published in the Cancer Cell Line Encyclopedia (GSE36133), 15 cell lines in GSE8332, 60 samples in the Cancer Cell Line Project (E-MTAB-37) and 21 in the GSE32474 dataset.There was no gene chip repeatedly published among the cell line arrays.
Figure 2. Concordance of classifier output and gene composition. Concordance across all classifiers in all samples (A) and for those identifying a sample as having a bad (red) or good (green) prognosis for the top eight classifiers in stage II/III patients (B). In each case, a Cramer’s V of 1 represents perfect concordance and 0 equals complete discordance. Percentile overlap of the list of genes included in the classifiers (C). An example for interpretation: Budinska contains 100% of the genes in the CIN25 signature, but these account for only 4% of all Budinska genes. V4HRS, Meta163 and Oncodefender are not included as these had less than 1% overlap against any other classifier.
A classification for the most frequently utilized cell lines for each molecular classifier with mutation states for the most important genes is presented in Table 2. For this classification, “frequent utilization” was established as having more than 50 hits in PubMed as of 29.09.2015. A detailed classification for each cell line versus each clas- sificator is listed in Supplementary Table 6.
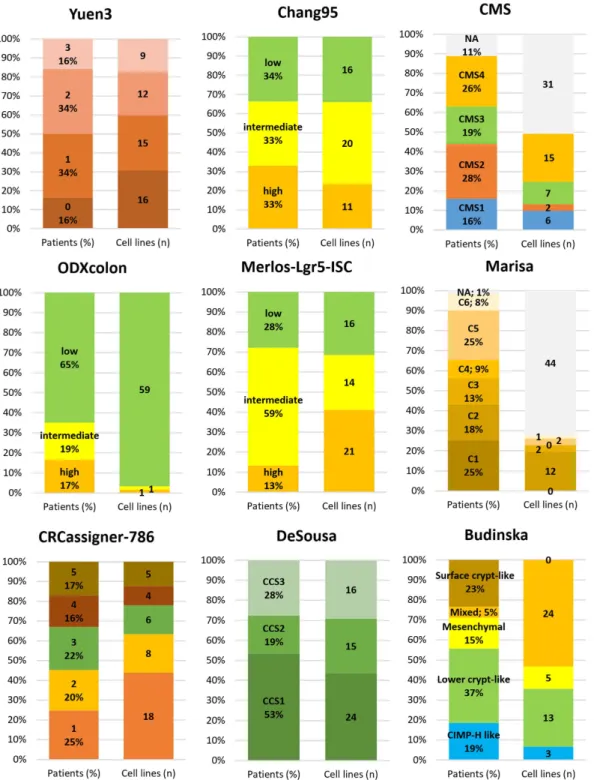
To enable preclinical models to be linked to subtypes, we examined the proportion of subtype designation for each classifier in all patients and the number of cell lines available for the given subtype. Many classifiers have multiple suitable cell line models (e.g., Yuen3, Chang95, DeSousa, CRCassigner-786), some are unbalanced among the cell lines (e.g., for ODXcolon nearly all cell lines are classified as “low risk”), and repeated measure- ments in cell lines delivered contradictory outputs for a few classifiers (e.g., Marisa and CMS). The results for the best-performing classifiers are displayed in Fig. 4.
Discussion
Truly personalized therapy is barely possible considering the high heterogeneity of colon cancer. However, one can assign a patient into a clinically and therapeutically relevant molecular subtype. Here, we compared 22 molec- ular subtypes in a large cohort of patients. In addition to ranking these, we also computed their concordance and identified preclinical models for their targeted evaluation. Although the total number of colon cancer patients with gene chip measurements was much higher (when combining all available datasets), we reduced the analysis to three overlapping array platforms. The use nearly identical gene chips enables a reliable cross-validation as different transcriptomic platforms measure the expression of the same gene with varying precision, on different relative scales, and with different dynamic ranges.
Currently, the NCCN guideline (www.nccn.org) lists three tests in its colon cancer guideline including OncotypeDX, ColoPrint and ColoGuideEx. These tests are suggested as additional data to inform the risk of recurrence over other risk factors, but to date no evidence supports their predictive value. We were not able to re-programme ColoPrint, a custom chip based assay utilizing FFPE samples8, because of insufficient description of the method. Interestingly, when comparing the classification delivered by OncotypeDX and ColoGuideEx, both reached statistical significance. However, at the same time only minimal concordance in sample designation was observed. This observation suggests the investigation of distinct pathways by these classifiers.
One of the major driving forces behind the development of subtype classification is the lack of clear guidelines for the administration of adjuvant chemotherapy for stage II and stage III colon cancer patients. For stage II patients, chemotherapy is not routinely offered unless they have a high-risk disease. For stage III disease, adjuvant therapy is generally recommended unless the patient is over 75 years of age. However, despite improvements in surgery, approximately 20% of colon cancer cases relapse, so it will be imperative to identify patients at high risk.
In line with this need, for the majority of the algorithms the goal of the subdivision is to identify patient sets with different prognostic features. However, independent validation has been performed for few of the studies, including ColoPrint9 and ColoGuidePro10. However, the number of samples utilized was very low in each case (n = 62 and n = 107, respectively). One previous study attempted to compare the prognostic performance of Figure 3. Relative classifier performance in stage II/III patients. A forest plot showing the performance of all classifiers in stage II and III patients (A). Samples included in the original training sets were excluded from the validation analysis (*with the exception of CMS). For classifiers with more than two outputs, the best- and worst-performing cohorts were compared when computing the hazard rate. Kaplan-Meier plot for the best- performing classifiers including Yuen3 (B), Chang95 (C), Marisa (D) and ODXcolon (E). A higher percentage of genes included in the classifier significant in univariate analysis results in a higher hazard rate achieved by the classifier (*all patients for CMS) (F). The dotted lines represent the proportion of genes significant at p = 0.05 and p = 0.01 among all genes on the gene chips in univariate analysis.
five colon cancer classifiers in a set 229 and 168 patients11. In that study, only two classifiers, OncotypeDX and MDA114, delivered a robust result. Moreover, despite the minimal overlap of utilized markers, the two classifiers had significant concordance when assigning the patients into risk categories.
On the other hand, classifications are not necessarily informative in terms of treatment efficacy. An example for this is a recently published study showing that patients with CMS4 had poor prognosis but didn’t benefit of intensive adjuvant therapy12.
In contrast to intuitive expectations, the overlap among individual markers involved in the molecular classi- fiers is rather limited. Only five genes (REG4, ASCL2, VAV3, C10orf99 and CYPB1) were included in at least six classifications. Previously, these genes were already reported to have distinct prognostic power. REG4 positivity by IHC was proven to have favourable impact on overall survival in non-mucinous CRC13. Patients with higher expression of the VAV3 oncogene had a poorer disease-free survival rate14. The ASCL2 transcription factor has an active role in specifying intestinal stem-cell identity and promotes cell proliferation. Higher levels of ASCL2 have been linked to worse prognosis3. C10orf99 (also known as CSBF) is down-regulated in colon cancer15.
The three highest scoring genes include CTGF (Connective Tissue Growth Factor), GADD45B (Growth Arrest and DNA-Damage-inducible, beta), and FAP (Fibroblast Activation Protein). Similarly to our results, the overexpression of CTGF was associated with shorter overall survival in multiple colon cancer subgroups16. Likewise, high expression of FAP has also been described to lead to poor patient prognosis17. Oncogenic K-RAS was associated with transcription of the antiapoptotic GADD45B18. However, no direct correlation between sur- vival and GADD45B expression in colon cancer has been described earlier.
Increasing the number of markers in a classifier did not provide better classification accuracy in a previous study focusing on breast cancer19. Here, we observed a similar trend as the best performing classifier (Yuen3) is based on only three genes. In our analysis, markers containing more significant genes per se in univariate analysis had higher prognostic power.
An alternative approach for patient stratification would be to avoid the utilization of a pre-selected set of genes to assign patients into subdivisions. Rather, a whole transcriptome gene expression signature could be applied to pinpoint patients similar to the investigated one, with prognostic expectations then being determined by further evaluating the clinical outcome of these similar patients as has been demonstrated recently20. However, to date no similar methodology has been proposed for colon cancer, thus we have not included such a model in our meta-analysis.
In summary, we present here a large-scale cross-validation of multigene colon cancer prognostic tools using a combination of multiple independent datasets. The results are useful for future clinical trials to select the most appropriate molecular subtype stratification. Our study will also be useful for selecting preclinical models corre- sponding to each subtype for biomarker selection, drug discovery and treatment stratification.
Methods
Database construction.
We assembled a large database of colon cancer samples measured by Affymetrix HGU133A (GPL96), HGU133Aplus2 (GPL570) and HGU133Av2 (GPL571) microarrays by using the key- words “colon”, “cancer”, “GPL96”, “GPL571” and “GPL570” in GEO (http://www.ncbi.nlm.nih.gov/geo/). Only Table 2. Assignment of preclinical models to the closest subtype. Assignment of the most frequently utilized cell lines to each of the molecular classifiers based on a gene-array-based expression profile of the cell line.In case multiple arrays were utilized for a given cell line, and more than 40% of the arrays delivered different results, then the given cell line was not classified for that classificator. Mutation status is shown for the six most important genes, and MSI status is also shown for each cell line. Abbreviations: M: mutant, WT: wild type, H:
high, L: low, int: intermediate, Bm: BRAF mutant, MSH: MSI-High, MSS: MSI Stable, Sample n: number of gene chip samples providing expression data for the classification.
publications with raw data, clinical data preferably including survival length, and at least 30 patients were included. The only microarrays included were GPL96, GPL571 and GPL570 because these platforms are fre- quently used and they share 22,277 common probe sets.
After an initial quality control step, redundant samples (n = 777) were identified and removed from the combined database. The raw.CEL files were MAS5/RMA normalized in the R environment (www.r-project.org) using Bioconductor libraries (www.bioconductor.org). For studies not designating a probe set id preference, we employed JetSet to select the most reliable probe set for each gene21.
Figure 4. Linking prevalence and preclinical models. Subtype designation proportion for each classifier in all patients (left column, in percentage), and number of cell lines available for the given subtype (right column, n) for the best-performing classifiers. Grey corresponds to NA in each classifier. There are no representative cell line models for some of the subtypes.
Colon cancer subtypes.
Studies publishing colon cancer classifiers were identified using PubMed (www.pubmed.com) using the search terms “gene expression profiling”, “transcriptome”, “colorectal neoplasms”, “prognosis”, and “survival analysis”. Eligibility criteria for the studies were utilization of clinical samples for the discovery of subtypes, English language and publication of the statistical method developed. The search was performed according to the PRISMA guidelines22. Table 1 contains the most important characteristics for each of the subtype determination studies.
Statistical computations were performed in the R statistical environment. We set up a statistical computation pipeline for the classifiers that were not accompanied by an R function. The R scripts of these are available at Github (https://github.com/CRCInvestigation). For each classifier, samples included in the original training sets were excluded from the performed validation analysis (with the exception of the CMS which already included all available sample in their validation). After classifying each sample in the complete validation dataset (n = 2,166), the overlap between the different subtype classifications was calculated using Cramer’s V.
Budinska – unsupervised clustering of five subtypes.
Budinska et al.23 characterized five CRC sub- types based on unsupervised clustering of genome-wide expression patterns. A multiclass linear discriminant was trained on core samples with 54 meta-genes (658 genes) as variables to assign new samples to one of the following subtypes: surface crypt-like, lower crypt-like, CIMP-H-like, mesenchymal and mixed.CCHS – hypoxia score with prognostic relevance.
Genes expressed differentially under chronic hypoxia versus normoxic conditions were compared for their prognostic value in public gene expression data leading to the Colon Cancer Hypoxia Score (CCHS) model24. The CCHS score is determined as a multiple of the expression values of six genes: score = 1.301 + 0.543*[BCCIP] − 0.416*[BNIP3L] + 0.596*[GADD45B] + 0.538*[INSIG2] − 0.177*[TP53]. The CCHS model was evaluated in formalin-fixed paraffin-embedded (FFPE) samples, and patients with a CCHS score higher than 4.526 had significantly worse disease-free survival (DFS).
Chang95 – high, low and intermediate risk of relapse.
Chang et al. constructed a 95-gene gene chip based signature and a 4-gene IHC signature after a network analysis of previously published gene sets25. Here we examine the 95-gene signature, in which patients are divided into three groups based on the mean expression value of the signature.CIN25 – high or low chromosomal instability.
In this meta-analysis of 12 cancer microarray data sets representing six cancer types, Carter et al.26 identified a 25-gene gene expression signature of chromosomal instability (CIN). When the average expression of these genes was higher than the median, the sample was expected to have a high CIN status and bad prognosis. For classification with the same set of genes, we used MAS5-normalized and median-centred gene expression values.CMS – four consensus subtypes.
Four consensus molecular subtypes (CMSs) were derived in a cross-platform analysis involving six previously published independent classifiers27. The four CMSs include a microsatellite unstable (CMS1), a canonical (CMS2), a metabolic (CMS3) and a mesenchymal (CMS4) subtype, each with distinctive biological features. CMS1 had the worst survival, CMS3 and CMS4 intermediate and CMS2 the best. Approximately 13% of the samples investigated in the original study were not classified - these did not represent a fifth independent subtype but rather displayed mixed features of the previous ones.The consensus molecular subtypes were identified using the same set of patients evaluated in our present cross-validation analysis – for this reason, it was not possible to compute the predictive power after exclusion of the training set for this classifier. In addition to the CMS, we also evaluated five of the six original classifiers (Budinska, Schlicker, CRCassigner.786, DeSousa and Marisa). It was not possible to re-programme the sixth subtype28 because of insufficient data published in the original study.
ColoGuideEx – high and low risk of relapse.
Agesen at al.29 developed a 13-gene gene classifier to improve risk stratification for stage II CRC patients. ColoGuideEx classifies samples into cohorts having high or low risk of relapse on a gene-by-gene basis. A cutoff gene expression value above the 80th or below the 20th per- centile (depending on whether high or low expression is associated with high risk of relapse, respectively) is used for the classification. Then, the 13 genes are tallied – samples having at least five genes with a positive prognostic score are classified as having high risk of relapse. Due to the utilization of a larger dataset, the cutoff values at the 80th and 20th percentiles were different in our study.ColoGuidePro – poor and good prognosis.
Sveen et al.10 aimed to improve prognostic stratification for patients with stage II and III colorectal cancer using a seven-gene signature. In this signature, higher expression of four genes (DMBT1, NT5E, SEMA3A, and WNT11) and lower expression of three genes (CXCL9, OLFM4, UGT2B17) were associated with poor prognosis. Patients are assigned to the poor prognostic group when expressing three or more genes in the 7-gene signature at levels associated with poor prognosis.CRCassigner – unsupervised analysis deriving five subtypes.
Unsupervised clustering is useful for detecting new subtypes independent of known clinical and molecular parameters. Using consensus-based non-negative matrix factorization to cluster gene expression data, Sadanandam et al. have derived a signa- ture capable of discriminating five subtypes including goblet-like, enterocyte, stem-like, inflammatory, and transit-amplifying subtypes30. With 786 genes, this classifier utilizes the most extensive list of probes. The classi- fication itself is performed with a prediction analysis for microarrays algorithm.DeSousa – CIN and MSI in one classifier.
De Sousa et al. recognized three main molecularly distinct sub- types using an unsupervised classification algorithm31. The subtypes were characterized as chromosomal-unstable, microsatellite-unstable and microsatellite stable carcinomas with a CpG island methylator phenotype. The classi- fication was achieved with the prediction analysis of microarray package. Using the DeSousa2013 R package, we re-trained a PAM classifier with probes present on the HGU133A arrays.Marisa – six subtypes with dominant biological characteristics.
The objective of this study was to establish a comprehensive molecular classification of colon cancer based on mRNA expression profile analysis with unsupervised consensus hierarchical clustering32. Samples are divided with the citccmst R package according to their main respective biological characteristics into six subtypes: CIN-ImmuneDown (C1), dMMR - deficient mismatch repair (C2), KRAS-mutant (C3), cancer stem cell (C4), CIN-WntUp (C5), and CIN-normal (C6). The classification itself was conducted with a standard distance-to-centroid approach.MDA114 – long and short survival groups.
A random-variance t-test between two colorectal cancer groups revealed by unsupervised hierarchical clustering show distinct biological relation to prognosis33. For HGU133Plus2.0 arrays we employed all 114 genes of the signature, for HGU133A arrays – in line with the orig- inal article – we utilized the 80 probes shared between the U133A and U133Plus2.0 gene chips. The classificator was trained on the GSE17536 dataset as described in the original article.Merlos-Suarez – intestinal stem cell signature for three subtypes.
Merlos-Suarez et al. reported a gene signature specific to adult intestinal stem cells (ISCs) predicting disease relapse in CRC34. The authors iden- tified a global expression profile of EphB2 receptor overexpressing ISCs (29 genes) and Lgr5 overexpressing ISCs (64 genes). Based on the average expression of the signature, samples are enrolled into three groups in which the EphB-ISC and the Lgr5-ISC signatures show prognostic value.Meta163 –Dukes B and C classification.
Dukes stage B and C cancers cluster into two groups resembling early-stage and metastatic tumours35. The PAM algorithm identified 128 genes (163 probe sets) capable of clas- sifying individual intermediate-stage cancers into stage A-like/good prognosis or stage D-like/poor prognosis types. The training set comprised 188 Dukes A and D samples. We used RMA-normalized data, and only class predictions over 90% were scored.ODXcolon – low, intermediate and high risk of recurrence.
The Oncotype DX assay36 is another RT-PCR based diagnostic test optimized for estimating risk of recurrence in stage II or III colon cancer from FFPE samples. This 7 + 5 (cancer-related and reference) gene test has been clinically validated using data from three prospectively designed studies. We previously demonstrated the reproducibility of the Oncotype DX recur- rence score (RS) for breast cancer using Affymetrix gene chips37. Here, we have executed an analogous approach:the expression (Δ Ct) values are calculated as Δ Ct (geneX) = − 15-(log2 (mean (housekeeping genes))-log2 (geneX)). Then, the computation is performed as in the original equation. In case the RS is less than 30, the patient is considered having “low” risk of recurrence, between 30 and 40 “intermediate”, and all above are at
“high” risk.
Oncodefender – prediction of recurrence.
Oncodefender is a 5 + 5 gene RT-PCR based test optimized for FFPE samples to predict recurrence of lymph node-negative invasive colorectal carcinoma37. The prog- nostic value of the test has been validated in stage I CRC and stage II colon cancer samples. After RMA nor- malization, the expression values of five housekeeping genes (B2M, GUSB, POLR2L, PSMB6, and UBC) were extracted from the expression of five genes comprising the signature. The Oncodefender signature score = abs (BMI1 × VEGFA ÷ H3F3B) − abs (ETV6 × H3F3B ÷ RPS10) as described in the original article. Instead of using the originally published cutoff values, we used the median for risk prediction because this modification delivered higher discriminatory power.Popovici – surrogate measurement of BRAF status.
Mutational status is already a key element in treatment decision making for colorectal cancer. Popovici et al.38 aimed to identify a surrogate signature for BRAF mutation status. BRAF-mutated colorectal cells harbour a KRAS-independent pathway-responsive gene signature in colorectal cancer39. The classification model of Popovici et al. consists of two groups of genes (G1 and G2), and the prediction is made by comparing the averages of these groups. Samples in which the average of G1 is smaller than the average of G2 are predicted to be BRAF-mutant-like, otherwise they are wild-type-like.Schetter – high and low inflammatory risk score.
In their study, Schetter et al.40 identified an RT-PCR based inflammatory gene expression signature with prognostic power in colon cancer. After normalization of the gene expression to 18 S rRNA, two models, the “noncancerous risk model” and the “tumour risk model” are combined in their setup. Individuals who have higher than median values for both models are classified as having a high inflammatory risk score (IRS). All others are considered low.TCA19 – a risk score for stage III patients.
Using RNAseq data from normal colon, primary CRC, and liver metastases, Kim et al. developed a 19-gene risk score41. The risk score for each patient is calculated as the sum of each gene’s score, which is derived by multiplying the expression level of a gene by its corresponding Cox regression coefficient from the signature from the CIT cohort (GSE39582). Patients are divided into two groups using the median cut-off of the risk score. Patients designated as high risk with stage III disease showed signifi- cantly inferior DFS than low-risk patients, whereas there was no significant difference in DFS between high- and low-risk patient groups in stage II disease.Yuen3 – four cohorts with three genes.
Yuen et al. combined the expression of three genes (TAZ, AXL, and CTGF) into a prognostic classification. Expression levels are divided into high and low groups using the median expression as the cut-off, and patients are enrolled into one of 4 groups based on the number of overex- pressed genes (0/1/2/3)42. Patients who had higher than median expression for all 3 genes had the worst prognosis.V7RHS – high or low relapse hazard score.
The RT-PCR based V7RHS test was designed by Jiang et al.43 to use FFPE samples to predict recurrence in stage II colon cancer. Expression (Δ Ct) values of seven genes are uti- lized to calculate a relapse hazard score (RHS) for each patient. Here, we generated Δ Ct values by extracting the RMA-normalized, median-centred, log2-transformed gene expression levels of the housekeeping genes used in the original study (ACTB, HMBS, and RPL13A) from the expression of the seven genes in the signature. Patients with higher than 0 RHS were classified as having high risk of recurrence.Watanabe-MSI and Watanabe-CIN – predicting MSI and CIN status.
Instead of establishing new classifiers in an unsupervised analysis, Watanabe et al. aimed to utilize gene expression signatures to classify patients according to two established clinically useful parameters, microsatellite instability (MSI) and chro- mosomal instability (CIN). By comparing MSI and microsatellite stable (MSS) colorectal cancers using DNA microarray analysis, they identified 177 discriminating probe sets predicting MSI status with high accuracy44. MSI cancers have shown better prognosis compared to MSS cancers. Here, we performed the identical preproc- essing steps described in the original article for both the training and test sets. We also trained the KNN classifica- tor using the same dataset (GSE5445). The second gene signature classifies samples into CIN-high and CIN-low classes using microarray data44. The CIN classes correlate with survival in stage II and III colorectal cancer.Ranking of genes included in the classifiers.
For each gene, we computed a score to represent the rel- ative significance of the gene across all datasets. First, the relative proportion of each marker was computed in each gene signature by dividing 1 by the total number of genes included in the signature. Then, the gene score was computed as: “gene score” = [number of classifiers containing the gene]*[sum of gene proportion in each dataset].Comparison of classification performance.
Cox proportional hazards regression and Kaplan-Meier plots were utilized for survival analysis using samples with published survival data (n = 1,405). In this analysis, the subtype designation was used to assign the samples to different cohorts. In case there were more than two sub- types, only the subtypes with the best and worst outcome were used to make comparison between all classifiers possible. Multivariate analysis was performed for each classifier with available prognostic parameters including MSI status, gender, MKI67 expression as a surrogate marker for proliferation and CDX2 expression45.Identification of representative cell line models.
Gene expression signatures of colon cancer cell lines were screened in GEO and Array Express. Eligibility criteria included human origin, the availability of raw gene chip data derived using Affymetrix HGU 133 plus 2.0 series of arrays and strict identification of the cell line pref- erably with ATCC identifiers.Some of the cell lines were published in multiple studies – in these cases, we computed a classification for each sample and used a tally for the final result: in case at least 60% of the arrays for the same cell line delivered the identical result, then this was considered robust. In all other cases, the given classifier was designated as “NA” for the cell line. Mutational status of KRAS, BRAF, PIK3CA, PTEN, TP53 and APC in each cell line was retrieved from data published in COSMIC (http://cancer.sanger.ac.uk/cosmic) or the Cancer Cell Line Encyclopedia (http://www.broadinstitute.org/ccle).
References
1. Heinemann, V., Douillard, J. Y., Ducreux, M. & Peeters, M. Targeted therapy in metastatic colorectal cancer – an example of personalised medicine in action. Cancer treatment reviews 39, 592–601, doi: 10.1016/j.ctrv.2012.12.011 (2013).
2. Yamauchi, M. et al. Colorectal cancer: a tale of two sides or a continuum? Gut 61, 794–797, doi: 10.1136/gutjnl-2012-302014 (2012).
3. Cancer Genome Atlas, N. Comprehensive molecular characterization of human colon and rectal cancer. Nature 487, 330–337, doi:
10.1038/nature11252 (2012).
4. Amado, R. G. et al. Wild-type KRAS is required for panitumumab efficacy in patients with metastatic colorectal cancer. J Clin Oncol 26, 1626–1634, doi: 10.1200/JCO.2007.14.7116 (2008).
5. Vaughn, C. P., Zobell, S. D., Furtado, L. V., Baker, C. L. & Samowitz, W. S. Frequency of KRAS, BRAF, and NRAS mutations in colorectal cancer. Genes, chromosomes & cancer 50, 307–312, doi: 10.1002/gcc.20854 (2011).
6. Segditsas, S. & Tomlinson, I. Colorectal cancer and genetic alterations in the Wnt pathway. Oncogene 25, 7531–7537, doi: 10.1038/
sj.onc.1210059 (2006).
7. Gyorffy, B. et al. Multigene prognostic tests in breast cancer: past, present, future. Breast cancer research: BCR 17, 11, doi: 10.1186/
s13058-015-0514-2 (2015).
8. Kennedy, R. D. et al. Development and independent validation of a prognostic assay for stage II colon cancer using formalin-fixed paraffin-embedded tissue. J Clin Oncol 29, 4620–4626, doi: 10.1200/JCO.2011.35.4498 (2011).
9. Salazar, R. et al. Gene expression signature to improve prognosis prediction of stage II and III colorectal cancer. J Clin Oncol 29, 17–24, doi: 10.1200/JCO.2010.30.1077 (2011).
10. Sveen, A. et al. ColoGuidePro: a prognostic 7-gene expression signature for stage III colorectal cancer patients. Clinical cancer research: an official journal of the American Association for Cancer Research 18, 6001–6010, doi: 10.1158/1078-0432.CCR-11-3302 (2012).
11. Park, Y. Y. et al. Comparison of prognostic genomic predictors in colorectal cancer. PloS one 8, e60778, doi: 10.1371/journal.
pone.0060778 (2013).
12. Song, N. et al. Clinical Outcome From Oxaliplatin Treatment in Stage II/III Colon Cancer According to Intrinsic Subtypes:
Secondary Analysis of NSABP C-07/NRG Oncology Randomized Clinical Trial. JAMA oncology 2, 1162–1169, doi: 10.1001/
jamaoncol.2016.2314 (2016).
13. Kaprio, T. et al. REG4 independently predicts better prognosis in non-mucinous colorectal cancer. PloS one 9, e109600, doi: 10.1371/
journal.pone.0109600 (2014).
14. Uen, Y. H. et al. VAV3 oncogene expression in colorectal cancer: clinical aspects and functional characterization. Scientific reports 5, 9360, doi: 10.1038/srep09360 (2015).
15. Pan, W. et al. CSBF/C10orf99, a novel potential cytokine, inhibits colon cancer cell growth through inducing G1 arrest. Scientific reports 4, 6812, doi: 10.1038/srep06812 (2014).
16. Zhang, S. D. et al. Association between the expression levels of TAZ, AXL and CTGF and clinicopathological parameters in patients with colon cancer. Oncology letters 11, 1223–1229, doi: 10.3892/ol.2015.3999 (2016).
17. Wikberg, M. L. et al. High intratumoral expression of fibroblast activation protein (FAP) in colon cancer is associated with poorer patient prognosis. Tumour biology: the journal of the International Society for Oncodevelopmental Biology and Medicine 34, 1013–1020, doi: 10.1007/s13277-012-0638-2 (2013).
18. Serova, M. et al. Epithelial-to-mesenchymal transition and oncogenic Ras expression in resistance to the protein kinase Cbeta inhibitor enzastaurin in colon cancer cells. Molecular cancer therapeutics 9, 1308–1317, doi: 10.1158/1535-7163.MCT-10-0167 (2010).
19. Lehmann, B. D. et al. Identification of human triple-negative breast cancer subtypes and preclinical models for selection of targeted therapies. The Journal of clinical investigation 121, 2750–2767, doi: 10.1172/JCI45014 (2011).
20. Gyorffy, B. et al. Dynamic classification using case-specific training cohorts outperforms static gene expression signatures in breast cancer. International journal of cancer. Journal international du cancer 136, 2091–2098, doi: 10.1002/ijc.29247 (2015).
21. Li, Q., Birkbak, N. J., Gyorffy, B., Szallasi, Z. & Eklund, A. C. Jetset: selecting the optimal microarray probe set to represent a gene.
BMC Bioinformatics 12, 474, doi: 10.1186/1471-2105-12-474 (2011).
22. Moher, D., Liberati, A., Tetzlaff, J., Altman, D. G. & Group, P. Preferred reporting items for systematic reviews and meta-analyses:
the PRISMA statement. PLoS medicine 6, e1000097, doi: 10.1371/journal.pmed.1000097 (2009).
23. Budinska, E. et al. Gene expression patterns unveil a new level of molecular heterogeneity in colorectal cancer. The Journal of pathology 231, 63–76, doi: 10.1002/path.4212 (2013).
24. Dekervel, J. et al. Hypoxia-driven gene expression is an independent prognostic factor in stage II and III colon cancer patients.
Clinical cancer research: an official journal of the American Association for Cancer Research 20, 2159–2168, doi: 10.1158/1078-0432.
CCR-13-2958 (2014).
25. Chang, W. et al. Gene expression profiling-derived immunohistochemistry signature with high prognostic value in colorectal carcinoma. Gut 63, 1457–1467, doi: 10.1136/gutjnl-2013-305475 (2014).
26. Carter, S. L., Eklund, A. C., Kohane, I. S., Harris, L. N. & Szallasi, Z. A signature of chromosomal instability inferred from gene expression profiles predicts clinical outcome in multiple human cancers. Nat Genet 38, 1043–1048, doi: 10.1038/ng1861 (2006).
27. Guinney, J. et al. The consensus molecular subtypes of colorectal cancer. Nature medicine 21, 1350–1356, doi: 10.1038/nm.3967 (2015).
28. Roepman, P. et al. Colorectal cancer intrinsic subtypes predict chemotherapy benefit, deficient mismatch repair and epithelial-to- mesenchymal transition. International journal of cancer. Journal international du cancer 134, 552–562, doi: 10.1002/ijc.28387 (2014).
29. Agesen, T. H. et al. ColoGuideEx: a robust gene classifier specific for stage II colorectal cancer prognosis. Gut 61, 1560–1567, doi:
10.1136/gutjnl-2011-301179 (2012).
30. Sadanandam, A. et al. A colorectal cancer classification system that associates cellular phenotype and responses to therapy. Nature medicine 19, 619–625, doi: 10.1038/nm.3175 (2013).
31. De Sousa, E. M. F. et al. Poor-prognosis colon cancer is defined by a molecularly distinct subtype and develops from serrated precursor lesions. Nature medicine 19, 614–618, doi: 10.1038/nm.3174 (2013).
32. Marisa, L. et al. Gene expression classification of colon cancer into molecular subtypes: characterization, validation, and prognostic value. PLoS medicine 10, e1001453, doi: 10.1371/journal.pmed.1001453 (2013).
33. Oh, S. C. et al. Prognostic gene expression signature associated with two molecularly distinct subtypes of colorectal cancer. Gut 61, 1291–1298, doi: 10.1136/gutjnl-2011-300812 (2012).
34. Merlos-Suarez, A. et al. The intestinal stem cell signature identifies colorectal cancer stem cells and predicts disease relapse. Cell stem cell 8, 511–524, doi: 10.1016/j.stem.2011.02.020 (2011).
35. Jorissen, R. N. et al. Metastasis-Associated Gene Expression Changes Predict Poor Outcomes in Patients with Dukes Stage B and C Colorectal Cancer. Clinical cancer research: an official journal of the American Association for Cancer Research 15, 7642–7651, doi:
10.1158/1078-0432.CCR-09-1431 (2009).
36. Clark-Langone, K. M., Sangli, C., Krishnakumar, J. & Watson, D. Translating tumor biology into personalized treatment planning:
analytical performance characteristics of the Oncotype DX Colon Cancer Assay. BMC cancer 10, 691, doi: 10.1186/1471-2407-10- 691 (2010).
37. Gyorffy, B. et al. RecurrenceOnline: an online analysis tool to determine breast cancer recurrence and hormone receptor status using microarray data. Breast cancer research and treatment 132, 1025–1034, doi: 10.1007/s10549-011-1676-y (2012).
38. Popovici, V. et al. Identification of a poor-prognosis BRAF-mutant-like population of patients with colon cancer. J Clin Oncol 30, 1288–1295, doi: 10.1200/JCO.2011.39.5814 (2012).
39. Gyorffy, B. et al. Effects of RAL signal transduction in KRAS- and BRAF-mutated cells and prognostic potential of the RAL signature in colorectal cancer. Oncotarget 6, 13334–13346, doi: 10.18632/oncotarget.3871 (2015).
40. Schetter, A. J. et al. Association of inflammation-related and microRNA gene expression with cancer-specific mortality of colon adenocarcinoma. Clinical cancer research: an official journal of the American Association for Cancer Research 15, 5878–5887, doi:
10.1158/1078-0432.CCR-09-0627 (2009).
41. Kim, S. K. et al. A nineteen gene-based risk score classifier predicts prognosis of colorectal cancer patients. Molecular oncology 8, 1653–1666, doi: 10.1016/j.molonc.2014.06.016 (2014).
42. Yuen, H. F. et al. TAZ expression as a prognostic indicator in colorectal cancer. PloS one 8, e54211, doi: 10.1371/journal.
pone.0054211 (2013).
43. Jiang, Y. et al. Development of a clinically feasible molecular assay to predict recurrence of stage II colon cancer. The Journal of molecular diagnostics: JMD 10, 346–354, doi: 10.2353/jmoldx.2008.080011 (2008).
44. Watanabe, T. et al. Chromosomal instability (CIN) phenotype, CIN high or CIN low, predicts survival for colorectal cancer. J Clin Oncol 30, 2256–2264, doi: 10.1200/JCO.2011.38.6490 (2012).
45. Dalerba, P. et al. CDX2 as a Prognostic Biomarker in Stage II and Stage III Colon Cancer. The New England journal of medicine 374, 211–222, doi: 10.1056/NEJMoa1506597 (2016).
46. Lenehan, P. F. et al. Generation and external validation of a tumor-derived 5-gene prognostic signature for recurrence of lymph node-negative, invasive colorectal carcinoma. Cancer 118, 5234–5244, doi: 10.1002/cncr.27628 (2012).
Acknowledgements
The study was supported by the OTKA K108655 grant.
Author Contributions
Z.S. and B.G. conceived and designed the project. B.G. established the used database and supervised the project.
Z.S. and B.G. carried out the analysis, interpretation of data: and the writing of the manuscript.
Additional Information
Supplementary information accompanies this paper at http://www.nature.com/srep Competing financial interests: The authors declare no competing financial interests.
How to cite this article: Sztupinszki, Z. and Győrffy, B. Colon cancer subtypes: concordance, effect on survival and selection of the most representative preclinical models. Sci. Rep. 6, 37169; doi: 10.1038/srep37169 (2016).
Publisher's note: Springer Nature remains neutral with regard to jurisdictional claims in published maps and institutional affiliations.
This work is licensed under a Creative Commons Attribution 4.0 International License. The images or other third party material in this article are included in the article’s Creative Commons license, unless indicated otherwise in the credit line; if the material is not included under the Creative Commons license, users will need to obtain permission from the license holder to reproduce the material. To view a copy of this license, visit http://creativecommons.org/licenses/by/4.0/
© The Author(s) 2016