CAUSEL: An epigenome and genome editing pipeline for establishing function of non-coding GWAS variants
Sandor Spisak1,*, Kate Lawrenson2,*,¶, Yanfang Fu3,4,*, Istvan Csabai5, Rebecca T.
Cottman3,6, Christopher Haiman2,7, Ying Han2, Ji-Heui Seo1, Romina Lenci1, Qiyuan Li1,8, Viktoria Tisza1,9, Zoltan Szallasi9,10,11, Zachery T. Herbert12, Matthew Chabot1, Mark Pomerantz1, Norbert Solymosi13 on behalf of The GAME-ON/ELLIPSE Consortium, Simon Gayther2,§, J. Keith Joung3,4,6,§, and Matthew L. Freedman1,14,§
1Department of Medical Oncology, Dana-Farber Cancer Institute, Boston, MA, USA
2Department of Preventive Medicine, University of Southern California/Keck School of Medicine, Los Angeles, CA, USA
3Molecular Pathology Unit, Center for Cancer Research, and Center for Computational and Integrative Biology, Massachusetts General Hospital, Charlestown, MA, USA
4Department of Pathology, Harvard Medical School, Boston, MA, USA
5Department of Physics of Complex Systems, Eötvös Loránd University, Budapest, Hungary
6Program in Biological and Biomedical Sciences, Harvard Medical School, Boston, MA 02115 USA
7Norris Comprehensive Cancer Center, University of Southern California, Los Angeles, CA, USA
Users may view, print, copy, and download text and data-mine the content in such documents, for the purposes of academic research, subject always to the full Conditions of use:http://www.nature.com/authors/editorial_policies/license.html#terms
Please address correspondence to: freedman@broadinstitute.org, JJOUNG@mgh.harvard.edu, Simon.Gayther@med.usc.edu.
*These authors contributed equally to this work
§co-corresponding authors
¶current address is Women’s Cancer Program at the Samuel Oschin Comprehensive Cancer Institute, Cedars-Sinai Medical Center, Los Angeles, CA, 90048, USA
The GAME-ON/ELLIPSE Consortium
A complete list of all consortia members is provided in the Supplementary Note.
Author contributions
S.S., K.L., and Y.F. designed and performed experiments, J.K.J. and M.L.F. designed experiments, R.C., J.H.S., R.L., V.T., G.O.E., M.C., M.P., performed experiments, S.S., I.C., and M.L.F. developed the sequencing pipeline, S.S., K.L., Y.F., Y.H., Q.L., I.C., Z.H., N.S., and G.O.E. analyzed the data, S.S., K.L., Y.F., I.C., J.K.J., and M.L.F. wrote the manuscript, S.S., R.C., S.G., J.K.J., and M.L.F.
revised the manuscript, C.H., Z.S., Z.H., and S.G. provided technical support and conceptual advice. The GAME-ON/ELLIPSE consortium provided early access to fine mapping data.
Accession codes Amplicon sequencing:
PRJNA289208
http://www.ncbi.nlm.nih.gov/bioproject/289208 RNA-seq data
PRJNA295437
http://www.ncbi.nlm.nih.gov/bioproject/295437 Conflict of interest statement:
J.K.J. is a consultant for Horizon Discovery. J.K.J. has financial interests in Editas Medicine, Hera Testing Laboratories, Poseida
HHS Public Access
Author manuscript
Nat Med. Author manuscript; available in PMC 2016 May 01.
Published in final edited form as:
Nat Med. 2015 November ; 21(11): 1357–1363. doi:10.1038/nm.3975.
Author Manuscript Author Manuscript Author Manuscript Author Manuscript
8Medical College, Xiamen University, Xiamen, China
9Computational Health Informatics Program (CHIP), Boston Children’s Hospital, Boston, MA, USA
10Department of Systems Biology, Technical University of Denmark, Lyngby, Denmark
112nd Department of Pathology, Semmelweis University, Budapest, Hungary
12Molecular Biology Core Facilities at Dana-Farber Cancer Institute, Boston, MA, USA
13Department of Animal Hygiene, Szent István University, Budapest, Hungary
14The Eli and Edythe L. Broad Institute, Cambridge, Massachusetts, USA
Abstract
The vast majority of disease-associated single nucleotide polymorphisms (SNPs) mapped by genome-wide association studies (GWAS) are located in the non-protein coding genome, but establishing the functional and mechanistic roles of these sequence variants has proven challenging. Here, we describe a general pipeline in which candidate functional SNPs are first evaluated by fine-mapping, epigenomic profiling, and epigenome editing and then interrogated for causal function by using genome editing to create isogenic cell lines. To validate this approach, we analyzed the 6q22.1 prostate cancer risk locus and identified rs339331 as the top scoring SNP.
Epigenome editing confirmed that rs339331 possessed regulatory potential. Using transcription activator-like effector nuclease (TALEN)-mediated genome-editing, we created a panel of isogenic 22Rv1 prostate cancer cell lines representing all three genotypes (TT, TC, CC) at rs339331. Introduction of the “T” risk allele increased transcription of the RFX6 gene, increased HOXB13 binding at the rs339331 region, and increased deposition of the enhancer-associated H3K4me2 histone mark at the rs339331 region. The cell lines also differed in cellular morphology and adhesion, and pathway analysis of differentially expressed genes suggested an influence of androgens. In summary, we have developed and validated a widely accessible approach to establish functional causality for non-coding sequence variants identified by GWAS.
INTRODUCTION
In contrast to Mendelian disorders, the vast majority of trait-associated common
polymorphisms are located in the non-protein coding genome1, with many GWAS variants falling within gene regulatory elements. Trait-associated polymorphisms are enriched for expression quantitative trait loci (eQTLs)2,3. Moreover, the primary ENCODE paper recently reported a substantial enrichment of GWAS variants in ENCODE defined regions4, and another large-scale study revealed that approximately 75% of all noncoding GWAS single nucleotide polymorphisms (SNPs), or their proxies, are within a defined DNase I hypersensitive site5. However, linkage disequilibrium (LD) and the lack of a genetic code for the non-protein coding genome make functional interpretation of trait-associated polymorphisms particularly vexing. Even in large-scale fine mapping studies, LD prohibits the unambiguous identification of causal variants.
Author Manuscript Author Manuscript Author Manuscript Author Manuscript
Genome and epigenome editing technologies provide ideal and powerful tools to assess the functional significance of polymorphisms in the endogenous human genome. Epigenome editing reagents, which induce targeted recruitment of enzymes or domains that modify gene expression, can be used to validate the regulatory potential of particular genomic sequences.
Genome editing nucleases including zinc fingers, TALENs and CRISPR/Cas constructs can be used to create isogenic series of disease-relevant cell lines representing the different genotypes of a candidate functionally causal risk SNP, enabling genotype-phenotype investigations in an identical and appropriate genetic background.
Despite the potential power of these technologies to address SNP causality, to our knowledge, no previously published study has used epigenome and/or genome editing methods to establish the functional significance of a non-coding variant identified through cancer GWA studies. A recent study used transcription activator-like effector nucleases (TALENs) to evaluate a variant correlated with fetal hemoglobin levels by deleting a 10-kb region harboring this SNP in intron-2 of the mouse Bcl11a gene. Although removal of this large sequence by non-homologous end-joining (NHEJ) repair significantly decreased BCL11A transcript and protein levels6, the deletion of such a large segment of DNA does not directly demonstrate the causal effect of the original polymorphism. Another study used nuclease-induced homology-directed repair (HDR) to characterize a regulatory mutation in a family for the rare autosomal recessive disorder, premature chromatid separation (PCS) syndrome7. However, these studies were not performed in a cellular context that is relevant for the actual disease; in addition, creation of the cell lines required a labor-intensive, two- step antibiotic selection method that is not amenable to higher-throughput use7.
Currently, no validated experimental pipeline has been described to establish the
mechanisms underlying risk SNPs despite repeated descriptions of the importance of such an approach in the published literature8–10. Here we describe the development and
validation of a fully integrated, end-to-end pipeline that we call CAUSEL, Characterization of Alleles USing Editing of Loci, which enables experimental establishment of the
functional causality of trait-associated variants. CAUSEL is comprised of five main steps:
fine mapping, epigenomic profiling, epigenome editing, genome editing, and phenotyping.
To demonstrate the feasibility of this concept, we evaluated the intronic prostate cancer risk locus located on chromosome 6q22.1 11. Our work establishes the causal function of a specific variant at this locus, and provides validation for the CAUSEL pipeline.
RESULTS
Overview of CAUSEL
To establish a general method for assessing the functional significance of non-coding SNP variants, we assembled a pipeline consisting of five main steps (Figure 1): (1) fine mapping to identify the range of candidate causal variants, (2) epigenomic profiling to narrow the field of candidate SNPs, (3) epignome editing to establish the regulatory potential of genomic regions bearing the variants, (4) homology-directed repair (HDR) induced by genome-editing nucleases combined with a barcoding screening strategy to create isogenic cell lines bearing the full range of potential genotypes, and (5) phenotypic analysis of the isogenic cell lines.
Author Manuscript Author Manuscript Author Manuscript Author Manuscript
Application to 6q22.1
To validate this method, we focused on a prostate cancer risk locus located on chromosome 6q22.1. This locus had been previously shown to have a strong correlation with prostate cancer and to act as an expression quantitative trait locus (eQTL) for RFX6 expression12. The presence of an eQTL and its target gene make a locus particularly attractive for genome editing because they provide a testable hypothesis for genome editing – modification of a causal (but not correlated) variant will alter transcript levels.
To identify the strongest candidate causal variants, fine mapping data was evaluated from over 35,000 individuals and 27 SNPs were identified 13 (Figure 2a; Supplementary Figs. 1a–
d and Supplementary Tables 1 and 2). All of these variants are strongly associated with prostate cancer risk and are genetically indistinguishable, with association P values within 1 order of magnitude (range: 1 × 10⁻¹⁶ to 2 × 10⁻¹⁷).
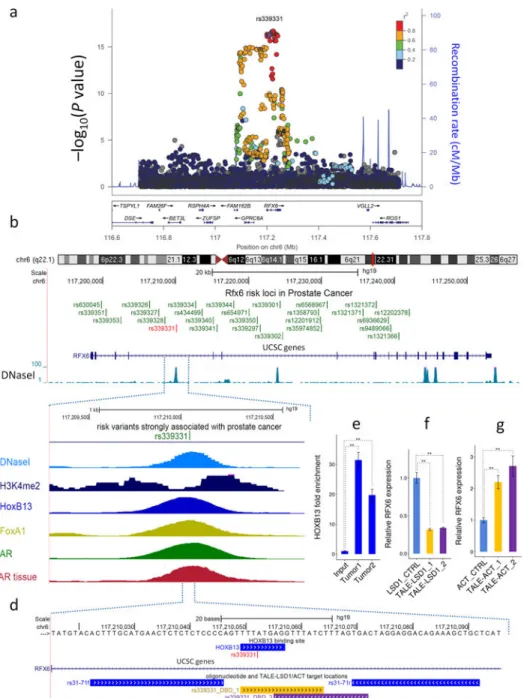
To further narrow the list of 27 candidate causal SNPs identified by fine mapping, we overlayed the genomic locations of these variants with epigenetic features in the LNCaP prostate cancer cell line obtained from publicly available databases and in primary prostate tumors. This analysis identified one SNP, rs339331, over the other 26 variants as having the highest likelihood of being functionally relevant (Fig. 2b,c). Of note, the “T” risk allele of rs339331 has been previously shown to create a binding site for the prostate lineage-specific HOXB13 transcription factor in prostate cancer cell lines12. We confirmed that HOXB13 binding occurs in primary human prostate tumors using chromatin immunoprecipitation followed by quantitative PCR (ChIP-qPCR). We observed strong enrichment of HOXB13 binding in two independent prostate tumor samples thereby demonstrating that this region is a bona fide HOXB13 binding site in human tissue (Methods; Fig. 2e).
To functionally test the hypothesis that rs339331 is located within an RFX6 regulatory sequence, we used targeted epigenome editing reagents. TALE-LSD1 fusion proteins consist of a programmable transcription activator-like effector (TALE) array, which can be
engineered to bind nearly any DNA sequence of interest14, fused to LSD1, a histone lysine- specific demethylase. Previous work has shown that TALE-LSD1 fusions can remove H3K4 methylation marks associated with enhancers and decrease their gene regulatory activities15. We designed two TALE-LSD1 fusions that overlapped the HOXB13 binding site that encompasses rs339331 (Fig. 2d). These two fusions significantly suppressed RFX6
transcript levels by three-fold in the LNCaP prostate cancer cell line (Fig. 2f). In a reciprocal experiment, we fused the same DNA-binding TALE repeat arrays from the TALE-LSD1 proteins to a VP64 transcriptional activation domain to create artificial TALE-activators16. Site-specific recruitment of VP64 to rs339331 resulted in a greater than two-fold increase in RFX6 expression (Fig. 2g). We obtained similar results when we performed these same experiments in 22Rv1, an independent prostate cancer cell line (Supplementary Fig. 2).
Taken together, these results suggest that the rs339331 site lies within a genomic region that can transcriptionally regulate expression of the target RFX6 gene.
Next, we used TALE nuclease (TALEN)-mediated HDR (Supplementary Fig. 3) to create a series of isogenic 22Rv1 prostate cancer cell lines each harboring one of the three rs339331 genotypes (the parental diploid 22Rv1 line harbors a heterozygous genotype of CT).
Author Manuscript Author Manuscript Author Manuscript Author Manuscript
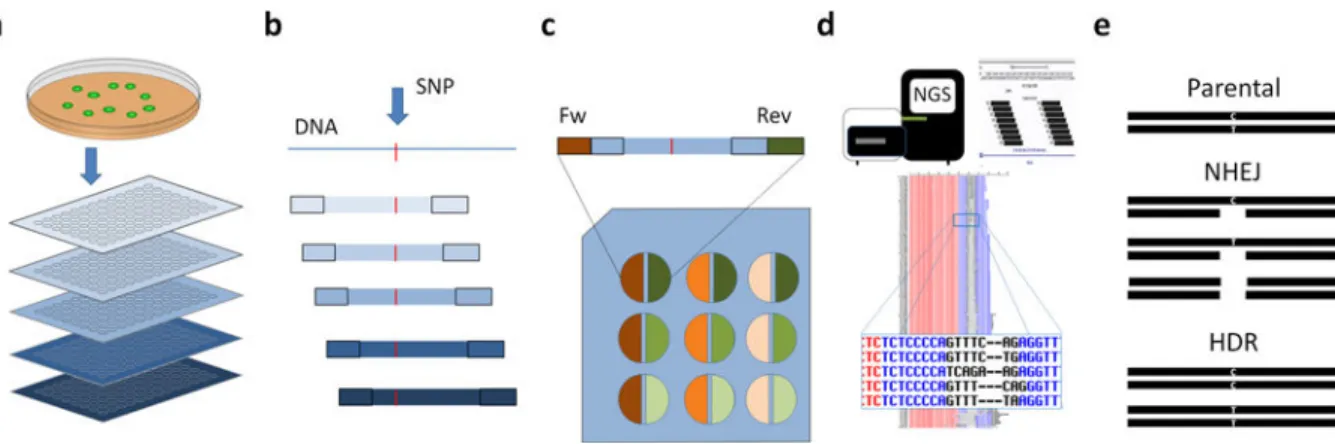
Because we found nuclease-induced HDR of the rs339331 locus to be a low frequency event in 22Rv1 cells, we developed a barcoding strategy that enabled us to both efficiently isolate single cell clones and sequence the target locus of thousands of clones at nucleotide resolution without the need for antibiotic resistance marker selection.
The method uses traditional barcoding for clones within a plate coupled with an amplicon shifting strategy resulting in each plate being tagged with a unique amplicon (Figure 3 and Supplementary Figs. 4 and 5). With this method, we analyzed 1,920 clones derived from two independent transfection experiments (960 clones from each) in one high-throughput sequencing lane (Methods). We obtained evaluable data for 1,832 clones, of which 407 retained the heterozygous status of the parental line. Thus, the percentage of single cells bearing at least one mutated rs339331 allele was 78% (1,425/1,832) (Fig. 4c and Methods).
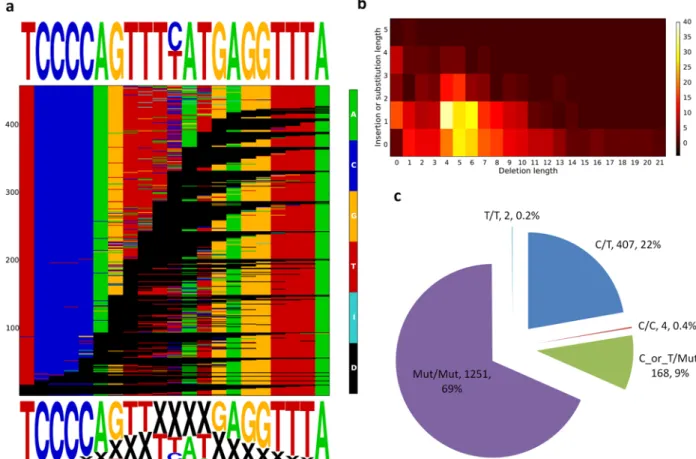
Among these mutations, we identified 459 distinct alleles that were generated by this TALEN pair (Methods; Fig. 4a,b; Supplementary Table 3) with variable-length deletions most likely induced by mutagenic non-homologous end-joining (NHEJ)-mediated repair17,18. The percentage of single cell clones with homozygous alleles at rs339331 (created by induction of one of the two desired HDR-mediated alterations in one allele) was 0.2% for the TT clones and 0.4% for the CC clones: 2/916 clones bearing TT (mediated by HDR with the donor template used to create the “T” allele) and 4/916 clones bearing CC (mediated by HDR with the donor template used to create the “C” allele) (Fig. 4c).
To assess the phenotypic impacts of rs339331 alteration, we first examined expression of the RFX6 target gene in the isogenic 22Rv1 prostate cancer cell lines (Fig. 5a). Baseline RFX6 expression variability measured in 20 unmodified 22RV1 cell clones (CT heterozygous at rs339331) showed consistent levels of expression (Supplementary Fig. 6). By contrast, RFX6 transcript levels were significantly altered in the isogenic modified cell lines: in two independent clones bearing homozygous TT risk alleles, RFX6 expression was significantly increased relative to the parental, heterozygous (CT) parental line, while two independent clones bearing homozygous CC protective alleles showed decreased RFX6 expression (Fig.
5b). We measured the allelic ratio of RFX6 mRNA levels in the TT and CC homozygous cell clones to further examine the impact of rs339331 genotypes on RFX6 gene expression.
Using another SNP, rs12202378, located in intron 12 of RFX6 (r2 with rs339331 = 0.97) as a marker to distinguish between allelic transcripts, we observed that the allelic mRNA ratio was balanced at rs12202378 for cell lines homozygous (TT or CC) at rs339331 but was imbalanced for the parental, heterozygous cell line (Fig. 5c,d). Not unexpectedly, in 22Rv1 cell clones bearing variable-length NHEJ-induced deletions, which presumably disrupt HOXB13 binding, we also observed downregulated expression of RFX6 (Supplementary Fig. 7a). To further substantiate the role of this region in a second independent cell line, we also performed genome editing of the hypotetraploid LNCaP prostate cancer cell line, which carries only the “T” allele at rs339331. Nine independent cell clones each carrying a variable-length NHEJ-mediated deletion all showed decreased RFX6 transcript levels (Supplementary Fig. 7b). Taken together, these results demonstrate that introduction of a
“T” risk allele at rs339331 causes increased RFX6 expression while introduction of a “C”
protective allele results in decreased RFX6 expression.
Author Manuscript Author Manuscript Author Manuscript Author Manuscript
We next used ChIP-qPCR to interrogate the state of regulatory epigenetic marks across the CC, CT, and TT genotypes in our isogenic 22Rv1 cell lines. Consistent with the gene expression data, we found that both the HOXB13 transcription factor occupancy and the H3K4me2 post-translational histone modification characteristic of enhancers were higher in the TT clones compared to the TC and CC clones at the rs339331 locus (Fig. 5e,f). ChIP- qPCR in the parental, heterozygous cell line confirmed this observation for HOXB13 (as previously shown)12 and H3K4me2 by demonstrating greater binding to the T variant than the C allele (Supplementary Fig. 8a,b).
We next assessed if there are phenotypic differences relevant to cancer among the three isogenic 22Rv1 cell lines. Homozygous TT and parental TC cells displayed a mesenchymal- type morphology, whereas CC clones were rounder with a regular cobblestone morphology, and formed tight colonies more typical of normal, untransformed epithelial cells (Fig. 6a).
Because changes in cell shape can indicate a difference in the expression of proteins involved in cell-cell and cell-matrix interactions, we performed assays to test the ability of cells to adhere to collagen and plastic. TT clones adhered significantly more readily to both substrates than the CC clones (Fig. 6b). In contrast to a previous report, where modulation of RFX6 expression by shRNAs and siRNAs affected cell proliferation, invasion and
migration12, we did not detect any significant differences in these phenotypes with respect to genotype (Supplementary Fig. 9).
To assess the impact of rs339331 alteration on global gene expression, we profiled the transcriptomes of the isogenic cell lines (both CC clonal lines (N=2), both TT clonal lines (N=2), and the parental 22Rv1 lines (N=2) using RNA sequencing (RNAseq) followed by validation of selected differentially expressed genes by qRT-PCR (Supplementary Fig. 10a).
Principal component analysis of the data showed that independent biological replicates clustered together according to genotype (Supplementary Fig. 10b). One hundred and fifty three genes were differentially expressed in the CC cell lines compared to the parental TC cells, and 43 genes were differentially expressed in the TT cell lines compared to the parental TC cells (Fig. 6c and Supplementary Table 4). This is consistent with the greater phenotypic similarities we observed between the parental cell lines and homozygous TT clones. Ingenuity Pathway Analysis using the differential gene set identified between the CC and TT cell lines highlighted androgenic compounds and the androgen receptor as predicted upstream regulators of gene expression changes (P value for AR=8.2×10⁻⁵, CC v TT, Fig.
6d). These data connect androgen signaling and RFX6 expression levels and are consistent with the observation of androgen receptor (AR) binding at rs339331 (Fig. 2c).
DISCUSSION
This work describes and validates an integrated pipeline to establish functional causality of non-protein coding variants derived from GWAS. This strategy includes multiple tools and technologies, some novel and some that have been previously described by our groups and others. However, our study is the first to describe the successful integration of all of these steps into a single validated pipeline for the systematic and comprehensive evaluation of the impact of genotype on phenotype.
Author Manuscript Author Manuscript Author Manuscript Author Manuscript
We selected the previously identified 6q22 prostate cancer risk locus to demonstrate proof- of-concept of this pipeline11. Previous work from others showed that this locus was an established eQTL for RFX6 expression and that suppression of RFX6 levels resulted in alterations in proliferation, migration, and invasion12. Although this earlier study had shown that the T risk allele induced stronger binding of HOXB13 in prostate cancer cell lines, it did not provide proof of direct causality on RFX6 expression 12. By contrast, we used the CAUSEL pipeline to move beyond correlation and to show HOXB13 binding in vivo in primary human prostate tumors and to prove functional causality of rs339331 on RFX6 target gene expression, on induction of cellular phenotypic alterations, and on global transcriptional changes that link androgen receptor signaling with RFX6 expression. Our observation of somewhat different cellular phenotypic effects than the earlier report may be attributable to our use of genetic modification of an endogenous SNP allele on RFX6 expression as opposed to the shRNA and siRNA-based suppression approach used in the previous study12. This difference in phenotypic outcomes reinforces the importance of performing true genetic analysis rather than using other techniques such as shRNA that do not necessarily correctly recapitulate the phenotypic impacts of sequence variation.
Although our initial validation of the CAUSEL pipeline used TALENs, any of the various genome-editing nucleases, including CRISPR-Cas9 nucleases, ZFNs or meganucleases, can be used to create isogenic cell lines. We used TALENs because this was the platform of choice at the time we initiated this work, but we are currently using CRISPR-Cas9 nucleases in our on-going studies. The choice of which genome editing platform to use will depend on many factors, including the specific experimental question, the cell type, the locus being modified, desired ease of use, and the intrinsic design constraints of the genome editing reagents. Similarly, although we used engineered TALEs to direct LSD1 or transcriptional activation domains to specific loci, the epigenome editing component of CAUSEL might also be practiced using engineered zinc finger arrays or catalytically inactive Cas9.
An important consideration for experiments that use genome-editing nucleases to create isogenic cell lines is the potential for confounding off-target mutations19. This possibility exists regardless of the specific genome-editing nuclease platform used. Although we and others have shown that TALENs can induce off-target mutations20,21, we believe it is unlikely that our results are confounded by such effects because the same TALEN pair was used to create the homozygous “T” and “C” lines, which in turn showed different but consistent effects on RFX6 expression in more than one cell clone. Users of the CAUSEL pipeline need to be aware of the possibility for off-target mutations and to design their experiments appropriately. Although genome-wide methods for determining off-target effects of nucleases are beginning to be described in the literature22–25, these approaches are likely not necessary if appropriate control experiments are performed as we have done in this report.
The barcoding-based single cell screening approach that we developed for clonal genotyping should provide an important and broadly useful tool for genome editing projects. This method is flexible with respect to scale and can be used with any genome editing platform.
For our experiments, the frequency of obtaining cells bearing HDR of one allele and not having an NHEJ-induced indel mutation in either allele was very low and necessitated a
Author Manuscript Author Manuscript Author Manuscript Author Manuscript
screen that enabled high-throughput genotyping. We envision that for many other similar experiments performed with the CAUSEL pipeline, the rate of obtaining desired HDR- modified cell clones will be low because: NHEJ-mediated repair can efficiently introduce unwanted indel mutations; and because the strategy of introducing additional mutations that prevent re-cleavage of the locus following successful HDR modification cannot be easily adapted to non-coding loci. However, even for genome editing experiments with higher rates of desired modifications, we believe that our screening approach will provide an economical and comprehensive method for genotyping cell clones; for example, enabling the pooling of multiple editing experiments into a single sequencing run.
In summary, this strategy provides an important blueprint for addressing the causal
significance of the numerous trait-associated non-protein coding variants that have been and will continue to be identified. As the field advances, larger screens across multiple cell types and loci and in vivo modeling to characterize the role of inherited variation in disease development will continue to unravel the underlying biology of human traits. Thus, we envision that the CAUSEL approach will be of wide utility to the GWAS research community.
Methods
Fine Mapping
We combined data from studies with existing high-density SNP genotyping in prostate cancer GWAS in the following populations: European ancestry [8,600 cases and 6,946 controls from the Cancer of the Prostate in Sweden (CAPS)26, Breast and Prostate Cancer Cohort Consortium (BPC3)27,28 African ancestry [5,327 cases and 5,136 controls from the African Ancestry Prostate Cancer GWAS Consortium (AAPC)29 and the Ghana Prostate Study]30; Japanese ancestry [2,563 cases and 4,391 controls from GWAS in Japanese in the Multiethnic Cohort (MEC)]11,31,32 and Latino ancestry [a GWAS of 1,034 cases and 1,046 controls from the MEC]31. Details of each study are provided in Supplementary Tables 1 and 2. Genotyping the samples from each study was performed using Illumina or Affymetrix GWAS arrays and quality control procedures of each GWAS have been described
previously and the citations are provided in Supplementary Table 2. Imputation was performed in each study using a cosmopolitan reference panel from the 1000 Genomes Project (1KGP; March, 2012). Across each region, genotyped SNPs, imputed SNPs, and insertion/deletion variants ≥1% frequency were examined for association with prostate cancer risk. SNPs with an imputation r2 (‘info score’)33 less than 0.3 were not tested for association. Plots for Fig. 2a and for Supplementary Fig. 1 were created by the LocusZoom program (http://locuszoom.sph.umich.edu/locuszoom/)34
Cell Culture
22RV1 and LNCaP prostate cancer cell lines were requested from ATCC and cultivated in RPMI-1640 containing 10% FBS and 1% pen/strep (Life Technologies), unless otherwise indicated. TrypLE Express Enzyme (LifeTechnologies) was used to detach cells from tissue culture plastics. All cell cultures were incubated at 37°C with 5% CO2. Cells were passaged a maximum of 20 times. Mycoplasma contamination was checked at least once in a month
Author Manuscript Author Manuscript Author Manuscript Author Manuscript
(LookOut Mycoplasma PCR Detection Kit (Sigma-Aldrich). 22Rv1 and derivative lines were authenticated by profiling short tandem repeats using the Promega PowerPlex16HS Assay (at the University of Arizona Genomics Core).
Plasmid Construction
TALE binding sites were identified using ZiFiT Targeter Version 4.2 (http://
zifit.partners.org/ZiFiT) and were designed to target the rs339331 locus (Supplementary Fig.
3). All the TALE arrays were assembled using FLASH protocol as previously
described17,35. Assembled TALEs were cloned into FokI nuclease, LSDI, or VP64 activator expression vector respectively using BsmBI restriction site. XL1-Blue chemically competent cells (Agilent) were transformed with plasmids and verified by colony PCR and Sanger sequencing.
Transfection
22RV1 or LNCaP cells were plated the day before transfection, to reach 70–80% confluency at the time of transfection. 1 × 10⁶ and 0.4 × 10⁶ cells per transfection were collected, for each cell line respectively. Cells were transfected with 1 μg of TAL nuclease or TALE effector or control empty vector plasmid DNA by nucleofection with SF Cell Line 4D- Nucleofector™ × Kit (Lonza) using 20 μl Nucleocuvette™ Strips, as described by the manufacturer (Program EN120 and EN150). Cells were immediately resuspended in 100 μl culturing media and plated into 1.5 ml pre-warmed culturing media in 24 well tissue culture plate. The T7E1 assay, gene expression assays or single cell cloning were performed 72h post nucleofection.
ssODN mediated HDR
Ultramers (200 bp sense containing either C or T allele) were ordered from IDT and diluted (10μM). Primer sequences are listed in Supplementary Table 5. One μg TALEN pairs were cotransfected with 50 pM oligo. Two independent experiment was performed the C and the T allele changes. Cells were single cell cloned after regeneration. While this study used a 200 base pair donor oligo, we note that other studies have shown that shorter donor oligos also can be used to modify DNA sequences36.
Single Cell Cloning
Cells were plated 3 days after transfection into 20% FBS containing RPMI-1640 media with 1000 cells per 10 cm dish. After 14–21 days, when the formed colonies can be distinguished by eye, the colonies were scraped by pipet tips using a 10× super magnifier. Each colony was placed into a well of 384 tissue culture plate (Corning). Colonies were washed and suspended into 20 μl serum-free RPMI-1640 medium. 20 μl TrypLE™ Select 10× reagent was added to each well and incubated at room temperature for 10 minutes. The reagent was quenched by 40μl 20% FBS containing RPMI-1640 media. After vigorous shaking and a brief centrifugation at 1000g the plate was incubated for 3 days to regenerate colonies. The media was changed two times per week on the plates. The colony names referred to in Figs.
3 and 4 were created according to the following parameters: “genotype_plate number/well ID”.
Author Manuscript Author Manuscript Author Manuscript Author Manuscript
Cell lysis and PCR amplification of region of interest - Template generation by direct PCR for T7E1 assay and sequencing
The goal of this step was to continue to allow the processing of the clones in an efficient manner without having to perform DNA extraction for each well.
Phire Tissue Direct PCR Master Mix (Thermo Scientific) was used according to our optimized protocol. Briefly, after media removal cells were detached by adding 20 μl TrypLE™ Select 10× (LifeTechnologies) for 10 minutes at room temperature. The reaction was quenched by 40μl 20% FBS containing RPMI-1640 media. Samples were mixed well and 30 μl of cell suspension transferred into a 384 well PCR plate. Cells were pelleted by centrifugation for 10 minutes at 3000g, and the supernatant removed. Cells were then suspended in 20 μl lysis buffer (950 μl lysis buffer + 50 μl DNA release solution) and denatured for 5 min at 99°C.
A premix sufficient for 192 reactions in 6 μl final volume and 500 nM final primer concentration per each was prepared allowing for a 1× reaction mix after added DNA template. Five μl premix was dispensed into each well and 1 μl cell lysate was added. The amplification was performed under the following thermal profile: ([98 °C, 2 min], [98 °C, 10 s; 65–60 °C, −0.5 °C/cycle, 10 s; 72 °C, 20 s]10 cycles, [98 °C, 10 s; 62 °C, −1 °C/cycle, 10 s; 72 °C, 20 s]25 cycles, [72 °C, 2 min]). PCR products were used for either T7E1 assay or sequencing.
T7E1 assay
TALEN cleavage efficiency was assayed. gDNA was isolated from TALEN treated cells according to Agencourt gDNA isolation protocol. 500bp amplicons including the TALEN target site were generated using appropriate primers. PCR products were purified by Ampure XP (Agencourt) magnetic beads according to the manufacturer’s instructions and quantified by nanodrop. 500 ng of purified PCR product was denatured and reannealed in 1×
NEBuffer 2.1 (New England Biolabs) using the following protocol: 95 °C, 5 min; 95–85 °C at −2 °C/s; 85–25 °C at −0.1 °C/s; hold at 4 °C. Hybridized PCR products were treated with 10 U of T7 Endonuclease I at 37 °C for 30 min in a reaction volume of 30 μl. Reactions were stopped by the addition of 2 μl 0.5 M EDTA, purified with Ampure XP magnetic beads. The fragments were visualized by agarose gel electrophoresis or quantified by 2100 Agilent Bioanalyzer.
Gene expression analysis
RT-PCR—Total RNA was isolated using RNeasy Mini Kit (Qiagen). 500 ng total RNA was reverse transcribed using High Capacity Reverse transcription kit (LifeTechnologies).
cDNA was diluted (20×) and RT-PCR was performed using 2× LC480 SYBR Green Master Mix (Roche) and Light Cycler 480 (Roche) instrument. Primer sequences are listed in (Supplementary Table 5) Relative gene expression was calculated based on ddCT method.
Each sample was measured by three biological and technical replicates. The ALAS1 gene was used as a housekeeping gene to normalize the samples. Expression values determined by quantitative RT-PCR were compared between the genotypes using two-tailed Student’s
Author Manuscript Author Manuscript Author Manuscript Author Manuscript
test. The analysis was performed in the R-environment (The Statistical R Core Team, 2014)37.
RNA-sequencing and analysis—RNAseq was performed at the USC Epigenome Centre Core Facility. Libraries were prepared from 0.5μg total RNA using the Illumina TruSeq Sample Prep kit (with polyA selection), barcoded and six samples multiplexed for sequencing on the Illumina NextSeq 500, with 75bp paired-end reads. Data analysis was performed using Partek Flow and Partek Genomics Suite software. Using Tophat2 RNAseq reads were mapped to hg18 and annotated using Gencode v20. Differential gene expression analyses (GSA) were performed to identify genes differentially expressed between parental, TT and CC samples.
Measure of Allelic Imbalance
PCR products were generated from gDNA, ChIP DNA and heteronuclear cDNA and Sanger sequenced at DFCI-MBCF Core facility.
Chromatin immunoprecipitation (ChIP)
ChIP was performed after crosslinking 5~10 × 106 22RV1 cells with 1% formaldehyde in 15 ml PBS at room temperature for 10 min, cells were then rinsed with ice-cold PBS twice and collected in RIPA buffer (0.1% SDS, 1% Triton X-100, 10 mM Tris pH 7.4, 1 mM EDTA, 0.1% Na Deoxycholate, 0.25% N-Lauroylsarcosine, 1 mM DTT (suppliers)) with 0.3 M NaCl and protease inhibitor (Roche). Chromatin was sonicated to 300–800 bp and centrifuged at 13,000 rpm for 10min at 4°C. 6 ug antibodies (Anti-dimethyl-Histone H3 (Lys4) Antibody: 07-030, Emd Millipore; HOXB13 Antibody (H-80): sc-66923, Santa Cruz) were incubated with 30μl Dynabead Protein A/G (Invitrogen) for at least 3hrs before immunoprecipitation with the sonicated chromatin overnight. Chromatin was washed with RIPA, then with with 0.3 M NaCl and LiCl wash buffer (0.25 M LiCl, 0.5% NP-40, 0.5%
Na Deoxycholate, 1 mM EDTA, 10 mM Tris pH8.1) twice for 10 min sequentially. After rinsing with TE buffer twice, immunoprecipitated chromatin in elution buffer (1% SDS, 1 mM EDTA, 5 mM Tris pH 8.1) was treated with Proteinase K for 6~12 hrs at 65°C with gentle rocking. After RNase A treatment at 37°C for 30min, ChIP DNA was quantified by Quant-iT TM dsDNA HS assay kit (Invitrogen). Quantification of target regions present in ChIP and input samples was achieved by quantitative PCR using the specific primers as listed in Supplementary Table 5. qPCR was performed using the Light cycler 480 SYBR Green I master mix (Roche) and run on the Roche Light cycler 480. Results are represented as mean ± SD for replicate samples. Data are representative of three independent
experiments. Fold enrichment was calculated based on the ddCt method and the geometric mean of three housekeeping genes was used (primers are listed in Supplementary Table 5).
HOXB13 ChIP-qPCR on the two prostate tumors—Using a 2mm2 core needle, approximately three cores were extracted from the areas circled on an H&E slide. The frozen cores were pulverized using the Covaris CryoPrep system (Covaris, Woburn, MA).
The tissue was then fixed using 1% formaldehyde buffer for 18 minutes and quenched with glycine. Chromatin was sheared to 300–500 base pairs using the Covaris E220 ultra- sonicator. The resulting chromatin was incubated overnight with 6ug antibody—HOXB13
Author Manuscript Author Manuscript Author Manuscript Author Manuscript
(H-80, Santa Cruz Biotechnology, Dallas, TX),—bound to protein A and protein G beads (Life Technologies, Carlsbad, CA). A fraction of the sample was not exposed to antibody to be used as control (input). The samples were de-crosslinked, treated with RNase and proteinase K, and DNA was extracted. PCR reactions were performed as described in the paragraph above and the primer sequences are in Supplementary Table 5. These samples were from the IRB approved protocol #01-045 at the Dana-Farber Cancer Institute.
Amplicon sequencing and genotyping analysis pipeline
We developed a high throughput sequencing strategy using amplicon sequencing and a novel multiplexing strategy for the screening and genotyping of about 2,000 samples at the nucleotide level. The primary goal was to establish a “3 dimensional” indexing strategy – each colony was uniquely identified by a well number (determined by a specific
combination of 16 forward primers and 12 reverse primers) and a plate number (determined by an amplicon that is unique to each plate as shown in Supplementary Figs. 4 and 5).
Within each plate, a conventional barcoding method was performed allowing colony identification based on the barcode combinations. For example, colonies in well A1 across all plates will have the same forward and reverse primer barcodes. The plates are further distinguished by different amplicons. All of the amplicons interrogate the region around rs339331 (referred to as the core region), however they are uniquely identified by shifting the starting position by some number of basepairs (for these data, we shifted most of the amplicons by 3 bp) relative to the other amplicons (Supplementary Fig. 5a). Samples from each plate were pooled in equimolar amounts. The 16 and 12 forward and reverse primers allowed us to identify 192 sample groups that were then further separated based on the 10 amplicons by locating the position of the unique 6 bp identifier segment (in this case
“TGTACA”) that was included in amplicons (Supplementary Fig. 5). Thus, this strategy allowed for genotyping of 16 × 12 × 10=1920 samples in a single sequencing run.
Amplicon sequencing—A three-step PCR procedure was performed to generate a Mi- Seq-compatible library for amplicon sequencing (Supplementary Figs. 4 and 5) (Primer sequences are in Supplementary Table 5).
First step PCR – The goal for this first PCR is to amplify region of interest by gene specific primers to create an amplicon that will serve as a template for the second PCR. In a 6μl final volume per sample, F and R primers were added at 0.4 uM final concentrations, and a 960 bp amplicon was generated by direct touchdown PCR. 3 μl reaction products were
visualized by agarose gel electrophoresis using a 1% TBE agarose gel. One μl PCR product was diluted in 200 μl molecular biology grade distilled water (LifeTechnologies) for use as template in the second PCR.
Second step PCR – the goal of this step was to generate PCR products with adapter sequences adapter PCR to generate shifted amplicons (most of the amplicons were shifted by three bps). Ten PCR primer pairs were designed against the RFX6 reference sequence to interrogate the rs339331 locus (illustrated in Supplementary Fig. 5a). PCR reactions were set up in 6 μl final volume by adding 2× Phusion High-Fidelity PCR Master Mix, 0.4 uM forward and reverse primer mix and 1 μl diluted template from the first PCR. Touchdown
Author Manuscript Author Manuscript Author Manuscript Author Manuscript
PCR was performed using the following thermal profile: ([98 °C, 2 min], [98 °C, 10 s; 65–
60 °C, −0.5 °C/cycle, 10 s; 72 °C, 20 s]10 cycles, [98 °C, 10 s; 62 °C, −1 °C/cycle, 10 s; 72
°C, 20 s]25 cycles, [72 °C, 2 min]). One μl PCR product was diluted in 200 μl molecular biology grade distilled water (LifeTechnologies) and used as the template for the barcoding reaction.
Third step PCR – generatation of Mi-Seq compatible barcoded amplicons. Forward (N=16) and reverse (N=12) HPLC purified barcode tagged adapter specific oligonucleotides were diluted and mixed in equimolar ratio to yield a 2uM final concentration, resulting in a total of 192 combinations. PCR reactions were set up in 10 μl final volume by adding 2× Phusion High-Fidelity PCR Master Mix, 0.2 uM forward and reverse primer mix and 1 μl diluted template. Two step PCR (i.e., the annealing and extension steps used the same temperature) was performed using the following thermal profile: ([98 °C, 2 min], [98 °C, 10 s; 72 °C, 20 s]25 cycles, [72 °C, 2 min]).
The presence of the product was analyzed by agarose gel electrophoresis on 1% TBE agarose gel. The 192 barcoded samples were pooled and purified using QIAquick PCR Purification Kit (Qiagen). Library QC and 75PE Mi-Seq amplicon sequencing was performed in the DFCI-MBCF Core Facility.
Library QC analysis
The size of the final pooled amplicon libraries was assessed on the TapeStation 2200 (Agilent Technologies) and quantified using the Library Quantification Kit for Illumina (Kapa Biosystems). The pooled libraries were denatured and diluted to 12 pM according to the standard Illumina protocol and paired-end 75bp reads were sequenced on the MiSeq (Illumina).
Data processing of high-throughput amplicon sequencing data
Two demultiplexing steps were used to uniquely distinguish the sequence of each clone.
First, data were demultiplexed using the configureBclToFastq.pl script in the cassava-1.8.2 software package (Illumina) with no mismatches allowed in the index read and otherwise default settings resulting in 192 FASTQ files were generated according to the 16 forward and 12 reverse barcode combinations (Supplementary Table 5). Second, each FASTQ file contained sequences from an identical well position and the plate identity was determined by the position of the “TGTACA” identifier segment within the sequence (Supplementary Fig.
5a). Approximately 2.7% of reads did not have the TGTACA identifier sequence at the expected position and these reads were discarded. In addition, any read containing a base with a quality score, Q < 30 was discarded. After these filtering steps, a total of 10.9 million reads were used for further evaluation. Clones containing fewer than a total of 40 reads were discarded (N=40) leaving 1,880 (1,920–40) clones for sequence variant characterization.
Sequence variant characterization and genotyping
On average, each clone had 5,797 reads (10.9 million/1,880 clones). The unix command, uniq, allowed the identification of unique sequences that were present for each clone. These unique sequences were then tallied using another series of commands. From the total reads,
Author Manuscript Author Manuscript Author Manuscript Author Manuscript
we selected the two most abundant sequences in each sample. If the two most abundant sequences comprised at least 80% of the total number of reads, the clone was considered pure, i.e., not polyclonal. Next, the 21 basepair core region (Supplementary Figure 5a) was used to assign each of the two sequences into three possible groups (C, T, or Mut). If the sequence matched the 21 base pair string, ‘TCCCCAGTTTCATGAGGTTTA’ (the underlined base is the C/T SNP at rs339331), it was called as a ‘C’ allele; if the sequence matched the ‘TCCCCAGTTTTATGAGGTTTA’ string, it was called as a ‘T’ allele. If the sequence did not match either, it was categorized as ‘Mut’. At the end of this step, each clone is assigned to one of the following six possibilities – ‘T/T’, ‘C/C’, ‘T/C’, ‘T/Mut’, ‘C/
Mut’, ‘Mut/Mut’. At this step, we still do not know the nucleotide sequence of the ‘Mut’
alleles and ‘Mut’ can result from a substitution, insertion, or deletion.
To characterize the actual alleles at the nucleotide level, we used the BLAST algorithm to align each of the top two sequences for each clone against a 141 bp region of the RFX6 region, which was considered as the reference sequence (Supplementary Fig. 5a). After this initial alignment, we focused specifically on the 21 basepair core region that is in common to all amplicons (the yellow highlighted sequence in Supplementary Fig. 5a) and alleles were called only if they occurred in this region. Based on this pipeline, we identified a total of 459 individual allele variants (Fig. 2a) resulting from NHEJ- and HDR- nuclease-induced modifications (Supplementary Table 3).
All scripts for processing and analyzing the sequencing data are available by contacting the corresponding authors.
Variant visualization
The weblogo tool (http://weblogo.berkeley.edu/logo.cgi) (Fig. 4a) was used to visualize the distribution and frequency of deletions in our dataset. The heatmap in Figure 4b was created based on all of the identified alleles (N=459) with certain deletion length; and the number of other alteration (base substitution or insertion resulted by NHEJ) and their combinations.
The heatmap shows the distribution and correlation of the number of altered and deleted positions (Fig. 4b). The pie chart shows the distribution of certain genotype categories, including; C/T (parental/unmodified); C_or_T / Mut (one chromosome altered); Mut/Mut (both chromosomes altered); C/C or T/T (recombinant). Mut means that the sequence differs from the parental including (deletions, insertions and substitutions) (Fig. 4c).
Adhesion assays
Cells were normalized to 0.3×10⁶ cells/ml and applied to 96 well plates uncoated or coated with collagen IV (Sigma Aldrich). After 45 minutes wells were extensively washed with PBS and fixed for 10 mins with 100% ice cold methanol (VWR). Wells were washed again with PBS and stained for 10 minutes with 5mg/ml crystal violet (Sigma Aldrich) in 2%
ethanol. Stained cells were extensively washed with PBS then water, lysed in 2% SDS and absorbance at 590nm read using a microplate reader (Microwin).
Author Manuscript Author Manuscript Author Manuscript Author Manuscript
Statistical analyses
No specific statistical method was used to determine sample size for the gene expression and ChIP data. RFX6 expression measurements were determined by quantitative RT-PCR and were compared across genotypes using the unpaired two-tailed Student’s t-test. Fold enrichments for ChIP were determined by quantitative PCR and P values were determined using the unpaired two-tailed Student’s t-test. For the cell-based adhesion assay, absorbance data were normalized to the parental genotype and statistical comparisons were made using the unpaired two-tailed Student’s t-test. The analyses were performed in R-environment37. No samples were excluded during the analysis.
Supplementary Material
Refer to Web version on PubMed Central for supplementary material.
Acknowledgments
M.L.F. and J.K.J. were supported by NIH R01 GM107427; J.K.J. was supported by an NIH Director’s Pioneer Award (DP1 GM105378) and The Jim and Ann Orr MGH Research Scholar Award; M.L.F. is supported by the Prostate Cancer Foundation (Challenge Award), R01CA193910, and the H.L. Snyder Medical Foundation. The scientific development and funding for this project were in part supported by the US National Cancer Institute GAME-ON Post-GWAS Initiative (U19CA148112 and U19CA148537). K.L. is supported by a K99/R00 grant from the National Cancer Institute (Grant number 1K99CA184415-01). I.C. is supported by KMR-12-1-2012-0216 and OTKA103244. Z.S. is supported by the Breast Cancer Research Foundation. This project was also supported by a Program Project Development Grant from the Ovarian Cancer Research Fund (S.A.G).
We thank the DFCI-MBCF Core Facility for Sanger sequencing and Illumina high-throughput sequencing. We thank Charles Nicolet at the USC Epigenome Center Core for RNA-Seq services and Meng Li at USC NML Bioinformatics Center.
References
1. Hindorff LA, et al. Potential etiologic and functional implications of genome-wide association loci for human diseases and traits. Proc Natl Acad Sci U S A. 2009; 106:9362–9367. [PubMed:
19474294]
2. Cookson W, Liang L, Abecasis G, Moffatt M, Lathrop M. Mapping complex disease traits with global gene expression. Nat Rev Genet. 2009; 10:184–194. [PubMed: 19223927]
3. Nicolae DL, et al. Trait-associated SNPs are more likely to be eQTLs: annotation to enhance discovery from GWAS. PLoS Genet. 2010; 6:e1000888. [PubMed: 20369019]
4. An integrated encyclopedia of DNA elements in the human genome. Nature. 2012; 489:57–74.
[PubMed: 22955616]
5. Maurano MT, et al. Systematic localization of common disease-associated variation in regulatory DNA. Science. 2012; 337:1190–1195. [PubMed: 22955828]
6. Bauer DE, et al. An erythroid enhancer of BCL11A subject to genetic variation determines fetal hemoglobin level. Science. 2013; 342:253–257. [PubMed: 24115442]
7. Ochiai H, et al. TALEN-mediated single-base-pair editing identification of an intergenic mutation upstream of BUB1B as causative of PCS (MVA) syndrome. Proc Natl Acad Sci U S A. 2014;
111:1461–1466. [PubMed: 24344301]
8. Albert FW, Kruglyak L. The role of regulatory variation in complex traits and disease. Nat Rev Genet. 2015; 16:197–212. [PubMed: 25707927]
9. Knight JC. Approaches for establishing the function of regulatory genetic variants involved in disease. Genome Med. 2014; 6:92. [PubMed: 25473428]
10. Hsu PD, Lander ES, Zhang F. Development and applications of CRISPR-Cas9 for genome engineering. Cell. 2014; 157:1262–1278. [PubMed: 24906146]
Author Manuscript Author Manuscript Author Manuscript Author Manuscript
11. Takata R, et al. Genome-wide association study identifies five new susceptibility loci for prostate cancer in the Japanese population. Nat Genet. 2010; 42:751–754. [PubMed: 20676098]
12. Huang Q, et al. A prostate cancer susceptibility allele at 6q22 increases RFX6 expression by modulating HOXB13 chromatin binding. Nat Genet. 2014; 46:126–135. [PubMed: 24390282]
13. Han Y, et al. Integration of multiethnic fine-mapping and genomic annotation to prioritize candidate functional SNPs at prostate cancer susceptibility regions. Hum Mol Genet. 2015 14. Joung JK, Sander JD. TALENs: a widely applicable technology for targeted genome editing. Nat
Rev Mol Cell Biol. 2013; 14:49–55. [PubMed: 23169466]
15. Mendenhall EM, et al. Locus-specific editing of histone modifications at endogenous enhancers.
Nat Biotechnol. 2013; 31:1133–1136. [PubMed: 24013198]
16. Maeder ML, et al. Robust, synergistic regulation of human gene expression using TALE activators.
Nat Methods. 2013; 10:243–245. [PubMed: 23396285]
17. Reyon D, et al. FLASH assembly of TALENs for high-throughput genome editing. Nat Biotechnol. 2012; 30:460–465. [PubMed: 22484455]
18. Kim Y, Kweon J, Kim JS. TALENs and ZFNs are associated with different mutation signatures.
Nat Methods. 2013; 10:185. [PubMed: 23396284]
19. Joung JK. Unwanted mutations: Standards needed for gene-editing errors. Nature. 2015; 523:158.
[PubMed: 26156364]
20. Guilinger JP, et al. Broad specificity profiling of TALENs results in engineered nucleases with improved DNA-cleavage specificity. Nat Methods. 2014; 11:429–435. [PubMed: 24531420]
21. Hockemeyer D, et al. Genetic engineering of human pluripotent cells using TALE nucleases. Nat Biotechnol. 2011; 29:731–734. [PubMed: 21738127]
22. Kim D, et al. Digenome-seq: genome-wide profiling of CRISPR-Cas9 off-target effects in human cells. Nat Methods. 2015; 12:237–243. 231 p following 243. [PubMed: 25664545]
23. Wang X, et al. Unbiased detection of off-target cleavage by CRISPR-Cas9 and TALENs using integrase-defective lentiviral vectors. Nat Biotechnol. 2015; 33:175–178. [PubMed: 25599175]
24. Tsai SQ, et al. GUIDE-seq enables genome-wide profiling of off-target cleavage by CRISPR-Cas nucleases. Nat Biotechnol. 2015; 33:187–197. [PubMed: 25513782]
25. Frock RL, et al. Genome-wide detection of DNA double-stranded breaks induced by engineered nucleases. Nat Biotechnol. 2015; 33:179–186. [PubMed: 25503383]
26. Duggan D, et al. Two genome-wide association studies of aggressive prostate cancer implicate putative prostate tumor suppressor gene DAB2IP. J Natl Cancer Inst. 2007; 99:1836–1844.
[PubMed: 18073375]
27. Schumacher FR, et al. Genome-wide association study identifies new prostate cancer susceptibility loci. Hum Mol Genet. 2011; 20:3867–3875. [PubMed: 21743057]
28. Gohagan JK, Prorok PC, Hayes RB, Kramer BS. The Prostate, Lung, Colorectal and Ovarian (PLCO) Cancer Screening Trial of the National Cancer Institute: history, organization, and status.
Control Clin Trials. 2000; 21:251S–272S. [PubMed: 11189683]
29. Kolonel LN, et al. A multiethnic cohort in Hawaii and Los Angeles: baseline characteristics. Am J Epidemiol. 2000; 151:346–357. [PubMed: 10695593]
30. Cook MB, et al. A genome-wide association study of prostate cancer in West African men. Hum Genet. 2014; 133:509–521. [PubMed: 24185611]
31. Cheng I, et al. Evaluating genetic risk for prostate cancer among Japanese and Latinos. Cancer Epidemiol Biomarkers Prev. 2012; 21:2048–2058. [PubMed: 22923026]
32. Akamatsu S, et al. Common variants at 11q12, 10q26 and 3p11.2 are associated with prostate cancer susceptibility in Japanese. Nat Genet. 2012; 44:426–429. S421. [PubMed: 22366784]
33. Howie BN, Donnelly P, Marchini J. A flexible and accurate genotype imputation method for the next generation of genome-wide association studies. PLoS Genet. 2009; 5:e1000529. [PubMed:
19543373]
34. Pruim RJ, et al. LocusZoom: regional visualization of genome-wide association scan results.
Bioinformatics. 2010; 26:2336–2337. [PubMed: 20634204]
Author Manuscript Author Manuscript Author Manuscript Author Manuscript
35. Reyon D, et al. Engineering customized TALE nucleases (TALENs) and TALE transcription factors by fast ligation-based automatable solid-phase high-throughput (FLASH) assembly. Curr Protoc Mol Biol. 2013 Chapter 12, Unit 12 16.
36. Chen F, et al. High-frequency genome editing using ssDNA oligonucleotides with zinc-finger nucleases. Nat Methods. 2011; 8:753–755. [PubMed: 21765410]
37. Team, T.S.R.C. R: A language and environment for statistical computing. 2014.
Author Manuscript Author Manuscript Author Manuscript Author Manuscript
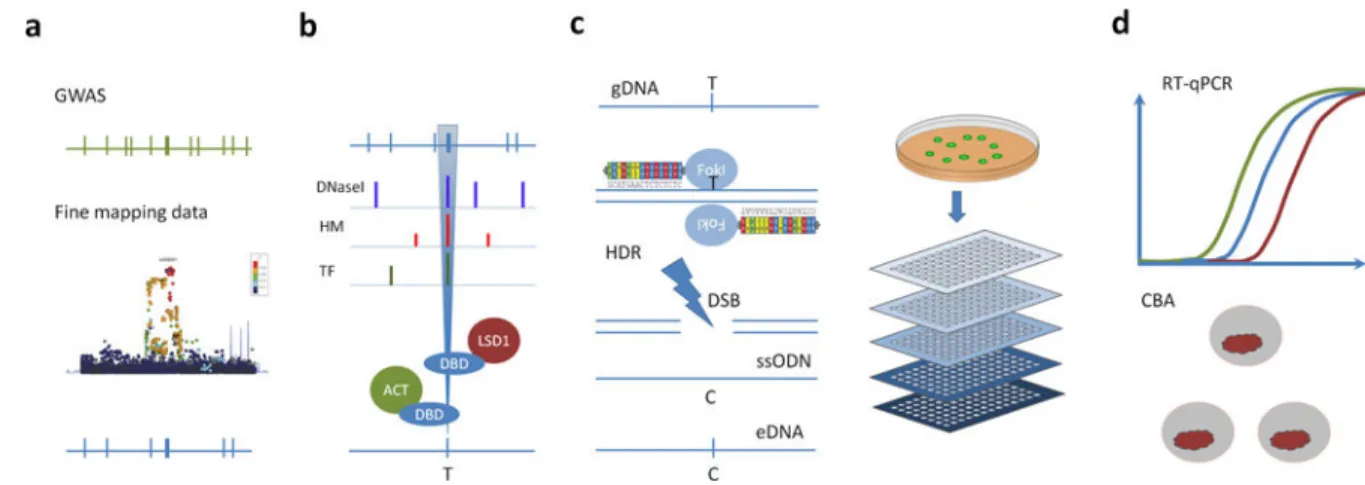
Figure 1. Overview of the CAUSEL pipeline
(a) Fine Mapping – Initial GWAS identifies a trait-associated locus (green). Fine mapping reduces the numbers of SNP candidate causal variants (blue). (b) Epigenomic Profiling – Analysis of colocalization of SNPs with epigenetic features can further prioritize causal variants for epigenome and genome editing. and Epigenome Editing - the regulatory potential of the candidate SNPs can be interrogated using epigenome-editing reagents. (c) Genome Editing - genome editing of the candidate SNP can be altered using nuclease- induced HDR. Because the efficiency of the HDR can be low, single cell cloning and genotyping is necessary. (d) Phenotypic Characterization - The isogenic cell lines can undergo phenotypic assessment for a range of traits, including measurement of gene expression levels and cell-based functional assays. Abbreviations: GWAS = Genome Wide Association Study; DNaseI = DnaseI Hypersensitivity peak; HM = Histone Marks
including, H3K3Me2 and H3K27Ac sites; TF = transcription factor binding sites; DBD = DNA Binding Domain (TALE or gRNA mediated dCAS9); LSD1 = Lysine-specific histone demethylase 1A; VP64 = VP64 artificial transcription factor activator; T= mutant allele; C
= wild type allele; gDNA = genomic DNA; FokI = FokI nuclease; DSB = Double Stranded Break; HDR = Homology Directed Repair; ssODN = single stranded oligonucleotide HDR template, carrying the required alteration; eDNA = edited DNA; RT-qPCR = quantitative real-time PCR; CBA = cell based assay
Author Manuscript Author Manuscript Author Manuscript Author Manuscript
Figure 2. Genetic and epigenetic landscape of the 6q22.1 region
(a) Fine mapping of the 6q22 prostate cancer risk region (Data from 13). Each dot represents a SNP and its association with prostate cancer risk (–log(P value) from a 1-degree freedom Wald test) in a multiethnic cohort (N=18,031 cases and N=18,030 controls) is plotted on the y-axis. Rs339331 is shown in purple. The colors represent the degree of linkage
disequilibrium with rs339331. (b) Fine mapping revealed 27 correlated variants in this region (green), however only the rs339331 (red) SNP co-localizes with multiple epigenetic features. (c) Publicly available epigenomic data, including DNaseI peaks (light blue) and H3K4me2 (dark blue). Transcription factor ChIP-seq in LNCaP cells reveals binding of HOXB13 (royal blue), FoxA1 (yellow), and AR (green). The red track demonstrates the AR ChIP-seq enrichment from a human prostate tumor tissue sample. (d) Genomic locations of
Author Manuscript Author Manuscript Author Manuscript Author Manuscript
rs339331, HOXB13 binding site (red), amplification oligos for HOXB13 ChIP-qPCR (blue) and TALE-LSD1 or TALE activator DNA binding locations (DBD represents DNA Binding Domain; golden (DBD_1) and purple (DBD_2)). (e) HOXB13 ChIP-qPCR performed in primary prostate tumors. RFX6 expression in response to site-specific recruitment of TALE- LSD1 (f) and TALE-ACT (g) to rs339331. All ChIP-qPCR and gene expression calculations are based on the mean ± standard deviation of three independent experiments (n=9). P values were obtained using the unpaired two-tailed Student’s t-test; **P<0.01.
Author Manuscript Author Manuscript Author Manuscript Author Manuscript
Figure 3. High-throughput sequencing pipeline and barcoding strategy
(a) Identification of isogenic cell lines by single cell cloning. This process consists of colony transfer into tissue culture plates and making replica plates; one for DNA extraction and genotyping and one for continued growth of colonies. The rest of the figure focuses on the sequencing pipeline. In this example, there are five separate plates for genotyping. (b) Each plate (represented by the blue bars) is barcoded by a unique amplicon and each amplicon contains the area of interest (denoted by the red hash mark). Each amplicon is shifted by 2–3 basepairs relative to the previous one. PCR based target amplicon generation using cell lysate from the plates is performed. (c) Within an individual plate, conventional dual barcoding is performed. Thus, each well (e.g., well A1) from separate plates will have the same conventional dual barcodes, but will be distinguished by the amplicon, which is unique for each plate. (d) Amplicon sequencing and variant identification after high throughput sequencing. Each clone is identified by its plate number (amplicon barcode) and well position (conventional barcode). A full computational pipeline has been developed and is available upon request. See Methods for full details. (e) Each clone can have one of three possible outcomes: unchanged, indels created by the NHEJ pathway, and knock-ins created by the HDR pathway.
Author Manuscript Author Manuscript Author Manuscript Author Manuscript
Figure 4. Sequencing reveals allelic diversity created by genome editing
(a) Summary plot representing the 459 alleles identified by sequencing 1,832 clones (1,920 clones – 40 failed reactions – 48 controls); each row is an allele and black lines refer to deletions. All of the deletion variants were listed and sorted based on the starting position of the deletion. The four bases are color coded (A, C, G, T); an insertion (I) larger than 1bp is indicated by light blue cells, a deletion (D) is demonstrated by black cells. Sequence logos show a 21 base pair core region surrounding rs339331 (top) and the positions and deletion frequencies for each nucleotide in the core sequence (bottom). (b) Heatmap showing the frequency of clones with a certain deletion size (x-axis) and insertion or substitution size (y- axis). (c) Frequency distribution for different mutation classes across the 1,832 clones.
Genotypes are indicated by C or T, “Mut” is defined as a substitution, insertion, or deletion.
Author Manuscript Author Manuscript Author Manuscript Author Manuscript
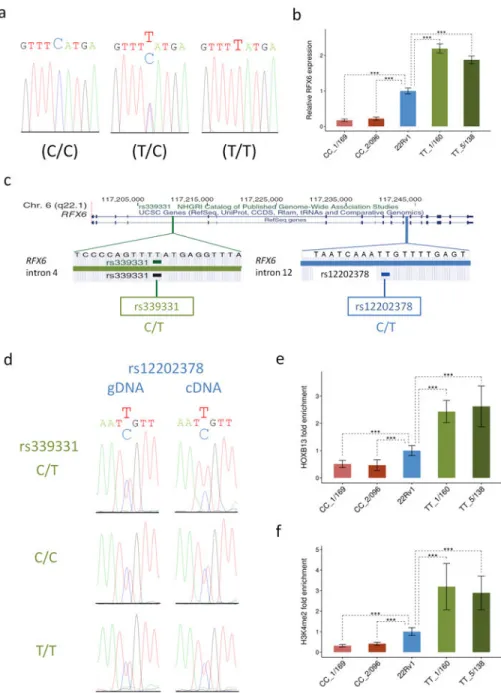
Figure 5. Genotypic status at rs339331 causally affects RFX6 gene expression, HOXB13 binding, and the H3K4me2 histone modification
(a) Sanger sequencing of the two TALEN HDR-modified (C/C and T/T) and parental (C/T) 22RV1 cell lines. The rs339331 position is in larger font (b) RFX6 mRNA abundance was evaluated by qPCR in two clones of each HDR modified cell line (CC_1/169 and CC_2/096 represent two independent CC clones and TT_1/160 and TT_5/138 represent two
independent TT clones). (c) Genomic location and DNA chromatogram of two SNPs in the RFX6 gene in the 22Rv1 cell line: rs339331 (intron 4) and the rs12202378 heterozygous reporter SNP in intron 12. (d) Each row represents one of the rs339331 genotypes (green) and the two columns represent rs12202378 (blue) sequenced in genomic DNA (gDNA) and heteronuclear cDNA. Genomic (gDNA) was used as a control for allelic balance. HOXB13 enrichment (e) and H3K4me2 enrichment (f) were measured by ChIP qPCR at the rs339331
Author Manuscript Author Manuscript Author Manuscript Author Manuscript
site. All calculations are based on the mean ± standard deviation of three independent experiments (n=9). P values were obtained using the unpaired two-tailed Student’s t-test;
***P<0.001.
Author Manuscript Author Manuscript Author Manuscript Author Manuscript
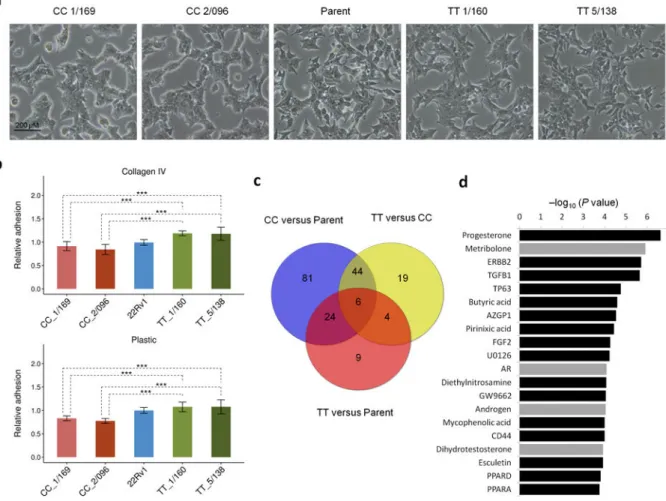
Figure 6. Genotype at rs339331 alters morphology, cellular adhesion, and transcripts that are predicted to be regulated by androgens
(a) The 22Rv1 cell lines of each genotype were cultured in serum-containing medium for 48 hours, and analyzed by phase microscopy, 100× magnification. (b) The TT clones are significantly more adherent to plastic and to collagen IV; Mean ± standard deviation of three independent experiments (n=12). P values were obtained using the unpaired two-tailed Student’s t-test; *** P<0.001. (c) Venn diagram displaying the number of differentially expressed genes for each pairwise comparison between the isogenic cell lines. (d) Androgenic compounds and the androgen receptor (AR) (grey) are among the most significant predicted upstream regulators of genes differentially expressed between TT and CC clones.