Arginyltransferase ATE1 suppresses cell tumorigenic potential and inversely correlates with metastases in human cancers
Reena Rai1,#, Fangliang Zhang1,2,#, Kristen Colavita1, Nicolae Adrian Leu1, Satoshi Kurosaka1, Akhilesh Kumar2, Michael D. Birnbaum2, Balázs Győrffy3,4, Dawei W. Dong5, Michael Shtutman6, and Anna Kashina1,*
1University of Pennsylvania, Philadelphia, PA 19104
2University of Miami Miller School of Medicine, Sylvester Comprehensive Cancer Center, Miami, FL 33125
3MTA TTK Lendület Cancer Biomarker Research Group, Budapest, Hungary
42nd Dept. of Pediatrics, Semmelweis University, Budapest, Hungary
5Institute for Biomedical Informatics, Perelman School of Medicine, University of Pennsylvania
6University of South Carolina, Columbia, SC
Abstract
Arginylation is an emerging posttranslational modification mediated by arginyltransferase (ATE1) that is essential for mammalian embryogenesis and regulation of the cytoskeleton. Here, we discovered that Ate1 knockout embryonic fibroblasts exhibit tumorigenic properties, including abnormally rapid contact-independent growth, reduced ability to form cell-cell contacts, and chromosomal aberrations. Ate1 knockout fibroblasts can form large colonies in Matrigel and exhibit invasive behavior, unlike wild type fibroblasts. Furthermore, Ate1 knockout cells form tumors in subcutaneous xenograft assays in immunocompromised mice. Abnormal growth in these cells can be partially rescued by reintroduction of stably expressed specific Ate1 isoforms, which also reduce the ability of these cells to form tumors. Tumor array studies and bioinformatics analysis show that Ate1 is down-regulated in several types of human cancer samples at the protein level, and that its transcription level inversely correlates with metastatic progression and patient survival. We conclude that Ate1 knockout results in carcinogenic transformation of cultured fibroblasts, suggesting that in addition to its previously known activities Ate1 gene is essential for tumor suppression and also likely participates in suppression of metastatic growth.
Keywords
Arginylation; Ate1; tumor suppression; metastases; substrate-independent growth
Users may view, print, copy, and download text and data-mine the content in such documents, for the purposes of academic research, subject always to the full Conditions of use: http://www.nature.com/authors/editorial_policies/license.html#terms
*Corresponding author: Department of Animal Biology, School of Veterinary Medicine, University of Pennsylvania, Philadelphia, PA 19104.
#These authors contributed equally to this work.
HHS Public Access
Author manuscript
Oncogene. Author manuscript; available in PMC 2016 August 10.
Published in final edited form as:
Oncogene. 2016 August 4; 35(31): 4058–4068. doi:10.1038/onc.2015.473.
A uthor Man uscr ipt A uthor Man uscr ipt A uthor Man uscr ipt A uthor Man uscr ipt
Introduction
Protein arginylation is an emerging posttranslational modification mediated by
arginyltransferase ATE1 (1). Arginylation was originally discovered in 1963 (2), and was shown through recent studies to play a global role in many biological processes, including cardiovascular development, angiogenesis (3), cell migration (4), and tissue morphogenesis (5). Over 100 arginylated proteins have been identified in vivo (5–8), and this list is growing by the day.
Despite growing evidence of the importance of arginylation, its exact biological functions in normal physiology and disease remain poorly understood. Ate1 knockout mouse embryonic fibroblasts exhibit pronounced defects in migration and adhesion reminiscent of cancer cells (4, 9). However, a disease connection between arginylation and cancer has never been explored (10).
Here we addressed the possibility that Ate1 knockout confers cancerous phenotypes at the cellular level. We found that Ate1 knockout in cultured cells leads to contact-and substrate- independent cell growth, formation of subcutaneous tumors in xenograft studies, and that reduction in Ate1 levels correlates with cancer and is particularly associated with metastatic potential. Our study is the first direct demonstration of Ate1 role in cancer, identifying Ate1 as a potential novel tumor suppressor and a biomarker for metastatic cancers.
Results
Ate1 knockout cells exhibit density-and serum-independent growth and chromosomal aberrations
Our previously published data show that immortalized Ate1 knockout (KO) mouse
embryonic fibroblasts (MEF) exhibit defects in cell spreading (4) and cell-cell adhesion (9).
Working with these cells, we observed that they generally grew to higher densities at confluency than the similarly treated wild type cells. To test if Ate1 KO cells grow
differently than wild type, we quantified their multiplication rates in comparison to similarly derived and immortalized wild type MEF. In these assays, wild type cells typically reached confluency at 3–4 days post-inoculation and continued to survive in culture plates as a monolayer without undergoing further multiplication (Fig. 1A). In contrast, Ate1 KO MEFs continued to grow and multiply even after reaching confluency, eventually growing to the densities over 10-fold higher than wild type (Fig. 1A). Notably, such contact-independent growth is characteristic for many cancer cells and ultimately underlies their ability to form tumors and metastases.
To further test whether Ate1 KO cells exhibit behavior similar to cancer cells in culture, we studied the ability of these cells to grow and multiply under low serum conditions, which inhibit the growth of normal, but not highly malignant cells. To do this, we performed growth curves similar to those shown in Fig. 1A, using immortalized WT and Ate1 KO cells grown in 0.5% serum. While both cell types grew slower during serum deprivation, Ate1 KO
A uthor Man uscr ipt A uthor Man uscr ipt A uthor Man uscr ipt A uthor Man uscr ipt
cells were able to reach much higher densities compared to WT (Fig. 1B and S1), suggesting that these cells can actively divide even in very low serum.
Experiments showed that the contact-independent growth was observed only in
immortalized Ate1 KO MEFs, but not in primary cultures freshly derived from Ate1 KO mouse embryos (Fig. 1C), suggesting that this quality is acquired by these cells with additional changes that occur during immortalization. Notably, however, even in the primary fibroblasts freshly derived from E12.5 mouse embryos, the karyotypes were highly abnormal (Fig. 1D), suggesting that these cells have already accumulated genetic defects that may result in further abnormalities after immortalization.
The abnormal growth of Ate1 KO cells is associated with defects in contact inhibition The abnormally high multiplication rates seen in Ate1-KO cells could be explained by either an overall reduction in cell doubling time that drives them to divide at a faster rate, or by compromising contact inhibition – a process commonly seen in non-cancerous cells, which inhibits cell migration and proliferation upon sensing the proximity to their neighbors. To directly test these two possibilities, we cultured the Ate1-KO and WT cells at varying densities and examined their multiplication rates under these conditions. In scarce cultures, where cells largely remain isolated from each other, both Ate1-KO and WT cells multiplied at nearly equal rates (Fig. 2A), suggesting that in the active growth phase without proximity to their neighbors these cells have largely similar doubling time. However, when plated in dense cultures, Ate1-KO cells multiplied much faster than WT cells (Fig 2B). This difference of growth in dense cultures can be explained either by difference in apoptosis rates, or by difference in contact-inhibit. To test these possibilities, we first used Terminal deoxynucleotidyl transferase dUTP Nick End Labeling (TUNEL) assay to measure the rate of apoptosis in confluent WT and Ate1 KO cells. We found that both types of cells have negligible levels of apoptosis in such conditions, which cannot account for their difference in cell proliferation (Fig. S2A). We next tested whether Ate1 KO cells exhibit characteristic morphological changes that accompany defects in contact inhibition, including reduced cell- cell contacts and foci formation in culture. Indeed, while the WT MEF formed normal cell monolayers in dense culture, the Ate1-KO cells tended to cluster and form foci, with multiple layers of cells piling on top of each other (Fig. 2C). Furthermore, consistent with our prior observations (Zhang et al 2012), Ate1-KO cells showed a greatly reduced ability to form cadherin-containing cell-cell adhesions, further confirming that these cells have reduced ability to contact each other (Fig. 2D).
In normal cells, contact inhibition is accompanied by decreased cell cycle activity in dense cultures. Impairments in contact inhibition are expected to result in higher cell cycle activity at confluency. To test whether confluent Ate1 KO cells have higher entry rates into S-phase compared to WT, we double-labeled the cells with a thymidine analogue, 5-ethynyl-2′- deoxyuridine (EdU), which is incorporated into DNA during the S phase of cell cycle. In addition, Hoechst 33342 or 2-(4-amidinophenyl)-1H-indole-6-carboxamidine (DAPI) was also used to uniformly label DNA. We then used imaging and cell sorting to compare the cell cycle distribution and the amount of cells with actively replicating DNA in WT and Ate1 KO (Fig. 3 and Fig. S2B,C). In both scarce and confluent cultures, the percentages of
A uthor Man uscr ipt A uthor Man uscr ipt A uthor Man uscr ipt A uthor Man uscr ipt
EdU-labeled cells in S-phase as well as the overall cell distribution over different cell cycle stages, were very similar between Ate1-KO cells and WT cells. However, in confluent cultures, Ate1-KO cells had much higher percentage (nearly 2-fold) of actively replicating cells compared to WT. These data suggest that Ate1-KO cells continue to be active in the cell cycle in dense cultures and do not undergo contact inhibition like WT MEF.
Ate1 KO MEF grow large colonies in Matrigel and form tumors in xenograft studies
The abnormal growth and lack of contact inhibition seen in Ate1 KO cells are reminiscent of cancer cells, which often show contact-independent and serum-independent growth and foci formation in culture. Other prominent characteristics of cancer cells are their ability to form large invasive colonies in soft 3D matrices and form subcutaneous tumors when injected into mice.
To test these properties, we first examined the behavior of Ate1 KO cells grown suspended in Matrigel, which provides a simulated microenvironment of extracellular matrix through which tumorigenic and invasive cells may grow. Over the course of 4 weeks, WT cells remained embedded in the matrix as small cell aggregates without exhibiting significant growth. At the same time Ate1 KO cells continued to grow at very high rates, forming large colonies that, after week 1, began active invasion into the matrix and eventually occupied most of the matrix as large cell masses (Fig. 4).
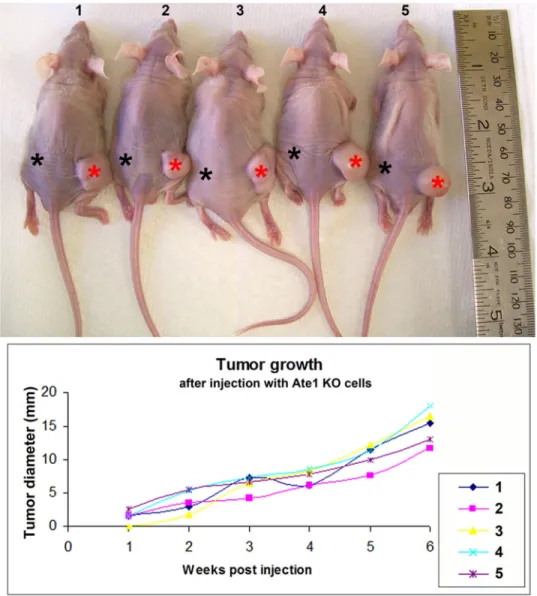
We next injected Ate1 KO cells subcutaneously into immunocompromised (NCr −/−) mice to test if these cells are able to form tumors in this assay (Fig. 5). The same mice were simultaneously injected with wild type cells on the left flank and with the same amount of Ate1 KO cells on the right flank at a symmetric site (the injection sites are marked by asterisks in Fig. 5, with black asterisks for WT cells and red asterisks for Ate1 KO cells, respectively). Remarkably, all the injected mice developed prominent tumors on the right flank over the course of 6 weeks, while showing no visible or palpable tumor growth on the left (Fig. 5).
Thus, Ate1 KO cells show potent tumorigenic properties in their ability to grow and invade in soft matrices and form subcutaneous tumors in mice.
Ate1 KO cells’ abnormal growth and tumorigenicity can be partially rescued by specific Ate1 isoforms
Our grows assays (Fig. 1) indicate that only the immortalized, but not the primary Ate1 KO cells have abnormal growth rates, suggesting that Ate1 knockout may trigger tumorigenic changes in these cells down the road but may by itself be not sufficient to induce
tumorigenicity. At the same time, it is possible that some, or many of the abnormalities in the immortalized cultures are driven directly by the ongoing deficiency of Ate1-mediated arginylation. To test this possibility, we performed rescue experiments, by stably transfecting Ate1 KO MEFs with individual GFP-fused Ate1 isoforms 1–4 (11). The level of
exogenously expressed Ate1 in KO cells was determined to be comparable to that of endogenous Ate1 in WT cells (Fig. S3). We then accessed the growth rates of these cells in culture, in comparison to Ate1 KO MEFs transfected with GFP alone. Remarkably, while all of the transfected cultures still grew at relatively high rates (Fig. 6A), transfection with Ate1
A uthor Man uscr ipt A uthor Man uscr ipt A uthor Man uscr ipt A uthor Man uscr ipt
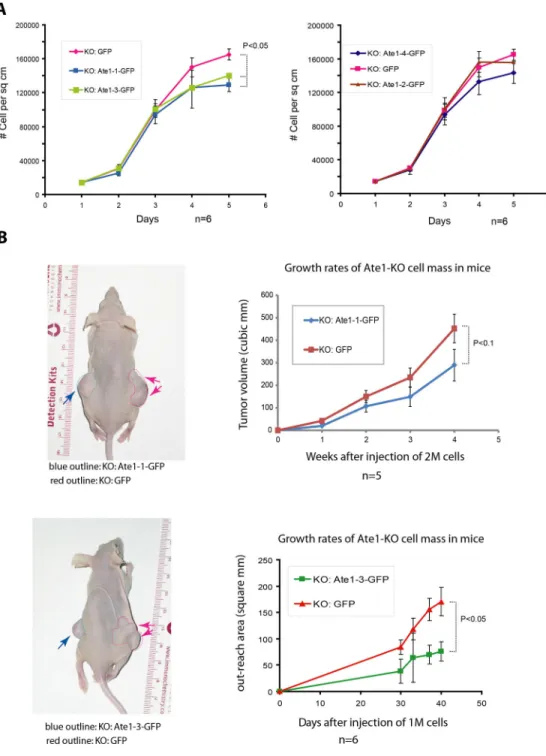
isoforms 1 and 3 partially reduced the growth rates of these cells (Fig. 6A, left), although isoforms 2 and 4 showed no visible effect on cell growth compared to GFP alone (Fig. 6A, right). These data suggest that the lack of Ate1 (at least certain isoforms) is the direct reason for at least some of the abnormal growth effects of the Ate1 KO cells seen in culture.
To test whether the lack of Ate1 is also directly contributing to tumor growth seen in immunocompromised mice, we performed tumor xenograft studies in NCr−/− mice, injecting each mouse with the Ate1-transfected Ate1-KO cells on one side and the GFP- transfected Ate1-KO cells on the other side. In these assays, Ate1-1 and Ate1-3-transfected cells grew much slower than control and formed significantly smaller tumors over the course of several weeks, suggesting that the genetic deletion of Ate1 was at least one of the direct causes for the tumor growth (Fig. 6B). At the same time, Ate1-2 transfected cells formed tumors at the rates similar to the control (Fig. S4).
Ate1 level is reduced in human cancer and inversely correlates with metastatic progression
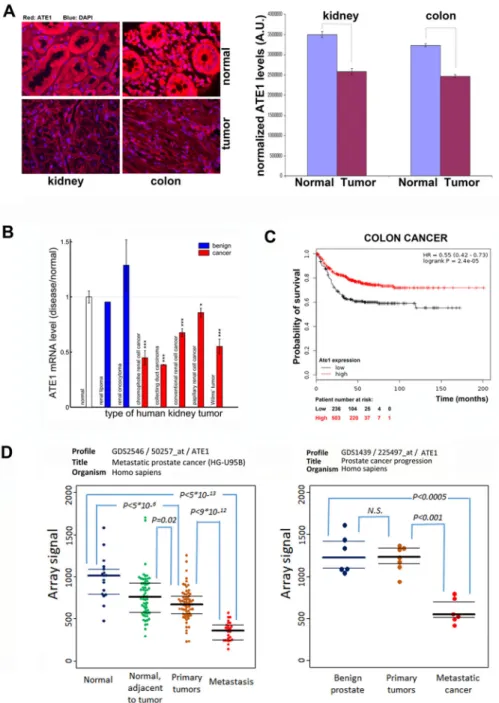
Our data so far suggest that Ate1 knockout confers tumorigenic properties to cultured mouse fibroblasts. An exciting possibility that can be extrapolated from these results is that Ate1 possesses tumor suppressor characteristics and that its levels may inversely correlate with carcinogenic properties of multiple cell types involved in cancer. To test this possibility, we tested tissue arrays of human colon and kidney carcinomas using immunohistochemistry with anti-Ate1 antibodies. Remarkably, in both arrays, the average level of Ate1 staining was significantly lower in the tumor samples compared to the matched samples of normal tissues from the same patients (Fig. 7A). Consistent to the results seen in our immunostaining assays, database searches of published data on patient tumor samples showed that mRNA level of Ate1 is significantly lower in malignant types of kidney cancers (chromophobe renal cell cancer, collecting duct carcinoma, conventional renal cell cancer, papillary renal cell cancer, and Wilm’s tumor), compared to the non-diseased kidney tissues or the relatively benign kidney tumors (renal lipoma and renal oncocytoma) (Fig. 7B). Moreover, low Ate1 mRNA levels were also associated with poor survival prognosis in human colon cancer patients (Fig. 7C).
Ate1-KO is known to cause defects in cell migration (4), adhesion (9), and E-cadherin expression (12), which are commonly indicative of enhanced cancer invasion and EMT. In addition, Ate1 KO cells also exhibit invasive growth in Matrigel (Fig. 4). Therefore, in addition to the tumorigenic properties, Ate1-KO is also likely to contribute to metastasis/
invasion. Indeed, in at least one study of prostate cancer progression, Ate1 mRNA levels were lowered in primary non-metastatic tumor compared to non-diseased tissues, and in two different studies Ate1 mRNA levels were further reduced in metastatic prostate cancer tissues compared to the primary tumors (Fig. 7D). These data suggest that the down- regulation of Ate1 is not only correlated with cancer, but also potentially associates with the progression of cancer toward metastasis.
A uthor Man uscr ipt A uthor Man uscr ipt A uthor Man uscr ipt A uthor Man uscr ipt
Discussion
This study is the first demonstration of a direct effect of Ate1 knockout on cell tumorigenicity, correlated with Ate1 expression level in clinical samples. It has been previously shown that Ate1 is a global biological regulator that plays a major role in embryogenesis and drives cell migration, adhesion, and the assembly and functions of the actin cytoskeleton. Our current data represents a significant expansion in the scope of the emerging protein arginylation studies and establishes a novel role of Ate1 in cancer. Our data show that Ate1 KO cells have prominent defects in contact inhibition, the properties that likely enable their uncontrolled growth in dense cultures and in Matrigel, as well as subcutaneous tumor formation in xenograft studies. In agreement with these observations, Ate1 is down-regulated in human cancers and its expression is further reduced in metastatic tissues.
Our data show that immortalized Ate1 KO MEF can form subcutaneous tumors in immunocompromised mice. This is a surprising result, considering that in most reported cases with similar experimental settings, the deletion of a single gene rarely renders a tumorigenic phenotype in immortalized MEF. However, it is also important to point out that primary Ate1 KO cells, unlike the immortalized cultures, do not exhibit abnormal growth, suggesting that Ate1 knockout likely represents a key step in carcinogenesis rather than driving the whole process all by itself.
In our phenotype rescue experiments, individual recombinant Ate1 isoforms could not completely suppress the growth of immortalized Ate1 KO cells back to a level similar to the WT cells. Plausible causes may include the fact that Ate1 in these cells is represented by multiple isoforms and the presence of all these isoforms may be required to achieve a complete or near-complete rescue effect. It is also possible that the genetic plasticity seen in Ate1 KO cells may cause additional carcinogenic changes that cannot be rescued by the reintroduction of Ate1 alone. These possibilities may need to be further explored in future studies. At the same time, the fact that specific Ate1 isoforms can partially rescue the abnormal growth in these cells suggests that even in the advanced carcinogenic states Ate1 activity continues to play a role in rendering these cells’ malignant properties. Another intriguing observation is the difference between the four Ate1 isoforms, which are highly similar in molecular weight and sequences with only small differences in their N-termini and the central region. These isoforms are formed by alternative splicing of highly homologous exons. Despite their similarity, mounting evidence already indicates their difference in enzymatic activity and substrate preferences (11, 13–15). While in our phenotype rescue experiments only Ate1-1 and Ate1-3, which share a centrally located alternatively spliced exon, produce an effect, it is possible that the Ate1-2 and 1–4 isoforms may participate in other aspects of tumorigenesis not addressed in our study.
The molecular mechanism underlying the role of Ate1 in cancer development is likely very complex. Ate1 is evolutionarily conserved in eukaryotes and even in some bacteria.
Hundreds of arginylation substrates have been identified and the list is constantly expanding.
Known substrates include cytoskeletal, chromosomal, and signaling proteins, transcription and translation factors, metabolic enzymes, and molecular chaperones, many of which have
A uthor Man uscr ipt A uthor Man uscr ipt A uthor Man uscr ipt A uthor Man uscr ipt
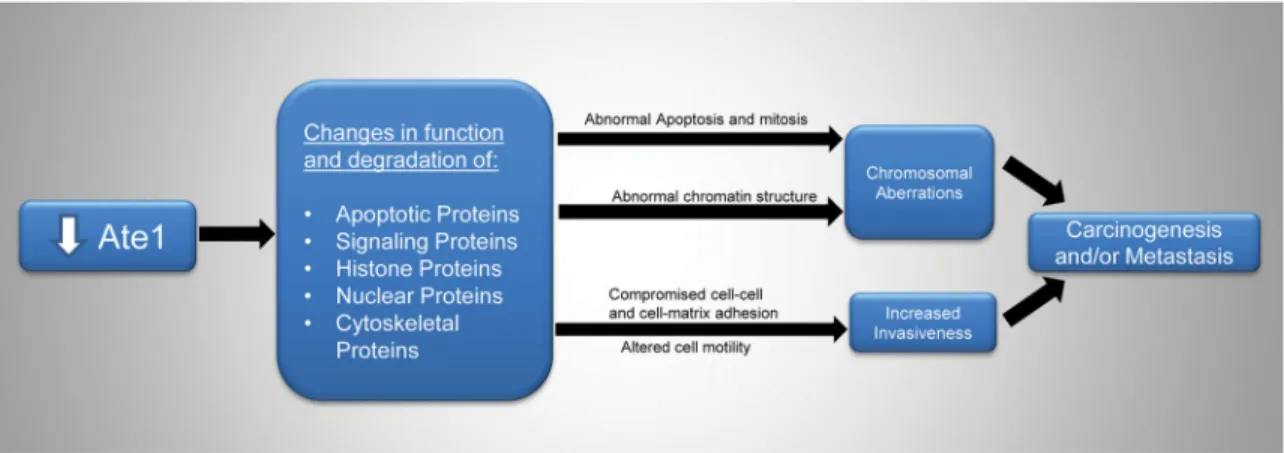
the potential to directly and/or indirectly impact cancer-relevant processes. For example, published reports already found that down-regulation of Ate1 affects cell motility (4), and compromise cell adhesions (9) and targets proteins involved in mitosis, chromatin structure, apoptosis, and cell cycle (8, 16, 17), all of which are expected to contribute to carcinogenesis and/or metastasis (Fig. 8). Additional pathways may exist, since the current list of identified arginylation targets is far from complete. For example, down-regulation of Ate1 was recently found to transcriptionally induce loss of E-cadherin, a process that is also involved in epithelial-mesenchymal transition (12). The molecular mechanisms underlying the functional role of Ate1/arginylation in cancer development will remain an exciting and challenging topic for the field.
By immunohistochemistry analysis of human cancer samples and data-mining of existing transcription databases, our study have revealed evidence linking Ate1 to cancer
development. Specifically, in all types of cancers that we tested, we found that down- regulation of Ate1 contributes to tumorigenesis, metastasis, and/or patient survival. This evidence is consistent with the data we obtained from cell-based and animal-based tests, further demonstrating the robustness of our conclusions. Considering that Ate1 is an evolutionary conserved enzyme that is ubiquitously expressed in all tissues in the human body, it is likely the mechanism revealed in our study applies to many other types of cancers, which awaits additional work. From the clinical standpoint, the level of Ate1 has a good chance to be used as a predictive marker for cancer progression. While Ate1 itself may not be a good direct target for cancer therapy because it appears to be generally down-regulated in cancer, as a protein-modifying enzyme it affects many important signaling and structural proteins such as actin, talin, RGS, and BRCA. Lack of arginylation of those proteins may contribute to tumorigenesis or metastasis, and may be able to serve as direct drug targets. All these possibilities will need to be elucidated by future studies.
Experimental Procedures
Cell culture
Wild type and Ate1 knockout MEFs were derived from littermate E12.5 mouse embryos obtained from matings of Ate1 +/− mice (3). For primary cell culture experiments, MEFs were used for the experiments at 3rd passage after derivation. For experiments with immortalized cells, primary WT and Ate1 KO MEFs were immortalized by continuous passaging in culture as described elsewhere (3). Several independently derived primary and immortalized cultures were used throughout the studies to confirm consistency. MEFs were cultured in equal mix of DMEM (high glucose with Glutamax, Life Technologies) and F10 (Life Technologies), supplemented with antibiotics and 10% FBS (Sigma Cat# F6178) unless otherwise mentioned. Cells were maintained in 5%CO2 at 37°C.
Cell multiplication studies
Cells at the beginning of the experiment were seeded at equal densities from the same culture into wells of 24-well plates and cell numbers per well were quantified daily by trypsinizing the entire well and counting using a hemocytometer.
A uthor Man uscr ipt A uthor Man uscr ipt A uthor Man uscr ipt A uthor Man uscr ipt
Cloning of pBabe-puro vector carrying Ate1-GFP
To construct mammalian expression vectors, the four isoforms (1,2,3,4) of Ate1 were subcloned from the template of plasmid vectors containing coding sequences for mouse Ate1, isoform 1, 2, 3, 4, originally constructed for bacterial expression as described in previous publication (18). The coding sequence of Ate1 was first cloned into a mammalian transient expression vector pEGFP-N2 with a forward primer: ATC AAC TCG AGA ATA ATT TTG TTT AAC TTT AAG AAG GAG ATA TAC ATA TG; and a reverse primer: TAC ATA GGA TCC CAC CGG TTC CCT GAA AAT ACA GGT TTT C, with XhoI and BamHI for restriction site. As a result, there is a TEV recognition sequence ENLYFQGTG and another linker sequence GIHRPVAT between Ate1 and eGFP. To construct a stably mammalian expression vector with low expression promoter, the above mentioned Ate1- eGFP sequences were further subcloned by using a forward primer ATC TAT GAT CAG CCG CCA CCA TGG CTT CTT GGA GCG CGC CTT CA for Ate1-isoform 1 and 2, and another forward primer ATC TAT GAT CAG CCG CCA CCA TGG CCT CGG TGG TGG AAT ACA AG for Ate1 isoform 3 and 4, and a common reverse primer TTA ATG TCG ACG GCG CGC CTT ACT TGT ACA GCT CGT CCA TGC CGA GAG for eGFP. For a negative control, the eGFP coding sequence was subcloned with a forward primer TTA ATT GAT CAA CGC GTG GGC CCG GGA TCC ACC GGC CGG TCG CC and a reverse primer TTA ATG TCG ACG GCG CGC CTT ACT TGT ACA GCT CGT CCA TGC CGA GAG. The above-mentioned PCR products were cleaved with restriction enzymes Bcll and SalI and ligated into pBabe-Puro vector (from Cell Biolabs, INC) that was digested with BamHI and SalI.
Creation of stably transfected MEF
To construct retrovirus as a transfection reagent, HEK 293T cells were co-transfected with GAG-Pol (from Clontech), VSVG (from Clontech), and the pBabe-Puro vectors carrying desired Ate1-GFP coding sequence with the Lipofectamine reagent (Invitrogen). To construct cells stably expressing Ate1-GFP or GFP, immortalized MEF (WT and Ate1-KO) were transfected with retrovirus in the presence of polybrene (from Sigma). The transfected cells were then grown for at least five passages before being enriched by fluorescent sorting for the GFP signal.
Western Blot (WB)
Proteins or cell extracts were first separated on SDS-PAGE before being transferred to a nitrocellulose or PVDF membrane, similarly as described in (9). Protein bands were probed with primary antibody for either Ate1 (Millipore, cat#MABS436, clone 6F11), actin (Sigma, cat#A2066), beta-tubulin (Sigma, Catalog # T4026), or GFP (Roche, cat# 11814460001).
HRP-conjugated secondary antibodies (anti-rat, Santa Cruz, cat# sc-2032; anti-rabbit/mouse, Roche, cat# 11520709001) and chemifluorescence reagents (from Roche cat# 11520709001) were used to visualize protein signal.
Matrigel assay
Matrigel (from Becton-Dickinson) was diluted by cultured medium (with 10% FBS) to 1mg/ml and equilibrated to ~42 °C, then gently mixed with trypsinized cells to achieve even
A uthor Man uscr ipt A uthor Man uscr ipt A uthor Man uscr ipt A uthor Man uscr ipt
distribution of cells within the media and placed into 24-well culture plate (from Corning Costar) to solidify. Growing colonies were observed and photographed weekly for the analysis shown in Fig. 4.
Analysis of Cell Cycle
For the microscopy method, WT and Ate1-KO MEF cells were seeded at 10% (for nonconfluent culture) or 90% (for confluent culture) and grown for 18 hours. Cells were incubated with 20μM EdU (Click-iT EdU Alexa Fluor-594 Imaging Kit, from ThermoFisher Scientific, catalogue number C10339) for one hour at 37°C in the 5% CO2 incubator. Cells were then fixed with 3.7% formaldehyde and permeabilized with 0.5% Triton X-100. To label EdU incorporated in DNA, permeabilized cells were treated with fluorescent labeling reaction cocktail supplied in the Click-iT EdU Imaging Kit. Hoechst 33342, also supplied with the kit, was used for DNA staining for identification of cells in G0/G1, G2/M phase based on the intensity, morphology, and distribution of nuclear DNA.
For the FACS sorting method, cells with culture densities as described above were recovered using trypsin, fixed with 3.7% formaldehyde, and then permeabilized with 0.1% saponine for fluorescent labeling with components from the Click-iT EdU Imaging Kit. After that. 4′, 6-diamidino-2-phenylindole (DAPI) was used for DNA staining.
Immunohistochemistry of tumor arrays
Kidney and colon carcinoma arrays, containing 40 pairs of matched tissue samples were obtained from US Biomax, Inc. To determine Ate1 levels, tissue sections in the entire array were stained with rat monoclonal anti-Ate1 (clone 6F11, (19)) and after image acquisiotion Ate1 fluorescence was quantified as gray levels using Metamorph imaging software (Molecular Devices). For each data point, total fluorescence in each field of view was normalized to DAPI staining in the same field and fluorescence from 3 fields of view was averaged to obtain the Ate1 levels for each tissue sample.
Immunocytochemistry
Immunocytochemistry was performed as described elsewhere (9). MEF cultured on glass coverslips were fixed and permeabilized by methanol and acetone. After rehydration with dPBS, the cells were stained with polyclonal rabbit pan-cadherin antibodies (Sigma, Cat#
C3678) to detect adherens junctions.
Xenograft studies
4 week old mice NCRNU-M-M, homozygous, CrTac: NCr-Foxn1nu were purchased from Taconic. Each mouse was injected with 2 million freshly grown, gently collected cells suspended in 0.5 ml sterile warm PBS on each side as described in the figures and text.
Tumor growth was observed over the course of 5–7 weeks, until the tumors became so big that the mice had to be euthanized. Tumor size was measured weekly using a calipher.
Analysis of Ate1 expression in human cancer arrays
ATE1 expression in normal, benign, and malignant tissues of different tumor types was obtained from microarray data deposited in GEO database. P values (student’s t test) are
A uthor Man uscr ipt A uthor Man uscr ipt A uthor Man uscr ipt A uthor Man uscr ipt
indicated for significant differences between the groups. In the clinical survival analysis all available samples (n=739) were used to maximize statistical power.
Code availability
Computer codes for the analysis of microarray data from kidney cancer shown in the paper is publicly available and can be downloaded from the web address: http://
code.vet.upenn.edu/download/Ate1Cancer/. For colon cancer survival plots, we used the R script available in the supplemental material in (20).
Supplementary Material
Refer to Web version on PubMed Central for supplementary material.
Acknowledgments
This work was supported by NIH grants GM104003 and GM117984 and the Pilot Grant from the Mari Lowe Center for Comparative Oncology to A.K. B. G. was supported by the OTKA K108655 grant. M. S. was supported by NIH grant GM109091. F. Z., M.D.B., and A. Kumar were partly supported by a Developmental Grant from Sylvester Comprehensive Cancer Center.
References
1. Balzi E, Choder M, Chen WN, Varshavsky A, Goffeau A. Cloning and functional analysis of the arginyl-tRNA-protein transferase gene ATE1 of Saccharomyces cerevisiae. The Journal of biological chemistry. 1990; 265(13):7464–71. Epub 1990/05/05. [PubMed: 2185248]
2. Kaji H, Novelli GD, Kaji A. A Soluble Amino Acid-Incorporating System from Rat Liver.
Biochimica et biophysica acta. 1963; 76:474–7. Epub 1963/11/22. [PubMed: 14097412]
3. Kwon YT, Kashina AS, Davydov IV, Hu RG, An JY, Seo JW, et al. An essential role of N-terminal arginylation in cardiovascular development. Science. 2002; 297(5578):96–9. [PubMed: 12098698]
4. Karakozova M, Kozak M, Wong CC, Bailey AO, Yates JR 3rd, Mogilner A, et al. Arginylation of beta-actin regulates actin cytoskeleton and cell motility. Science. 2006; 313(5784):192–6. Epub 2006/06/24. [PubMed: 16794040]
5. Kurosaka S, Leu NA, Zhang F, Bunte R, Saha S, Wang J, et al. Arginylation-dependent neural crest cell migration is essential for mouse development. PLoS genetics. 2010; 6(3):e1000878. Epub 2010/03/20. [PubMed: 20300656]
6. Saha S, Wong CC, Xu T, Namgoong S, Zebroski H, Yates JR 3rd, et al. Arginylation and methylation double up to regulate nuclear proteins and nuclear architecture in vivo. Chemistry &
biology. 2011; 18(11):1369–78. Epub 2011/11/29. [PubMed: 22118671]
7. Wang J, Han X, Wong CC, Cheng H, Aslanian A, Xu T, et al. Arginyltransferase ATE1 catalyzes midchain arginylation of proteins at side chain carboxylates in vivo. Chemistry & biology. 2014;
21(3):331–7. Epub 2014/02/18. [PubMed: 24529990]
8. Wong CC, Xu T, Rai R, Bailey AO, Yates JR 3rd, Wolf YI, et al. Global analysis of posttranslational protein arginylation. PLoS biology. 2007; 5(10):e258. Epub 2007/09/28. [PubMed: 17896865]
9. Zhang F, Saha S, Kashina A. Arginylation-dependent regulation of a proteolytic product of talin is essential for cell-cell adhesion. The Journal of cell biology. 2012; 197(6):819–36. Epub 2012/06/06.
[PubMed: 22665520]
10. Saha S, Kashina A. Posttranslational arginylation as a global biological regulator. Developmental biology. 2011; 358(1):1–8. Epub 2011/07/26. [PubMed: 21784066]
11. Rai R, Kashina A. Identification of mammalian arginyltransferases that modify a specific subset of protein substrates. Proceedings of the National Academy of Sciences of the United States of America. 2005; 102(29):10123–8. Epub 2005/07/09. [PubMed: 16002466]
A uthor Man uscr ipt A uthor Man uscr ipt A uthor Man uscr ipt A uthor Man uscr ipt
12. Eisenach PA, Schikora F, Posern G. Inhibition of Arginyltransferase 1 Induces Transcriptional Activity of Myocardin-related Transcription Factor A (MRTF-A) and Promotes Directional Migration. The Journal of biological chemistry. 2014; 289(51):35376–87. Epub 2014/11/09.
[PubMed: 25381249]
13. Kwon YT, Kashina AS, Varshavsky A. Alternative splicing results in differential expression, activity, and localization of the two forms of arginyl-tRNA-protein transferase, a component of the N-end rule pathway. Molecular and cellular biology. 1999; 19(1):182–93. Epub 1998/12/22.
[PubMed: 9858543]
14. Rai R, Mushegian A, Makarova K, Kashina A. Molecular dissection of arginyltransferases guided by similarity to bacterial peptidoglycan synthases. EMBO reports. 2006; 7(8):800–5. Epub 2006/07/11. [PubMed: 16826240]
15. Wang J, Han X, Wong CC, Cheng H, Aslanian A, Xu T, et al. Arginyltransferase ATE1 catalyzes midchain arginylation of proteins at side chain carboxylates in vivo. Chemistry & biology. 2014;
21(3):331–7. Epub 2014/02/18. [PubMed: 24529990]
16. Piatkov KI, Brower CS, Varshavsky A. The N-end rule pathway counteracts cell death by destroying proapoptotic protein fragments. Proceedings of the National Academy of Sciences of the United States of America. 2012; 109(27):E1839–47. Epub 2012/06/07. [PubMed: 22670058]
17. Saha S, Wong CC, Xu T, Namgoong S, Zebroski H, Yates JR 3rd, et al. Arginylation and methylation double up to regulate nuclear proteins and nuclear architecture in vivo. Chemistry &
biology. 2011; 18(11):1369–78. Epub 2011/11/29. [PubMed: 22118671]
18. Wang J, Han X, Saha S, Xu T, Rai R, Zhang F, et al. Arginyltransferase is an ATP-independent self-regulating enzyme that forms distinct functional complexes in vivo. Chemistry & biology.
2011; 18(1):121–30. Epub 2011/02/01. [PubMed: 21276945]
19. Wang J, Han X, Saha S, Xu T, Rai R, Zhang F, et al. Arginyltransferase is an ATP-independent self-regulating enzyme that forms distinct functional complexes in vivo. Chemistry & biology.
2011; 18(1):121–30. Epub 2011/02/01. [PubMed: 21276945]
20. Mihaly Z, Kormos M, Lanczky A, Dank M, Budczies J, Szasz MA, et al. A meta-analysis of gene expression-based biomarkers predicting outcome after tamoxifen treatment in breast cancer. Breast cancer research and treatment. 2013; 140(2):219–32. Epub 2013/07/10. [PubMed: 23836010]
21. Gyorffy B, Stelniec-Klotz I, Sigler C, Kasack K, Redmer T, Qian Y, et al. Effects of RAL signal transduction in KRAS-and BRAF-mutated cells and prognostic potential of the RAL signature in colorectal cancer. Oncotarget. 2015; 6(15):13334–46. Epub 2015/06/03. [PubMed: 26033452]
A uthor Man uscr ipt A uthor Man uscr ipt A uthor Man uscr ipt A uthor Man uscr ipt
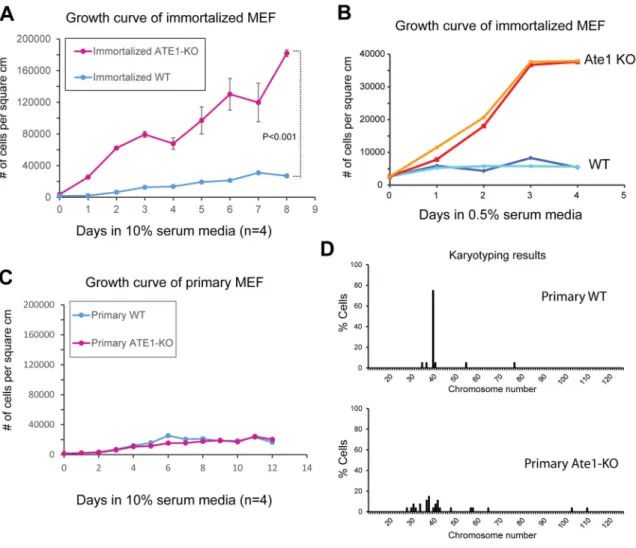
Figure 1. Ate1 knockout cells exhibit density-and serum-independent growth and early onset of chromosomal aberrations
A. Growth curves of immortalized WT and Ate1 KO MEF in normal culture media containing 10% serum (n=4). B. Growth curves of immortalized WT and Ate1 KO MEF grown in low serum conditions (0.5% serum). A representative curve from duplicate experiments is shown (see also Fig S1 for a repeat experiment using independently derived immortalized WT and Ate1 KO. C. Growth curves of primary WT and Ate1 KO MEF in normal culture media containing 10% serum (n=4). D. Karyotypes of primary wild type (WT) and Ate1 KO mouse embryonic fibroblasts freshly derived from E12.5 littermate embryos. Numbers on the y axis represent percentages of cells with each chromosome number shown on the x axis. Karyotypes in 20 WT cells and 27 KO cells were counted. In A and C, Error bars in all panels represent standard error of mean (SEM). In A, p value was calculated by Student’s t-test using data at the final time point (day 8).
A uthor Man uscr ipt A uthor Man uscr ipt A uthor Man uscr ipt A uthor Man uscr ipt
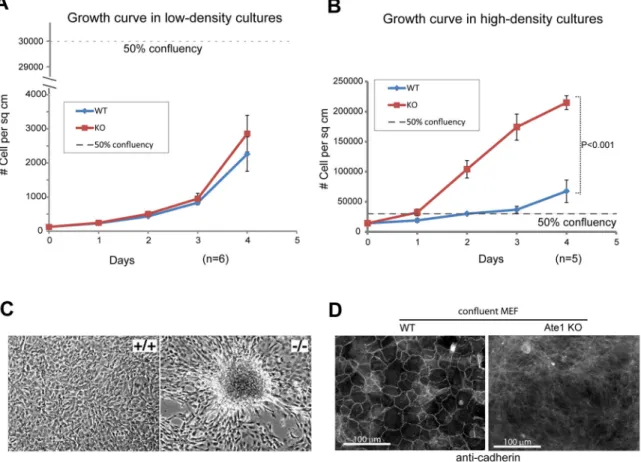
Figure 2. Ate1-KO cells grow differently than WT cells in dense cultures
A. Growth curves of WT and Ate1-KO MEF in low-density cultures (starting with ~30 cells/cm2). B. Growth curve of WT and Ate1-KO MEF in high-density cultures (starting with ~14,000 cells/cm2). In both panels, dashed line indicates the point of 50% confluency, when cells would cover an estimated half of the area of the culture plates. In both panels, error bars represent SEM, n=6 and 5 in A and B, respectively. In B, p value was calculated by Student’s t-test of data at the final time point (day 4). C. Representative phase contrast images of overconfluent cultures of WT and Ate1-KO MEFs. While WT cells remain a monolayer, Ate1-KO cells tend to cluster and form foci. D. Representative fluorescence images of high density cultures of WT and ATE1-KO MEF stained with a pan-cadherin antibody that reacts with most common cadherin isoforms including N-cadherin (see also (9)).
A uthor Man uscr ipt A uthor Man uscr ipt A uthor Man uscr ipt A uthor Man uscr ipt
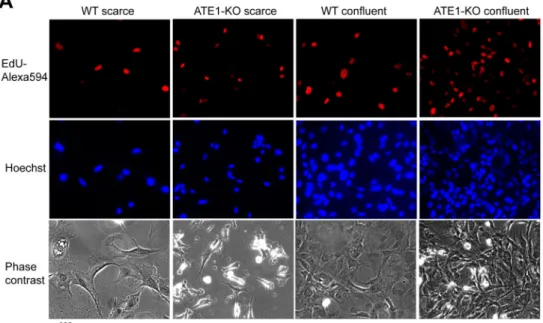
Figure 3. Ate1-KO MEF have higher numbers of actively proliferating cells in near-confluent cultures
A. Representative images of WT and Ate1-KO MEF in scarce (<20% confluency) and confluent (>90% confluency) cultures. All cells were incubated for one hour with EdU, which was then label with Alexa 594 (red) to indicate actively proliferating cells. Cell nuclei were stained with Hoechst 33342 (blue). B. Quantification of cell cycle stages identified by EdU and Hoechst 33342 staining in randomly taken fields of view at 20x magnification in different culture conditions as indicated (n=5 for near-confluent WT and ATE1-KO cells, n=10 for scarce ATE1-KO, and n=8 for scarce WT). Error bars represent SEM. The p value was calculated by Student’s t-test.
A uthor Man uscr ipt A uthor Man uscr ipt A uthor Man uscr ipt A uthor Man uscr ipt
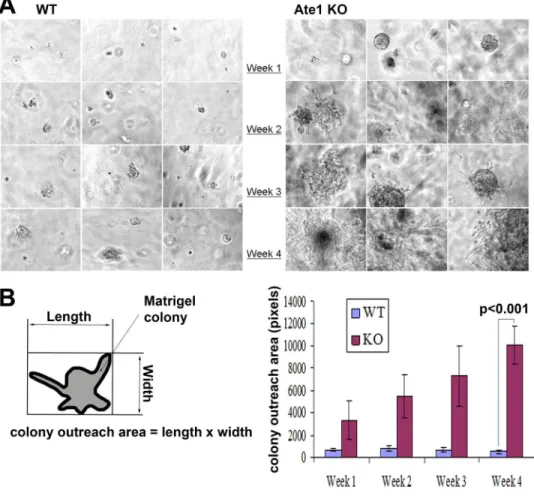
Figure 4. Ate1-KO MEF grow large colonies in Matrigel
A: Representative phase contrast images showing the morphology of the WT (left panel) and Ate1-KO cells (right panel) grown in Matrigel over the course of 4 weeks. B: Quantification of the colony outreach area (as shown in the diagram on the left) of the WT and KO Matrigel colonies. Error bars represent SEM. The p value was calculated by Student’s t-test.
A uthor Man uscr ipt A uthor Man uscr ipt A uthor Man uscr ipt A uthor Man uscr ipt
Figure 5. Ate1-KO MEF are capable of forming tumors in xenograft studies
Top: Photographs of mice 6 weeks after the injection of 2 million of immortalized WT and Ate1-KO MEFs on the left (WT) and right (KO) flanks. The injection sites are indicated with the asterisks. Each mouse formed visible solid tumor on the right side and showed no detectable growth on the left. Bottom: quantification of tumor size each week post-injection.
n=5.
A uthor Man uscr ipt A uthor Man uscr ipt A uthor Man uscr ipt A uthor Man uscr ipt
Figure 6. Reintroduction of recombinant Ate1 partially rescues the abnormal growth and tumorigenicity of Ate1-KO cells
A. Left: growth curves of Ate1-KO cells stably expressing GFP (control) or recombinant GFP-fused Ate1-isoform 1 or −3; right: growth curves of Ate1-KO cells stably expressing GFP (control) or recombinant GFP-fused Ate1-isoform 2 or 4 (n=6 for all groups of cells).
See also in Fig. S3 for the levels of exogenously expressed recombinant Ate1 in KO cells comparison to the endogenous Ate1 in WT cells. B. Left: representative images showing the subcutaneous tumors formed after injection of 2 million Ate1-KO cells stably expressing either Ate1-GFP (left side) or GFP (right side) after 5 weeks. Tumors are outlined on each
A uthor Man uscr ipt A uthor Man uscr ipt A uthor Man uscr ipt A uthor Man uscr ipt
side for easier visualization. Right: quantification of the tumor growth over time. Data for Ate1-1 (top; n=3) and Ate1-3 (bottom; n=6) are shown (see Fig. S4 for data on Ate1-2). In all panels, error bars represent SEM. The p values were calculated by one-way Multivariate Analysis of Variance (MANOVA).
A uthor Man uscr ipt A uthor Man uscr ipt A uthor Man uscr ipt A uthor Man uscr ipt
Figure 7. Ate1 level is reduced in human cancer and inversely correlates with metastatic progression and survival
A. Representative images (left) and quantifications (right) of Ate1 protein levels in tissue arrays of human kidney and colon cancer. Matched normal and malignant tissues from the same patient were quantified in triplicates and averaged over the entire array. Error bars represent SEM, n=40 (colon) and 39 (kidney). B. The mRNA levels of Ate1 in different types of human kidney tumors calculated from the series matrix of GSE11151. Error bar represents SEM. The p-value was determined by one-tailed Welch’s t-test, denoted in the figures as: *** for p<0.001, ** for p<0.01, and * for p<0.05. C. Kaplan–Meier survival plots in colon cancer patients with high and low levels of Ate1 mRNA of were generated utilizing a previously established database (21). The following datasets were used: GSE12945
A uthor Man uscr ipt A uthor Man uscr ipt A uthor Man uscr ipt A uthor Man uscr ipt
GSE14333 GSE17538 GSE31595 GSE33114 GSE37892 GSE38832 GSE39582 and GSE41258. Cox proportional hazards regression analysis was performed as described in (20). D. The mRNA level of Ate1 in normal, benign, and malignant prostate tissues obtained from microarray data deposited in GEO database. P values (student’s t test) are indicated for significant differences between the groups (N.S., non-significant (P>0.1)).
A uthor Man uscr ipt A uthor Man uscr ipt A uthor Man uscr ipt A uthor Man uscr ipt
Figure 8. Down-regulation of Ate1 can affect tumorigenesis and metastasis
through multiple pathways involving known arginylation protein targets with functions in apoptosis, mitosis, chromatin structure, cell motility and adhesions.