DEVELOPMENT OF THE POWER SUPPLY for the
TRANSIT SATELLITE*
Walter C. Scott11* Applied Physics Laboratory The Johns Hopkins University
Silver Spring, Maryland ABSTRACT
This paper covers the development of the Transit Naviga- tion Satellite power system and deals with the silicon photo- voltaic converters, the rechargeable nickel-cadmium batteries, zinc-silver oxide batteries used in an early version, and the static conversion equipment. The requirements and test condi- tions are discussed and data are presented summarizing the telemetered data from the orbiting vehicles.
I. INTRODUCTION
Project Transit is the code name of a program aimed at achieving a world-wide, all-weather navigation system. The system is based on the fact that the orbital parameters of an earth satellite can be determined by analyzing the doppler fre- quency shift in radio frequency signals transmitted by the satellite. Then, conversely, if the orbital parameters are known, an observer's location can be accurately determined.
The development of this concept into a complete navigation sys- tem is being pursued by the Applied Physics Laboratory, The Johns Hopkins University, under the sponsorship of the Depart- ment of the Navy.
Basically the program can be divided into three problems:
(a) to develop a suitably instrumented, highly reliable, long- life satellite which will be capable of transmitting two or more constant frequency radio signals and which has memory capa- bility so that the orbital parameters of the satellite can be obtained from the satellite by a remote observing station as
·* Submitted for publication to the American Rocket Society, January 6, 1961.
x-x Project Engineer, Space Power Systems, Space Systems Development Group.
part of the navigation process, (b) to develop the satellite tracking techniques and ground station equipment necessary for determining the orbit parameters and (c) to develop the mathe- matical methods for performing the navigational calculations with the highest possible accuracy with reasonably simple equip- ment. V'Jhen these problems have been solved, navigation by use of earth satellites will be a reality. This will involve the deployment of four simultaneously orbiting satellites in four different orbits. The design objectives for these payloads are reliable performance for five or more years, low weight,and minimum cost consistent with required performance. Toward meeting these objectives, work on hardware has been under way since November 1958. This work has involved the design and fabrication of experimental payloads to develop the technology and hardware necessary to meet the requirements of the opera- tional system. The satellites are all designed for operation in 500-nautical-mile circular orbits.
Three attempts have been made to place such experimental payloads in orbit. The first, in September 1959, was unsuc- cessful because of a malfunction of the launching vehicle.
The second attempt, known as Transit IB, was successfully launched in April I960 into an orbit inclined at 51·3° to the equator and with a perigee of 201 nautical miles and an apogee of 404 nautical miles. The second successful launching ocur- red in June I960 when Transit 2A was placed into a 66.7° orbit with a perigee of 336 nautical miles and apogee of 578 nautical miles. Hardware is currently being designed and built for other launchings. All of the Transit payloads to date have been basically spherical structures of 36 inches in diameter with a ring of solar collectors around the equator. The 265- pound IB and 225-pound 2A vehicles have been spin stabilized during injection into orbit and have been despun by mechanical and/or magnetic means. See Figs. 1 and 2.
II. THE TRANSIT 1A AND IB POWER SUPPLIES One of the most interesting and challenging problems associated with the development of a space vehicle is that of providing electrical power for operation of the electronic in- strumentation. Here will be presented the methods used toward that end in the Transit Program, some of the problems encoun- tered, and the results obtained to date. While most of the material presented will deal with the Transit 2A system, for completeness a brief description will be included of the other payloads.
50
At the beginning of the hardware program, the low power requirements, the schedule, the allowable weight and other con- siderations led to the decision that the first vehicle would be powered by zinc-silver oxide secondary batteries. The re- quirement was for 2e2 watts for ninety days. Subsequent changes in the program resulted in the introduction of a second power supply consisting of silicon solar cells and sealed nickel-cadmium batteries. Since the payload instruments con- sisted of several independent systems, it was possible to split the system into two groups, the first being powered by the zinc- silver oxide batteries and the second group powered from solar energy. This was the basic configuration used in the Transit 1A and IB vehicles. Figure 3 indicates the simplified block diagram of the power supply, and Fig. 4 the characteristics of the solar power supply as a function of attitude with respect to the sun. It may be seen from the block diagram that the electronics systems are (a) and (b) the "ΒΜ and "Crt doppler transmitters, each consisting of a stable oscillator and sev- eral stages of frequency multiplication and power amplification;
(c) the telemetering system; and (d) the command switching system. The latter has two functions: (a) to provide a mecha- nism for turning off the r-f transmitters and (b) to provide a means for intermittently switching the loads which are nor- mally connected to the silver zinc battery to the solar power supply at the expiration of the battery life. It may be seen that for this early system intermediate voltage taps are pro- vided on the batteries to supply the various voltages to the loads. The command switching system is powered from a separate battery which is continually trickle-charged from the main nickel cadmium battery-solar panel bus. It will be noted that thermostats are provided to protect the main battery from ex- cessive temperatures caused by overcharge by interrupting the charge should the battery overheat. The block diagram also in- dicates the power supply data which is telemetered: (a) solar panel temperature, (b) main battery temperature, and (c) so- lar power supply output current. The data received on these channels and the performance of the system are reviewed in Section V.
In Table 1^some of the basic characteristics of the Tran- sit IB power supply are listed.
Figures 5 and 6 illustrate power supply hardware for the Transit 1A and IB programs.
III. THE TRANSIT 2A POWER SYSTEM
The Transit 2A power system, while similar to the 1A and IB systems, has many significant electrical and mechanical changes. It is a larger system to meet increased power require- ments. See Fig. 7. The design of this system will now be con- sidered.
The system can be divided into four areas: generation, storage, conversion and regulation, and command switching.
Figure 8, the simplified block diagram for the system, indi- cates the interconnection of these parts of the system.
Fower Generation, Solar Power Supply
The system which has been selected for providing energy to the instrumentation is based on the use of silicon photo- voltaic cells for converting solar energy directly to elec- tricity. Many descriptions are available of the physics of this process. The engineering problems associated with apply- ing these devices to the system will be considered here. These include the display of the cells to solar radiation, protection of the cells from adverse environmental conditions including temperature extremes, and matching of the load to the generator for optimized power transfer.
Solar power supplies of the type under consideration can be of two classes: those designed to be maintained with a fixed geometric relationship to the sun—termed oriented; and those which are capable of satisfactory operation in any posi- tion relative to the sun—termed unoriented. The latter, of course, requires more solar cells but does not require attitude control. Because of the relatively modest power requirements of the Transit system,it has been elected to design unoriented systems.
Because of the nature of the instrumentation, there are several frequencies which must be transmitted and received by the payload. To meet this requirement, the two hemispherical shells which enclose the payload have been made into spiral slot antennas. These antennas limit the surface area on the vehicle which is available for deploying solar cells. Because of this and other considerations the solar cells on the Tran- sit payloads have been arranged on a polyhedrial ring or belt around the equator of the satellite as illustrated in Fig. 2.
The ring is split into two semi-circular sections which are separated from each other by two seven-degree sectors which
52
provide access to electrical test plugs. Both sections of the ring are independent structures and very largely independent thermal systems. The semi-circular section is divided into six 13-1/2 degree sectors, each providing three flat surfaces for mounting solar cells. Each sector is in turn composed of two aluminum honeycomb panels meeting at the equatorial plane.
The structure is split in this manner to accommodate a track at the equator to support the cables of a despin mechanism, part of which is shown in the center of Fig. 20 This mechanism is used to remove spin energy after the payload is in orbit,
Unlike the Transit 1A and IB solar panels, which used quartz glass protective windows, the 2A design was based upon the use of 6 mil, optically treated, glass slides mounted on the face of each individual cell. The reason for this change was primarily thermal. With only a limited area available for solar cells and with increased power requirements, it was es- sential to utilize the area formerly used as a thermal radiat- ing surface for the old design. This is the white area around the equator of the satellite shown in Fig. 1. The glass slides cemented to the solar cells make this possible by lowering the equilibrium temperature as determined by thermal radiation balance so that the supplemental radiating surface is not re- quired. Heat is transferred by a combination of conduction and radiation paths throughout the solar power supply ring sc that those panels which are illuminated are partially cooled by ra- diation from the panels which are not illuminated.
The glass slides which were selected have an ultra-violet absorption filter and an anti-reflection coating on the inner face. Since the cells are not responsive to the ultra-violet, little loss is introduced by the filter which serves the pur- pose of protecting the epoxy cement used to bond the glass to the cells. The glass slides also afford some mechanical pro- tection to the thin active layer on the solar cell face, al- though their main function is temperature control.
Having defined the type of basic geometry and thermal de- sign, the next problem is to determine the system voltage and from that the number of solar cells to be used in each series circuit. Since in this design the generator-battery system is to be followed by conversion equipment ahead of each load, the system voltage is reasonably flexible. The determination was based primarily upon the geometry, using a module of five
series-connected cells as the basic building block. Each flat surface is capable of supporting a minimum of 10 such modules or shingles. As is true of most design problems, the determina- tion of the system voltage is a compromise involving several
factors. These include the number of solar cells to be con- nected in series in each circuit, the operating voltage to be used for the solar cell under load, the temperature range for which the system is to be designed, the number of nickel-cad- mium cells to be series connected for the battery, their charg- ing voltage under the expected conditions of charging rate, load current, depth of discharge, per cent overcharge, tempera- ture, design life, and other battery characteristics, and the power system voltage drops such as those associated with isolat- ing diodes, telemetering sensors, and cabling· These factors are interrelated by the requirement that the solar power supply voltage must be equal to the battery charging voltage plus the system voltage drops. It should be observed that the system voltage is established by the nickel-cadmium battery. Figure 9 illustrates the performance characteristics of a typical solar cell circuit, in this case the actual numbers apply to the Tran- sit 2A design. It will be noted that the current versus volt- age characteristic approaches a rectangle in which part of the curve is that of a constant current generator, but at higher cell voltages it becomes a more nearly constant voltage device.
Our interest will be with the "constant current11 part of this curve.
For a battery charging application, such as the one being considered, the operating point on the current versus voltage characteristic is determined as noted above by the battery volt- c ^e. For fixed conditions of lighting and temperature, the charging current will be nearly the same if the solar circuit has just enough series-connected cells to charge the battery or considerably more than this number. This is true for "constant current" operation because the battery voltage essentially de- termines the operating point on the solar cell current versus voltage curve. It is apparent that the amount of available en- ergy is quite different in the two cases, however, so the utili- zation of the cells is quite different. It should be noted that current versus voltage curve is actually a family of curves if the intensity of the light is varied (without changing the spec- trum of the source). Above some minimum lighting intensity, as the intensity is changed the open circuit voltage will remain constant but the short circuit current will vary in direct pro- portion to the luminous flux density. This is true whether the flux density changes because the intensity of the source is changed or the angle of incidence is changed so that in effect the flux density is changed. Because of this fact, the output current for a battery charging application, neglecting reflec- tion losses, will be directly proportional to the cosine of the angle of incidence of the light. The reflection loss depends upon the specific design. For the Transit 2A solar panel design
54
the output current varies approximately as the (cosine)-*-*^ of the angle of incidence. If the spectrum of the light source is changed, the performance will also change, since the response of the solar cell is different at different wave lengths. For purposes of comparing the performance of a solar power supply under two lighting conditions in which the spectrum of the light changes, the integral of the products of the spectral re- sponse of the solar cells (per cent response versus wave length) and the .spectrum of the source (per cent of total energy versus wave length) for the two cases can be compared as a ratio. The ratio will be equivalent to the ratio of efficiencies of the solar cells under the two conditions.
From the foregoing, it may be seen that in a practical sys- tem the system voltage is largely determined by the battery and that the output current of a solar panel varies as the (cosine)n of the angle of incidence of the light, where n is typically about 1.5. No special provisions must be made in operating cir- cuits in parallel for load division. It is common practice to use a diode to prevent discharge of the battery through reverse currents flowing in unilluminated panels. If the battery is grounded on one end, as in the Transit power system, this diode, if located in the opposite lead of the solar circuit also pro- tects the system against a fault, should the solar circuit be grounded because of damage.
As indicated previously, the effectiveness with which the solar cells are used is largely determined by the ratio of the number of solar cells per battery cell, or, more directly by the volts per solar cell operating point that this ratio re- sults in. In Fig. 9 the power versus voltage is also plotted.
It may be seen that this curve has a rather sharp maximum. Be- cause of two factors, it is difficult to operate always at this maximum power point. These are changes in solar cell tempera- ture and changes in the system voltage as the battery parameters change. As the solar cell temperature rises, the entire volt- age versus current curve essentially shifts to the left and the maximum power point shifts with it. This effect is also indi- cated in Fig. 9· The open circuit voltage changes by 0.005 volt per cell per degree C. Because of the uncertainties in the predicted temperatures for a new design, the Transit power system design is very conservative and uses a relatively low value of 0.337- to 0.360-volt per solar cell for the 2A system so that the design is capable of satisfactory performance over a very wide temperature range. The price for doing so is 3 to 4 per cent more solar cells than for an optimized system.
The other numbers pertaining to the Transit 2A power sup- ply are as follows:
Number of solar cells
per circuit 50 (10 five-cell modules) Solar cell voltage
during battery charging 0.337- to 0.360-volt per cell Solar circuit voltage
Number of nickel-cadmium cells
18 to 19· 25 volts during charging
25 volts open circuit 12
Nickel-cadmium battery
voltage 16.8 to 18.0 volts during charging
14o4 volts under load System voltage drops
(See also Table II)
0.75 volt diode
O.5O volt telemeter end in- strument, negligible cabl- ing, etc.
Having established the power system operating voltage and solar cell operating point, the next problem is to obtain suf- ficient power for all anticipated satellite conditions of load- ing, orientation to the sun and per cent of sun time per orbital period. This is achieved by paralleling a sufficient number of the series-connected solar cell circuits arranged in a suitable geometric configuration to meet these requirements. Since the system is to be unoriented, the geometry should be such as to give nearly uniform output for all orientations with respect to the sun. The orientation characteristics for the Transit 2A satellite are indicated in Fig. 10.
The shape of this curve for the polyhedrial ring design previously described is determined by the number of circuits on each flat surface and the angles these surfaces make to each other. As illustrated in Fig. 2 each sector of the ring has three flat surfaces subtending an arc of 13-1/2 degrees. Each sector is formed of two mechanical units such as shown in Fig.
11. The three flat surfaces are arranged with one parallel to the polar axis and the other two each at 49 degrees to the
polar axis. This angle was selected to give a nearly uniform output and the highest minimum output as a function of angle of the sun vector.
This curve was initially determined analytically and then checked by actual measurement· The analytical method is based on computing the number of fully illuminated solar cell cir- cuits on each solar panel and the angle of incidence for that panel for each position of the satellite relative tc the sun.
From the current versus voltage characteristic of the solar cell circuits, the output current for normal incidence at a given temperature and lighting condition can be determined.
The lighting condition usually specified is that equivalent to sunlight at the earth's surface on a cloudless day and of such intensity as to give a total radiant energy of 100 milliwatts per square centimeter of normally illuminated area. The out- put current corresponding to these normal incidence conditions is multiplied by the cosine of the angle of incidence for each illuminated circuit. This yields a number which would be equal to the output of that circuit if the cosine law applied directly.
As previously noted, this must be corrected for reflection los- ses caused by the optical coatings applied to the cells. This correction is determined experimentally and is expressed in curve form as the ratio of actual output tc cosine law output versus angle of incidence. The cosine ]εν; values are then multi- plied by this correction factor to obtain the actual output cur- rent for each illuminated circuit. The arithmetic sum of these output currents is equal to the system output current for the orientation considered.
To determine the output current of the system in a near earth orbit, this current is multiplied by the ratio 100/140 which is the ratio of the milliwatts of energy at the earth's surface to that in orbit and then multiplying by 0.85 which is the correction factor generally used to correct for the dif- ference in the spectrum of the light at the earth's surface and in orbit. ^ This number has been determined by the method pre- viously discussed (page 6) using the solar cell spectral re- sponse and light source spectrum curves.
The continuous (or equivalent duty cycle) load which the system can support can be determined by the following method:
1
This correction factor was correct for cells manufactured in 1959 and early I960. Current production has a different spectral response. The correct multiplier has not been established.
It has been customary in the Transit program to assume that the system capability is determined by that output power cor- responding to the least favorable orientation of the satellite with respect to the sun. This is a pessimistic approach since the satellite cannot remain in any one orientation for any ex- tended period of time because of the presence of a strong permanent magnet in the satellite which causes it to follow the earth's magnetic, field and thus tumble twice per orbit.
The allowable load is computed as follows: Minimum output current x minimum sun time per orbit = load in sunlight x sun time per orbit + l °a d in dark x dark time per orbit.^
battery efficiency
For most systems the load in the light period of the or- bit and the load in the dark period of the orbit will be some- what different. Solving the above for the Transit 2A yields the following:
750 ma x 65 minutes + load in sun x 65 minutes load in dark x 35 minutes . n
+ ; * or average load = 450 ir*a or 80# battery efficiency
7.5 watts.
Since the sunlight time per orbit period varies as the orbit precesses around the earth, the amount of energy available to the system will also vary. This is a problem, since normally this excess energy is dissipated in the battery as heat on over- charge. It is difficult to prevent overcharge since the charg- ing voltage does not exhibit an appreciable change when the cell is fully charged. The approach used in the Transit pro- gram has been to try to sense the temperature rise in the bat- tery by a thermostat which interrupted the charging current on temperature rise to protect against prolonged overcharge. Some difficulty has been experienced with this technique. If the thermostat "set point" drifts with time, the result can be quite serious since that switch is in series with the main power circuit.
Transit 2A Battery
The battery serves two purposes, to store energy for re- lease to the system when the satellite is eclipsed by the earth and to establish the operating voltage for the power system.
The battery used in this system is composed of twelve series connected, hermetically sealed nickel-cadmium cells. Figure 12 shows the general construction of the battery assembly. Be- cause of the thermal requirements of the payload. the battery
58
has been designed to act as a large heat sink for storing the heat losses which occur within it. Removal of this heat is primarily by radiation to the structure. This is dene to re- duce the short term temperature variations of the payload electronics to a minimum.
The Transit 2A battery uses cells which have a nominal capacity of four ampere-hours. The maximum depth of discharge for normal operation is approximately 5 per cent. The maximum charging rate is approximately 420 ma. The depth of discharge and charging rate can be changed by remote command by operating the telemetering system. Among other things, this provides a means of preventing prolonged overcharge of the battery par- ticularly for orbital conditions in which dark time is short.
As a backup protection, as previously noted, a thermostatic switch is provided in series with the charging circuit to dis- connect the battery from the solar power supply if the battery temperature exceeds 100°F. By command, the thermostat can be shunted should the entire payload temperature exceed 100°F, so that the battery could not cool down in time to prevent com- plete discharge. Since the critical temperatures are available via telemetering, control can be maintained from the ground.
It is anticipated that this system will not be required or used in future designs since our experience will be quite help- ful in accurately predicting the temperatures of the parts of the system under all expected conditions, enabling us to de- sign such that thermostatic control will not be necessary.
Transit 2A Voltage Regulator and Converters
All loads are supplied through a voltage regulator and dc-to-dc converters of which there are five in the system, one for each electronic subsystem. The regulator is a magnetic amplifier device which is designed to boost the main bus volt- age so that the power delivered to the converters is at 17.7 volts + 2 per cent instead of the 14.2 to 18.0 volts available at the bus. The transistorized converters (Fig. 13) are non- regulated and provide the various voltages from 1.35 to 22 volts required by the electronic systems. The input to each converter is fused with two paralleled 1.0 amp fuses to pro- tect the system against short circuit should the converter in- put circuit fail.
IV. POWER SUPPLY TESTING PROGRAM
Many tests have been and are being run to determine the characteristics of the components used or which may be used in future payload power systems. Most of these tests are intended to provide the data necessary for design. Included in this category are battery tests on various types of cells of interest to investigate such parameters as cell efficiency, cycle life, effect of temperature, charge and discharge voltages, self dis- charge, and effect of overcharge. Many tests have also been conducted to determine the characteristics of solar cells, cover glasses, adhesives, and substates. Other components such as fuses, relays, thermal switches and circuits for regulation, power conversion and automatic control have been investigated.
In addition to these basic tests, the flight hardware for each payload undergoes the following three types of tests:
(a) design evaluation, (b) component acceptance, and (c) system level acceptance tests. The evaluation tests are per- formed on prototype hardware, the component acceptance tests are conducted for each flight and spare component or assembly and each complete payload is subjected to system level accept- ance tests. The following are the test conditions and require- ments for each of these types of tests for the solar panels, batteries and converters for the Transit 2A satellite.
Design Evaluation Solar Panels
Honeycomb Panel—Prototype panels were subjected to vibra- tion tests to determine resonant frequencies and mechanical gains at these frequencies. Samples were then vibrated at a resonant point (approximately 1000 cps) with a measured accel- eration of 2/+0g for 15 minutes. There was no evidence of panel degradation. Other panels were subjected to vacuum for 6 hours at 3 x 10"- millimeters of mercury. The chamber was evacuated at c rate to approach the decrease in pressure anticipated dur- ing launch. No problems were observed. These panels were then subjected to temperature cycle test between -65° ^nd +20C°F.
No degradation was observed.
Panel with Solar Cells—Sample panels were subjected to vibration tests in three mutually perpendicular planes at the following levels:
5g(rms) sinusoidal 5 to 50 cps 7g(rms) sinusoidal 50 to 1000 cps 9g(rms) sinusoidal 1000 to 2000 cps
60
The above frequencies were swept at a rate of one-half octave per minute. The panels were also subjected to a Gaussian ran- dom vibration test applied at 0.05g2(rms)/cps at 20-2000 cps for two minutes in one plane only.
Panels were illuminated during this test and short cir- cuit current was monitored to check for defective solder joints.
Panels were then subjected to acceleration tests in six planes at 24g for two minutes in each plane. This was a non- operating test.
The test samples were then exposed to 200°F at atmospheric pressure for eight hours during which time they are illuminated and short circuit current was observed. This was followed by -65°F at sea level for eight hours. This was also an operating test. The panels were then cycled between 180° and -40 F under high vacuum conditions for 48 hours. The final prototype test is exposure for thirty hours to 110°F sea level pressure air at 95 per cent relative humidity to simulate the environment on the launching pad.
The electrical performance of the solar cells were checked between each test using a calibrated tungsten filament light source. A careful mechanical inspection was also given between each step.
Batteries
The design evaluation tests for batteries are similar to that of the solar panel. The specification for vibration and acceleration tests are the sane. The temperature tests are limited to +30° to 110°F, however, and there is no humidity test required.
Converters
Again the design evaluation tests for converters and reg- ulators are similar to the solar panels except for the tempera- ture limits which are -40° to +150°F and the elimination of the humidity tests.
Component Acceptance Tests Solar Panels
Acceptance tests of the solar cell hardware start with the individual cells each of which is tested for short circuit
current, open circuit voltage, and current at a specified load voltage under illumination by a calibrated tungsten lamp·
Cells which are suitable in these respects are soldered to- gether in five cell shingles which are then mechanically tested as a simple beam suspended at the ends and loaded in the center with a 25O gram weight. Shingles are checked for short circuit current, open circuit voltage and current at the anticipated voltage under load. Acceptable shingles are cemented to the honeycomb panel and the assembly work is completed. The fin- ished panel is tested for output current and voltage from short circuit to open circuit for each circuit. All minor defects such as surface pits in the solar cells, etc· are noted. Next each panel is given the following vibration tests in each of three mutually perpendicular planes:
3g(rms) sinusoidal 5 to 50 cps 5g(rms) sinusoidal 50 to 1000 cps 7g(rms) sinusoidal 1000 to 2000 cps
The above swept at a rate of one-half octave per minute. The fixture used for the vibration tests is shown in Fig. 14.
Panels are also subjected to a Gaussian random vibration test applied at 0.05g (rms)/cps at 20-2000 cps for two minutes in one plane only.
These tests are operating tests as described before and are followed by a recheck of the open circuit voltage, short circuit current and load current at specified voltage for each circuit using a calibrated light source. All parts are then carefully examined for mechanical degradation.
The next test is an acceleration test in three planes but otherwise identical to the acceleration test described above under the design evaluation tests. This is followed by a ther- mal shock test in which the panels are heated to +l65°F at sea level and immediately placed in a refrigerator at -65°F at sea level. The panel is then returned to the oven for the reverse shock.
The electrical performance is again checked and the panel is inspected for damage. Panels passing these tests are then assembled into semi-circular structures as previously described and electrically tested for insulation resistance and correct wiring.
62
Batteries
The acceptance tests for the batteries also begin with the individual cells. Upon receipt from the manufacturer each cell has test leads soldered on, an identifying number painted on and is then carefully cleaned. The cells are then charged at the eight hour rate for eleven hours by filtered, constant cur- rent power supplied. The cell voltages are monitored during charging, and overcharging. Cells which exhibit charging volt- ages in excess of 1.45 volts are not considered flight-worthy.
The cells are individually discharged at the eight hour rate and the ampere-minute stored capacity is determined. Tnis pro- cess is repeated five times. Cells used in a flight battery must all fall within five per cent of the same capacity. Fol- lowing the final discharge to 1.0 volt, each cell is brushed with a solution of phenolphthalein to test the seals for evi- dence of electrolyte leakage. The cells are then washed and dried and given a very small charge (typically the eight hour rate for twenty seconds) to enable the cell to exhibit an open circuit voltage of 1.20 volts or higher. The voltage is measured and recorded and rechecked periodically for ten days to two weeks. Cells to be used in flight batteries must not ex- hibit a change in cell voltage during this room temperature test of more than 0.003 volt. Experience has shown that cells fail- ing to pass this test have excessive self-discharge and are usually internally contaminated. Such cells almost invariably develop internal shorts in time. Cells are then continuously overcharged for 24 hours at a rate 10 per cent higher than the anticipated maximum charging rate in orbit. No electrical or mechanical degradation must result from this test.
The assembled batteries after being checked for insulation resistance and correct wiring are subjected to vibration and acceleration tests which are identical to those indicated for the solar panels. There are no requirements for thermal shock.
All thermal and vacuum tests are made as part of the system tests.
The batteries are then charged and checked for abnormal charging and discharging voltages.
Converters
The voltage regulator and converters are electrically tested for proper voltage, voltage regulation, ripple, harmonic content of ripple, insulation resistance, efficiency and ability to start under load with input voltage switching or on gradual increase in input voltage. These characteristics are checked at room temperature, 20° and 150°F. Each package is then is then submitted to vibration and acceleration tests which are
identical to those for the other components of the power sys- tem. During the vibration test the equipment is operated.
Other thermal and vacuum tests are conducted during the system test.
System Level Acceptance Tests
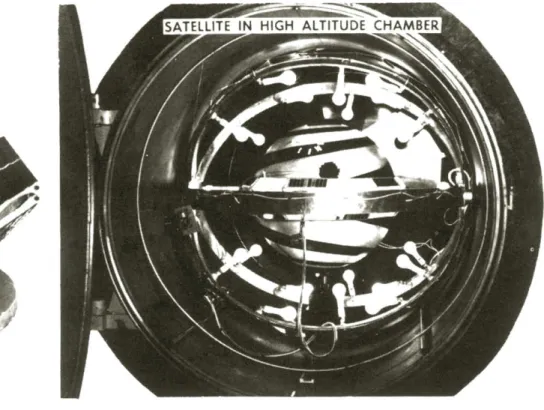
The complete payload is subjected to a vibration test in the direction of the thrust during launch and to the levels indicated for the component tests. All equipment is operating during this test. This is followed by an acceleration test at 15g for two minutes in three planes. This is also an operating test. The satellite is then placed in a controlled temperature vacuum chamber (Fig. 15) and evacuated to approximately 5 x 10~5 millimeters of mercury. With the walls of the chamber at ap- proximately -90°F the satellite instrument tray is held at the maximum expected temperature (approximately 90°F) for twelve hours. It is then cooled to the lowest expected temperature (approximately 30°F) and held for twelve hours. During this period the satellite is operated continuously. The solar power supply is not illuminated and must therefore be replaced by an external filtered and regulated battery charger adjusted to give the anticipated charging current of the solar power supply and cycled to simulate orbit light and dark periods for the cold tests and continuous charge for the hot tests. The tem- perature rise of the battery during this test is determined.
V. TELEMETERED DATA FOR TRANSIT IB and 2A
The following data pertaining to the power supply was telemetered from the Transit IB satellite: (a) the solar power supply output current, (b) the temperature of a solar panel, (c) the temperature of the main nickel-cadmium battery,
(d) the temperature of the shell of the satellite, and (e) the temperature of the instrument tray. The nickel-cadmium battery temperature has varied from 40° to 92°F and in general has been 5° to 10°F higher than the structure temperature because of battery losses during charging. The changes in the tempera- tures have followed the changes in the per cent of sunlight to which the satellite was exposed during each orbital period. In general, the temperatures on IB have run 6° to 9°F lower than predicted. The solar panel temperature has varied from -30°
to +120°F. The solar power supply output current data follow the variations expected because of changes in orientation with respect to the sun. The points fall within the expected range of from 240 to 37Ο ma. Several points were considerably lower.
64
An analysis has established that in each of these cases the intensity of the sunlight reaching the vehicle was low due to the earth's atmosphere. In effect these points were for satel- lite twilight times.
For the Transit 2A, provisions were made for additional telemetering data. The above mentioned temperatures were ob- tained plus the solar power supply output current and the voltages of two solar cell circuits located on the top and bottom of one sector of the power supply. The latter three functions are continuously telemetered whereas the temperatures are read out intermittently during periods of telemetering transmission. The battery voltage can be obtained from the so- lar panel voltage. Many interesting facts have resulted from these data.
In general, for Transit 2A, the nickel-cadmium battery temperature has run 10° to 12°F higher than the structure tem- perature (the increased differential reflects a higher over- charge rate as compared to IB). The battery temperatures have ranged from 54° to 114°F, again generally following the changes in per cent sunlight exposure. The temperatures of the solar panels have ranged from 11° to 118°F while most readings have been between 40° and 60°F. These temperatures fall well within the predicted limits for this design. The solar power supply output current has ranged from 630 ma to 1020 ma. The lower value corresponds to an orientation in which the sun's rays are parallel to the equatorial plane of the satellite and in which the despin weights are normal to the sun's rays. In this con- dition two sclar cell circuits are covered by the weights which failed to properly deploy at the time of despin. The output current observed for this orientation agrees very well with the predicted output. The maximum observed current corresponds to orientations of the satellite in which a pole of the satellite faces the sun directly. The presence of a strong permanent magnet in the satellite causes the vehicle to follow the direc- tion of the earth's magnetic field as previously mentioned.
Knowing this and knowing the location of the satellite at any given time permits a determination to be made of the orienta- tion with respect to the sun. Observations of the solar panel voltages which were used to determine the actual orientation have made it possible to check the accuracy of the orientation predictions based on the magnetic effects.
Several interesting telemetering records have been received from Transit 2A as it passed through twilight zones. It has been shown by this data that for this nominally 500 mile orbit the twilight period was 45 seconds. This should be of interest to systems designers in establishing thermal shock test require-
The author acknowledges the work of the many other members of the Satellite Systems Development Group at the Applied Physics Laboratory, The Johns Hopkins University, who have made signifi- cant contributions to the development of the Transit power sys- tem. Acknowledgment is also made of the assistance given by the Power Sources Branch of the United States Army Signal Research and Development Laboratory during the early phases of this work.
66
TABLE I
Transit IB Fower Supply Characteristics Solar Panels
Number of panels
Number of solar cells per panel (series connected)
Total number of solar cells Number of circuits per panel Circuit connections
Blocking diode, each circuit Open circuit voltage per panel
(one sun at air mass zero, normal incidence)
Short circuit current per panel (one sun at air mass zero, normal incidence)
Nominal solar cell efficiency Solar cell bus voltage during
charge
Solar cell voltage during battery charging
Minimum output current of solar power supply when charging in orbit
Maximum output current of solar power supply when charging in orbit
Minimum output power Maximum output power
Total panel weight (24 panels)
24 70 1680 1
all parallel IN 647
39 volts 54 ma 9.5*
20 to 22 volts 0.305 to Ο.342
volt per cell 24Ο ma
370 ma 2.4 watts 7.7 watts 11 lb NiCd Battery
Main Battery Number of cells Cell size
Nominal battery capacity Maximum normal depth of
discharge
Total battery weight Maximum charging rate
15 4.0 amp - hour 78.0 watt hours 4.5%
10.5 lb 25Ο niaor^.
Normal load current 130 ma
Auxiliary or Command System Battery Number of cells
Cell size
Nominal battery capacity
Maximum normal depth of discharge Total battery weight
Continuous charge rate Zinc-Silver Oxide Battery
Number of cells Cell size
Nominal battery capacity Delivered energy in orbit Days of operation in orbit Battery compartment pressure Total battery weight
Total Power Supply Weight
10
2 amp - hour 32.5 watt hours negligible 6 lb
12 milliamps
12
100 amp - hour I92O watt hours 366Ο watt hours 67.5 days 6 psia approx.
44 lb 71.5 lb Table II
Transit 2A Power Supply Characteristics Solar Panels:
Number of panels
Number of circuits per panel Number of solar cells per circuit Circuit connections
Blocking diode, each circuit Total number of parallel connected
circuits
Open circuit voltage (one sun, at air mass zero normal incidence) Nominal solar cell efficiency Solar cell bus voltage during
battery charging
Solar cell voltage during battery charging
Minimum output current in orbit Maximum output current in orbit Minimum output power in orbit
(instantaneous)
Maximum output power in orbit (instantaneous)
Total panel weight (24 panels)
24 3 50
All parallel IN647
72
28.3 volts 9.5^
16 to 18 volts 0.33 to 0.36 volt 750 ma
950 ma 12.6 watts 14.5 watts 12 lb 68
NiCd Battery:
Number of cells per battery Cell size
Nominal capacity
Maximum normal depth discharge Total battery weight
Maximum charging rate Normal load current DC - DC Converters
Number of units
Voltage Regulation Input Output Overall Regulator and
Conversion System Efficiency
Total weight
Total Power Supply Weight Total allowable load
12
4 amp - hour 60 watt hours 8.3#
10 lb
550 milliamps
Λ~ c or
390 milliamps 7.3
1 Regulator 5 Converters +20$
±2%
1%
3.5 lb 25.5 lb 8 wattso
T R A N S I T I B S A T E L L I T E Figure 1
CO
>
n
Co -<
CO Co
T R A N S I T 2 A S A T E L L I T E Figure 2
"B" SYSTEM
P cm
NOTE:
FP INDICATES FLIGHT PLUG TEST POINTS
THERMOSTAT (MAIN NiCd) TO TM BATTERY TEMP
-!"Ν>τ1
|Ν*τΙ
|ΝΊΊ L/l
ιΙ
,Μ
|Γ
CHARGING CURRENT TM TRANSDUCER
COMMAND SWITCHING SYSTEM CONTROL RELAYS
**\
7
THERMOSTAT BY-PASS ^ V W H T
"C" SYSTEM
Γ Ι ' Μ ' Μ Ί Ί Φ Μ Ί Ψ
SILVER ZINC BATTERY
"C" SYSTEM ■ * / POWER TRANSFER ^ - » ^
RELAY »
,lB" MULT.- ^ AMPL.
"C* OSC
HH
^
"C* MULT.
AMPL.
>
n
o
CO Co
Figure 3
TRANSIT I B
POWER SUPPLY CHARACTERISTICS
16
12H
^r
CAPABILITY—100% SUNTIME/ORBIT
NORMAL LOAD
0 15 30
POLE
45 60 75 90
EQUATOR
ANGLE POLAR AXIS TO SUN VECTOR-DEGREES
Figure h
72
\J4
"iWi
'^üEu^i
Figure 5
TRANSIT IB SILVER ZINC BATTERY
>
i
CO -<
Co —I
m
CO
Figure 6
TRANSIT POWER REQUIREMENT GROWTH
<
z
LU LU Ci =>
ο
NOV D J F M A M J J A S O N D J F M A M J J '59 '60
TIME
Figure 7
H-hl·-
e TM
VOLT REG
TM SYSTEM CLOCK CONV.
[ CMD. RECVR.
TRANSIT Π-Α
SIMPLIFIED POWER SYSTEM CONFIGURATION
Figure 8
7h
VJ1
NORMAL OPERATING VOLTAGE RANGE DURING CHARGE
0 0
5 10
10 20
15 30
20 40
25 CIRCUIT 5 0 CELL OUTPUT VOLTAGE
Figure 9
CAPABILITY—100% SUNTIME/ORBIT
ALL EQUIPMENT ON >
o n
NORMAL MODE (TELEMETER OFF)
CO -<
CO
OFF" MODE LOAD (LAUNCHER STANDBY)
0 15 30 45 60 75 90
POLE EOUATOR ANGLE-POLAR AXIS T O SUN VECTOR-DEGREES
Figure 10
TRANSIT 2 A SOLAR PANEL
Figure 11
TRANSIT 2A BATTERY
Figure 12 76
>
n
co ■<
CO -i
m
CO
ΜΜΛΜΜΜΜ** mm
Figure lli
■SATELLITE IN HIGH ALTITUDE CHAMBER!
Figure 15