Kinase Inhibitors Targeting the ERBB/RAS Pathway in 45 Cancer Cell Lines
Zso´fia Pe´nzva´lto´1., Ba´lint Tegze1., A. Marcell Sza´sz2, Zso´fia Sztupinszki1, Istva´n Liko´3, Attila Szendro˝i4, Reinhold Scha¨fer5, Bala´zs Gyo˝rffy5,6*
11st Department of Pediatrics, Semmelweis University, Budapest, Hungary,22nd Department of Pathology, Semmelweis University, Budapest, Hungary,3Gedeon Richter Plc., Budapest, Hungary,4Department of Urology, Semmelweis University, Budapest, Hungary,5Laboratory of Functional Genomics and of Molecular Tumor Pathology, Charite´ Universita¨tsmedizin, Berlin, Germany,6Research Laboratory of Pediatrics and Nephrology, Hungarian Academy of Sciences, Budapest, Hungary
Abstract
Because of the low overall response rates of 10–47% to targeted cancer therapeutics, there is an increasing need for predictive biomarkers. We aimed to identify genes predicting response to five already approved tyrosine kinase inhibitors.
We tested 45 cancer cell lines for sensitivity to sunitinib, erlotinib, lapatinib, sorafenib and gefitinib at the clinically administered doses. A resistance matrix was determined, and gene expression profiles of the subsets of resistant vs.
sensitive cell lines were compared. Triplicate gene expression signatures were obtained from the caArray project.
Significance analysis of microarrays and rank products were applied for feature selection. Ninety-five genes were also measured by RT-PCR. In case of four sunitinib resistance associated genes, the results were validated in clinical samples by immunohistochemistry. A list of 63 top genes associated with resistance against the five tyrosine kinase inhibitors was identified. Quantitative RT-PCR analysis confirmed 45 of 63 genes identified by microarray analysis. Only two genes (ANXA3 andRAB25) were related to sensitivity against more than three inhibitors. The immunohistochemical analysis of sunitinib- treated metastatic renal cell carcinomas confirmed the correlation between RAB17, LGALS8, and EPCAM and overall survival.
In summary, we determined predictive biomarkers for five tyrosine kinase inhibitors, and validated sunitinib resistance biomarkers by immunohistochemistry in an independent patient cohort.
Citation:Pe´nzva´lto´ Z, Tegze B, Sza´sz AM, Sztupinszki Z, Liko´ I, et al. (2013) Identifying Resistance Mechanisms against Five Tyrosine Kinase Inhibitors Targeting the ERBB/RAS Pathway in 45 Cancer Cell Lines. PLoS ONE 8(3): e59503. doi:10.1371/journal.pone.0059503
Editor:Stefan Wo¨lfl, Universita¨t Heidelberg, Germany
ReceivedAugust 21, 2012;AcceptedFebruary 15, 2013;PublishedMarch 29, 2013
Copyright:ß2013 Pe´nzva´lto´ et al. This is an open-access article distributed under the terms of the Creative Commons Attribution License, which permits unrestricted use, distribution, and reproduction in any medium, provided the original author and source are credited.
Funding:The study was supported by the OTKA PD 83154, by the Predict project (grant no. 259303 of the Health.2010.2.4.1.-8 call), by the TAMOP-4.2.1.B-09/1/
KMR-2010-0001 and by the Alexander von Humboldt Stiftung. The funders had no role in study design, data collection and analysis, decision to publish, or preparation of the manuscript.
Competing Interests:The affiliation of Dr Istva´n Liko´ with Richter Gedeon does not alter the authors’ adherence to all the PLOS ONE policies on sharing data and materials.
* E-mail: gyorffy@kmplot.com
.These authors contributed equally to this work.
Introduction
Targeted therapy in cancer treatment refers to the application of special agents acting on specific molecular features of signal transduction pathways involved in the development of the cancerous phenotype. Erlotinib, gefitinib, sorafenib, sunitinib and lapatinib are all clinically used tyrosine kinase inhibitors (TKIs) targeting receptors and downstream members of the ERBB/RAS pathway [1]. Erlotinib and gefitinib are reversible epidermal growth factor receptor (EGFR) tyrosine kinase inhib- itors used in the treatment of non-small cell lung cancer. About 10% of the patients respond to the treatment in the European and Northern American population [2]. Lapatinib inhibits the tyrosine kinase domain of the epidermal growth factor receptor (EGFR) and human epidermal growth factor receptor 2 (HER2). It is approved for the treatment of breast cancer, where the overall response rate to this treatment is 24% [3]. Sorafenib inhibits RAF, VEGFR, PDGFR, Flt-3, c-Kit receptors. The partial response rate is 10%, when it is administered for patients with advanced renal- cell carcinoma [4]. Sunitinib is a small-molecule multi-targeted
receptor tyrosine kinase (RTK) inhibitor that was approved by the FDA for the treatment of renal cell carcinoma (RCC) and imatinib-resistant gastrointestinal stromal tumor (GIST). Objective response rate is 31% in the first line treatment of renal cell carcinoma [5]. Because of the low overall response rates of 10–
47% [6–10], there is an increasing need for biomarkers predicting response to targeted therapy treatment.
Besides pharmacokinetic parameters, a tumor can deploy different molecular mechanisms to achieve resistance against targeted therapy agents: the target molecule may be subject to modification, downstream alterations of the pathway may lead to resistance against an agent targeting an upstream molecule, or other pathways may be activated which alternatively mediate cancer cell survival and proliferation. For example, the T790M mutation of theEGFR gene retains the ability of the receptor to activate the downstream pathway but simultaneously decreases binding of gefitinib and erlotinib to the receptor and thus leads to drug resistance [11].METamplification causes resistance against erlotinib and gefitinib through the activation of alternative
pathways [12]. Interleukine-8 can activate an alternative pathway leading to sunitinib resistance [13]. Mutations of the genes of downstream members of the pathway can also contribute to resistance against targeted therapy agents, as described before in case of KRAS [14], PTEN [15], BRAF [16], and PIK3CA [17].
When a downstream component of the signaling system activates the pathway, inhibition by the blockade of an upstream member was shown to be ineffective. These downstream changes can be used as negative predictors for agents acting upstream of this addictive element of the pathway, as described before for KRAS [18]. If KRAS harbors an activating mutation, agents acting on EGFR will not have any effect on tumor growth [19].
Previous studies have already described that the use of gene expression data, coupled within vitrodrug sensitivity assays, can be used to develop signatures that could classify response to conventional anticancer agents [20,21]. In another study, a panel of cancer cell lines was treated with dasatinib, a multitarget kinase inhibitor, and sensitivity to the drug was measured. In parallel, expression data generated from the same panel of cell lines was used to develop a signature to predict sensitivity to the drug [22].
In a different study, a panel of lung cancer cell lines was used to develop gene expression signatures that predict sensitivity to the EGFR inhibitors gefitnib [23] and erlotinib [24]. Finally, the common significant genes of anin vitro and anin vivostudy were able to predict response to rapamycin [25]. Although focused on single therapeutic agents in one type of cancer, these studies already demonstrated the power of gene expression profiles to predict response to a specific agent.
In this present study, we took a broader approach aiming to identify gene signatures associated with intrinsic resistance against 5 already approved tyrosine kinase inhibitors targeting the ERBB/
RAS-pathway. To obtain new predictive biomarkers, we corre- lated the sensitivity of 45 cell lines representing 15 different cancer entities to expression patterns. The best performing candidate genes were then validated using qRT-PCR. Finally, clinical validation was performed using immunohistochemistry based on tissue microarrays on a set of renal cell carcinomas from patients treated with sunitinib.
Materials and Methods Ethics Statement
The approval number for the sample collection by the National Scientific and Research Ethics Committee (ETT-TUKEB) (Hungary) is#185/2007. General informed consent was obtained before the surgery. The National Scientific and Research Ethics Committee did not request a specific written permission, because, it was a retrospective study, and the patients were handled anonymously.
Cell Culture
We obtained 45 ATCC cell lines. Before selection, the absence of KRAS mutation in the cell lines was confirmed using the Catalogue of Somatic Mutations in Cancer (search done on the 25th of June 2010). The cells were cultured according to the ATCC protocols (http://www.lgcstandards-atcc.org/). Addition- ally, antibiotics (Penicillin-streptomycin, Invitrogen, cat. no.:
15070-063, Amphotericin B, Invitrogen, cat. no.: 15290-026) were added. The cell lines are summarized in Table 1. An overview of the study is presented inFigure 1.
DNA Isolation and Quality Control
DNA was isolated using the Qiagen DNeasy Blood and Tissue Kit (Qiagen, Hilden, Germany, cat. no.: 69506) according to the
product user’s guide. Quantity and quality of the DNA were tested by using a Nanodrop 1000 system (BCM, Houston, TX, USA).
DNA (A260) and protein (A280) concentrations and sample purity (260/280 ratio) were measured and only high quality DNA was used for further analysis. DNA was stored at280uC.
Authentication of Cell Lines
Authentication was performed for cell lines obtained more than 4 years ago from ATCC using short tandem repeat (STR) analysis of 10 specific loci in the human genome and a mouse specific marker. Authentication was carried out by StemElite ID System at the Fragment Analysis Facility, Johns Hopkins University (Baltimore, USA). STR profiles of the applied cell lines were compared to the STR profile database of the Leibniz Institute DSMZ - German Collection of Microorganisms and Cell Cultures (http://www.dsmz.de). All cell lines included in this study were contamination-free.
Resistance Tests
Drugs were used in their commercially available form, and were applied to the cells in 3 concentrations (C1, C2, C3). C1 = 0.1*C2 and C3 = 10*C2. Concentration C2 was deduced from the clinically used doses (seeTable 2).
The MTT assay (Roche, Cat. No.: 11465007001), was used to test the anti-proliferative effect of reagents and cell viability. In each experiment, 2000 cells/well were seeded in 100ml medium onto 96-well plates. After one day incubation, precontrol cells were stained. At the same time, the cultures were treated with all 5 studied drugs at C1, C2 and C3 concentrations. On the fifth day the experiment was terminated and the cells were stained. The absorbance was read with a Thermo Scientific MultiskanH FC.
The absorbance measured at 595 nm was corrected with the background measured at 690 nm. All measurements were repeated three times and for the calculation of the resistance index (RI) values, the averages of the 3 measurements were used.
The resistance index (RI) was computed by the formula [26]:
RI~ N2{Npre Npost{Npre,
where Npre is the medium absorbance value of precontrol (representing the number of cells at the beginning of the treatment), Npost is the medium absorbance value of control (representing the number of cells at the end of the treatment with vehicle treatment only), and N2is the medium absorbance value of treated cells treated with the C2 concentration of the studied drug.
C1 and C3 concentrations were used as internal controls to monitor the dynamic range of the agents. Only cell lines that fulfilled the quality criteria of Npost.Npre and deviation in cell growth within repetitions,15% were included in the evaluation.
Feature Selection
Raw microarray data for the cell lines were generated in the GSK caArray project (ftp://caftpd.nci.nih.gov/pub/caARRAY/
transcript_profiling). caArray was developed using the caBIG compatibility guidelines, as well as the Microarray Gene Expression Data (MGED) society standards for microarray data.
After downloading, the raw.CEL files were MAS5 normalized in the R statistical environment (www.r-project.org) using the affy Bioconductor library [27]. MAS5 ranked among the best normalization methods when compared to the results of qRT- PCR measurements in our recent study [28]. Each cell line was measured on the microarrays by triplicates - in the final step of the
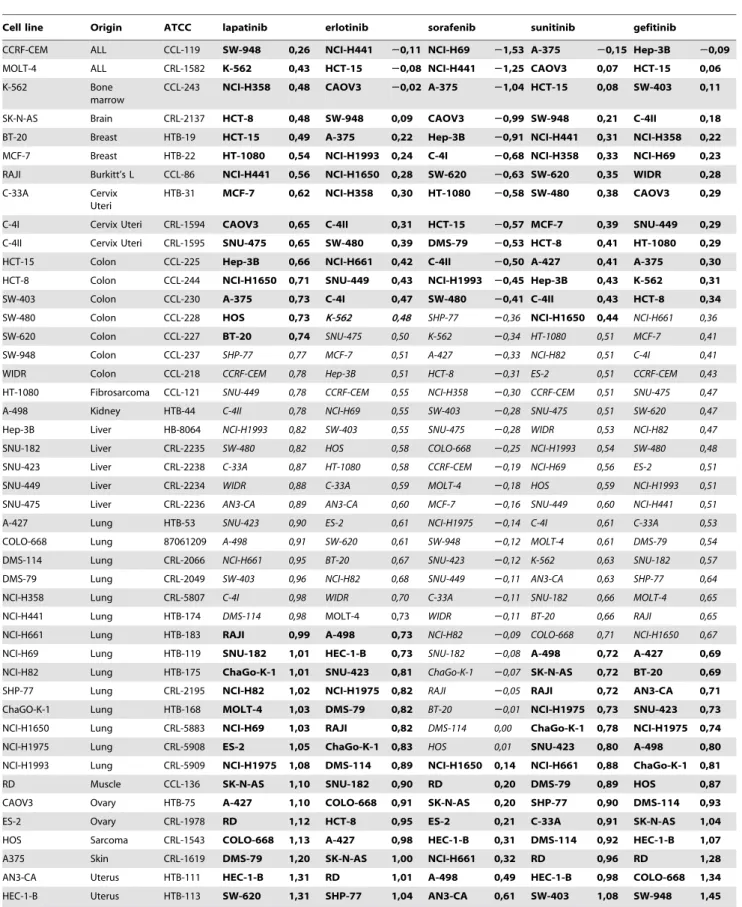
Table 1.Resistance characteristics of the 45 cell lines investigated.
Cell line Origin ATCC lapatinib erlotinib sorafenib sunitinib gefitinib
CCRF-CEM ALL CCL-119 SW-948 0,26 NCI-H441 20,11 NCI-H69 21,53 A-375 20,15 Hep-3B 20,09
MOLT-4 ALL CRL-1582 K-562 0,43 HCT-15 20,08 NCI-H441 21,25 CAOV3 0,07 HCT-15 0,06
K-562 Bone
marrow
CCL-243 NCI-H358 0,48 CAOV3 20,02 A-375 21,04 HCT-15 0,08 SW-403 0,11
SK-N-AS Brain CRL-2137 HCT-8 0,48 SW-948 0,09 CAOV3 20,99 SW-948 0,21 C-4II 0,18
BT-20 Breast HTB-19 HCT-15 0,49 A-375 0,22 Hep-3B 20,91 NCI-H441 0,31 NCI-H358 0,22
MCF-7 Breast HTB-22 HT-1080 0,54 NCI-H1993 0,24 C-4I 20,68 NCI-H358 0,33 NCI-H69 0,23
RAJI Burkitt’s L CCL-86 NCI-H441 0,56 NCI-H1650 0,28 SW-620 20,63 SW-620 0,35 WIDR 0,28
C-33A Cervix
Uteri
HTB-31 MCF-7 0,62 NCI-H358 0,30 HT-1080 20,58 SW-480 0,38 CAOV3 0,29
C-4I Cervix Uteri CRL-1594 CAOV3 0,65 C-4II 0,31 HCT-15 20,57 MCF-7 0,39 SNU-449 0,29
C-4II Cervix Uteri CRL-1595 SNU-475 0,65 SW-480 0,39 DMS-79 20,53 HCT-8 0,41 HT-1080 0,29
HCT-15 Colon CCL-225 Hep-3B 0,66 NCI-H661 0,42 C-4II 20,50 A-427 0,41 A-375 0,30
HCT-8 Colon CCL-244 NCI-H1650 0,71 SNU-449 0,43 NCI-H1993 20,45 Hep-3B 0,43 K-562 0,31
SW-403 Colon CCL-230 A-375 0,73 C-4I 0,47 SW-480 20,41 C-4II 0,43 HCT-8 0,34
SW-480 Colon CCL-228 HOS 0,73 K-562 0,48 SHP-77 20,36 NCI-H1650 0,44 NCI-H661 0,36
SW-620 Colon CCL-227 BT-20 0,74 SNU-475 0,50 K-562 20,34 HT-1080 0,51 MCF-7 0,41
SW-948 Colon CCL-237 SHP-77 0,77 MCF-7 0,51 A-427 20,33 NCI-H82 0,51 C-4I 0,41
WIDR Colon CCL-218 CCRF-CEM 0,78 Hep-3B 0,51 HCT-8 20,31 ES-2 0,51 CCRF-CEM 0,43
HT-1080 Fibrosarcoma CCL-121 SNU-449 0,78 CCRF-CEM 0,55 NCI-H358 20,30 CCRF-CEM 0,51 SNU-475 0,47
A-498 Kidney HTB-44 C-4II 0,78 NCI-H69 0,55 SW-403 20,28 SNU-475 0,51 SW-620 0,47
Hep-3B Liver HB-8064 NCI-H1993 0,82 SW-403 0,55 SNU-475 20,28 WIDR 0,53 NCI-H82 0,47
SNU-182 Liver CRL-2235 SW-480 0,82 HOS 0,58 COLO-668 20,25 NCI-H1993 0,54 SW-480 0,48
SNU-423 Liver CRL-2238 C-33A 0,87 HT-1080 0,58 CCRF-CEM 20,19 NCI-H69 0,56 ES-2 0,51
SNU-449 Liver CRL-2234 WIDR 0,88 C-33A 0,59 MOLT-4 20,18 HOS 0,59 NCI-H1993 0,51
SNU-475 Liver CRL-2236 AN3-CA 0,89 AN3-CA 0,60 MCF-7 20,16 SNU-449 0,60 NCI-H441 0,51
A-427 Lung HTB-53 SNU-423 0,90 ES-2 0,61 NCI-H1975 20,14 C-4I 0,61 C-33A 0,53
COLO-668 Lung 87061209 A-498 0,91 SW-620 0,61 SW-948 20,12 MOLT-4 0,61 DMS-79 0,54
DMS-114 Lung CRL-2066 NCI-H661 0,95 BT-20 0,67 SNU-423 20,12 K-562 0,63 SNU-182 0,57
DMS-79 Lung CRL-2049 SW-403 0,96 NCI-H82 0,68 SNU-449 20,11 AN3-CA 0,63 SHP-77 0,64
NCI-H358 Lung CRL-5807 C-4I 0,98 WIDR 0,70 C-33A 20,11 SNU-182 0,66 MOLT-4 0,65
NCI-H441 Lung HTB-174 DMS-114 0,98 MOLT-4 0,73 WIDR 20,11 BT-20 0,66 RAJI 0,65
NCI-H661 Lung HTB-183 RAJI 0,99 A-498 0,73 NCI-H82 20,09 COLO-668 0,71 NCI-H1650 0,67
NCI-H69 Lung HTB-119 SNU-182 1,01 HEC-1-B 0,73 SNU-182 20,08 A-498 0,72 A-427 0,69
NCI-H82 Lung HTB-175 ChaGo-K-1 1,01 SNU-423 0,81 ChaGo-K-1 20,07 SK-N-AS 0,72 BT-20 0,69
SHP-77 Lung CRL-2195 NCI-H82 1,02 NCI-H1975 0,82 RAJI 20,05 RAJI 0,72 AN3-CA 0,71
ChaGO-K-1 Lung HTB-168 MOLT-4 1,03 DMS-79 0,82 BT-20 20,01 NCI-H1975 0,73 SNU-423 0,73
NCI-H1650 Lung CRL-5883 NCI-H69 1,03 RAJI 0,82 DMS-114 0,00 ChaGo-K-1 0,78 NCI-H1975 0,74
NCI-H1975 Lung CRL-5908 ES-2 1,05 ChaGo-K-1 0,83 HOS 0,01 SNU-423 0,80 A-498 0,80
NCI-H1993 Lung CRL-5909 NCI-H1975 1,08 DMS-114 0,89 NCI-H1650 0,14 NCI-H661 0,88 ChaGo-K-1 0,81
RD Muscle CCL-136 SK-N-AS 1,10 SNU-182 0,90 RD 0,20 DMS-79 0,89 HOS 0,87
CAOV3 Ovary HTB-75 A-427 1,10 COLO-668 0,91 SK-N-AS 0,20 SHP-77 0,90 DMS-114 0,93
ES-2 Ovary CRL-1978 RD 1,12 HCT-8 0,95 ES-2 0,21 C-33A 0,91 SK-N-AS 1,04
HOS Sarcoma CRL-1543 COLO-668 1,13 A-427 0,98 HEC-1-B 0,31 DMS-114 0,92 HEC-1-B 1,07
A375 Skin CRL-1619 DMS-79 1,20 SK-N-AS 1,00 NCI-H661 0,32 RD 0,96 RD 1,28
AN3-CA Uterus HTB-111 HEC-1-B 1,31 RD 1,01 A-498 0,49 HEC-1-B 0,98 COLO-668 1,34
HEC-1-B Uterus HTB-113 SW-620 1,31 SHP-77 1,04 AN3-CA 0,61 SW-403 1,08 SW-948 1,45
For each drug, the cell lines are ranked based on their RI values (green: low, red: high, yellow: intermediate RI) at the C2 concentration. The panels of resistant- and sensitive-designated cell lines are marked by bold and the intermediate cell lines are marked by italic formatting for each agent.
doi:10.1371/journal.pone.0059503.t001
pre-processing the average of these were computed. As probe sets with very low abundance are not only unlikely to hold biological significance, but are also error prone, we made a filtering to retain only probe sets with an average expression over 100 and maximal expression over 1000. The complete normalized database is presented inTable S1.
The complete dataset consisting of the expression profiles has been arranged into 2 classes, according to the resistance properties of the cell lines. Intermediate cell lines were excluded. This selection procedure resulted in 5 datasets, which were treated as autonomous classification tasks. To obtain the list of genes best correlated to resistance, we used Significance Analysis of Microarrays (SAM) [29] and rank products [30,31]. While SAM is the most widely used method, rank products were found to deliver the best performance in a setting similar to our project with low sample size in an earlier summary of available feature selection methods [32]. The efficacy of the gene sets to discriminate resistant and sensitive cell lines was computed using Prediction Analysis of Microarrays [33]. The R file of the used statistical analysis is available in the supplemental material as Script S1.
To assess the capability of the gene-sets to predict survival, we searched in Pubmed GEO for datasets with available clinical follow-up where cancer patients were treated with one of the five investigated agents. Finally, to search for gene lists similar to our genes and to identify genes correlated to the identified genes, we used the CCancer search engine [34].
RNA Isolation and Quality Control
After homogenization using Qiashredder, RNA was isolated using the Qiagen RNeasy kit (Qiagen, Hilden, Germany) according to the product user’s guide. Quantity and quality of the isolated RNA was tested by using a Nanodrop 1000 system (BCM, Houston, TX, USA) and by gel electrophoresis using an Agilent Bioanalyzer system (Agilent Technologies Inc., Santa Clara, CA, USA). RNA (A260) and protein (A280) concentrations and sample purity (260/280 ratio) were measured. Only high quality, intact total RNA was accepted for samples which also showed regular 18S and 28S ribosomal RNA bend pattern on the
Bioanalyzer analysis. RNA was kept at -80uC until RT-PCR measurement.
TaqMan Assay
TaqMan real-time PCR was used to measure the expression of 95 selected genes (plus one housekeeping gene) using a Micro Fluidic Card System (Applied Biosystems, Foster City, CA, USA) in 40 cell lines. The measurements were performed using an ABI PRISMH7900HT Sequence Detection System as described in the products User Guide. The genes were selected to include the top genes correlated to resistance to the various agents. Additionally, based on a literature search, a set of genes correlated to targeted therapy resistance and members of the EGFR/RAS pathway were also added for additional analyses. The list of included genes is presented inTable S2.
Data Analysis of the RT-PCR Measurements
For primary data analysis the SDS 2.2 software was used. The delta Ct values (which represent the expression normalized to ribosomal 18S expression) were grouped according to the resistance characteristics against the various agents into groups.
Then, student’s t-test was performed to compare the expression of the gene in the various groups independently. Statistical signifi- cance was set at p,0.05.
Renal Cell Carcinoma (RCC) Sample Collection
Patients were treated at the Department of Urology, Semmel- weis University, Budapest, Hungary between 2005 and 2010.
Samples were collected according to state-of-the-art pathology protocol from all patients operated for renal cell cancer. However, only patients with later metastatic disease were included in present study, as only these patients received a targeted therapy treatment.
The two agents in clinical use for metastatic RCC are sunitinib and sorafenib. Of these, sunitinib is administered in the first line setting, thus, these patients were chosen for the immunohisto- chemical analyses. Tissue microarrays (TMA) of all FFPE samples were constructed with the Tissue Micro-Array Builder instrument (Histopathology Ltd., Pe´cs, Hungary). In the TMAs, duplicates of Figure 1. Overview of the study.Boxes with grey background represent training steps, while white background represents validation steps.
doi:10.1371/journal.pone.0059503.g001
2 mm wide cores were used of each tumor representing their most relevant areas according to histopathology.
Immunohistochemistry
The immunohistochemical (IHC) reactions were performed on 4mm thick sections obtained from TMA blocks. After deparaffi- nization, the slides were heated in a microwave oven in Target Retrieval Solution (DAKO, Carpenteria, CA, USA) for 30 minutes. An automated Ventana Benchmark immunostainer system was used according to the protocol ‘880’ (and ‘870’ for LGALS8) provided by the manufacturer (Ventana Medical Systems Inc., Tucson, AZ, USA). RAB17 (dilution, 1:200), LGALS8 (1:50), EpCam (1:100) and CD9 (1:300) antibodies were used for staining. The tissues were counterstained with Mayer’s hemalaun (00-8011, Zymed Laboratories Inc.). Positive controls and negative control tissues were applied in all IHC runs. In case of CD9, LGALS8, RAB17 cytoplasmic reaction, for EpCAM membranous staining was accepted as proper localization.
The stained slides were digitalized with a slide scanner (Mirax MIDI Scan, 3DHistech Ltd., Budapest, Hungary), and intensity of the reaction (0: negative reaction, +1: weak positivity, +2:
moderate positivity, +3: strong reaction) and frequency of positively stained cells (0:0–1%, 1:1–5%, 2:5–10%, 3:10–20%, 4:20–33%, 5:33–50%, 6:50–66%, 7:66–80%, 8:80–100%) were evaluated separately. Finally, correlation between 25-percentile survival groups as well as Kaplan-Meier survival plots based on grouping using the median were computed in WinStat for Excel (R. Fitch Software, Bad Krozingen, Germany).
Results
Resistance Tests
The resistance of each cell line was measured in triplicates for each of the three concentrations of the five agents. Then, the cell lines were ranked based on their RI values. An intermediate RI value was designated as being within the median RI value +/
210% of the RI range. Cell lines exhibiting higher RIs were designated as resistant, and cell lines with lower RIs as sensitive. A complete overview of the separation of cell lines into groups is depicted inTable 1.
Identification of Discriminatory Genes
For the classification, the genes were filtered to include only those which achieved an at least 2-fold difference in the average expression compared between cell lines designated as sensitive or resistant. Then, feature selection with SAM and rank products was performed. Only those genes were accepted as significant, which
achieved a false discovery rate below 20%. The complete list of significant genes is listed inTable S3.
The accuracy of the classification in the leave-one-out cross- validation setting using all genes in the cell lines resulted in an efficiency of 92.8% in PAM (cell lines with intermediate resistances were excluded). The use of the top 100 genes identified by rank products resulted in 79% correct predictions. The correct classifications using the top 100 rank products identified genes are presented in blue and incorrect classifications in red inTable S4.
Although the investigated agents are in clinical use already for over 7 years, we were unable to find published data sets suitable for meta-analysis of the identified gene-set. Thus, we could not perform anin silicovalidation on prediction of clinical response or survival. Using CCancer, all together 27 publications with overlapping gene sets have been identified. These are presented inTable S5.
TaqMan Validation of Cell Line-derived Gene Profiles TaqManq RT-PCR results are summarized inTable 3. 45 of the 63 genes associated with resistance in the feature selection using the microarray data were confirmed below p,0.05 and 23 of these below p,0.01. The highest significance was achieved by ITGB4(p = 0.005) of the erlotinib-resistance associated, byIADA (p = 0.003) of the gefitinib-associated genes, byFAT4(p = 0.011) of the sorafenib associated genes and byFURINandME1(p = 0.011) of the lapatinib-associated genes. Several genes were significantly confirmed of the sunitinib-resistance gene signature including KRT18(p = 0.001),LGALS8(p = 0.019), RAB17(p = 0.002),CD9 (p = 0.002) andPPL(p = 0.001). Meanwhile, only 7 of the 32 genes previously described in the literature as associated with resistance against the targeted therapy agents were confirmed. The complete normalized result of the TaqMan assays is available asTable S6.
Some of the genes were associated with resistance against several agents. The highest significance of these was achieved by COL3A1(p,0.001 in case of sorafenib-resistance),GJA1(p,0.001 in case of sunitinib-resistance) and KRT19 (p,0.001 in case of sunitinib-resistance). We have also depicted the genes associated with resistance against multiple agents using a circus-plot (see Figure 2). Using this approach one can recognize the high number of genes associated with sunitinib resistance and the presence of only a single gene correlated to lapatinib resistance.
Only two genes (ANXA3 andRAB25) were correlated to intrinsic resistance against at least four agents.
IHC-based Validation in Renal Cell Carcinomas
Altogether 39 sunitinib-treated patients with metastatic renal cell carcinoma were included in the study. The patient samples were collected before the administration of first-line TKI and are therefore similar to the measurement of gene expression in cell lines without treatment. The average age of the patients was 59 years, 63% of patients were female. The median overall survival is 14 months with 12/39 deaths. The average survival is 20 months.
Partial metastasectomy was performed in case of seventeen patients. Representative images of the immunohistochemical staining for three proteins encoded by the identified genes are displayed inFigure 3. The detailed results in all samples for all genes are presented inTable S7.
The increased staining intensity of LGALS8 (p = 0.026) and RAB17 (p = 0.018) and the frequency of positive cells for EpCAM (p = 0.01) and LGALS8 (p = 0.01) were correlated to improved survival. Meanwhile, CD9 - although showing a trend towards reduced survival in patients having increased staining intensity Table 2.Concentrations used in the cell lines to measure the
resistance indexes.
Drug Concentration (mM)
C1 C2 C3
lapatinib 2.867 28.67 286.7
sunitinib 0.124 1.24 12.4
sorafenib 1.147 11.47 114.7
erlotinib 0.508 5.08 50.8
gefitinib 0.745 7.45 74.5
doi:10.1371/journal.pone.0059503.t002
Table 3.Validation of the top genes by TaqMan RT-PCR in the cell lines.
Symbol TaqMan ID Affymetrix ID Gene name p value
Erlotinib
B3GNT3 Hs00429537_m1 204856_at UDP-GlcNAc:betaGal beta-1,3-N-acetylglucosaminyltransferase 3 0.021
CAST Hs00156280_m1 208908_s_at calpastatin 0.030
CLMN Hs00226865_m1 221042_s_at calmin (calponin-like, transmembrane) 0.023
ERBB3 Hs00176538_m1 202454_s_at v-erb-b2 erythroblastic leukemia viral oncogene homolog 3 0.016
FXYD5 Hs00204319_m1 218084_x_at FXYD domain containing ion transport regulator 5 0.016
ITGB4 Hs00236216_m1 204990_s_at integrin, beta 4 0.005
LGALS3 Hs00173587_m1 208949_s_at lectin, galactoside-binding, soluble, 3 0.016
NEAT1 Hs01008264_s1 214657_s_at nuclear paraspeckle assembly transcript 1 0.019
PRSS22 Hs00223188_m1 205847_at protease, serine, 22 0.023
S100A10 Hs00741221_m1 200872_at S100 calcium binding protein A10 0.015
SECTM1 Hs00171088_m1 213716_s_at secreted and transmembrane 1 0.026
TFAP2C Hs00231476_m1 205286_at transcription factor AP-2 gamma 0.004
Gefitinib
ADA Hs01110945_m1 216705_s_at adenosine deaminase 0.003
COL5A1 Hs00609088_m1 212489_at collagen, type V, alpha 1 0.018
SLC2A6 Hs01115485_m1 220091_at solute carrier family 2, member 6 0.027
Sorafenib
FAT4 Hs01570491_m1 219427_at FAT tumor suppressor homolog 4 0.011
GNG11 Hs00914578_m1 204115_at guanine nucleotide binding protein (G protein), gamma 11 0.068
TUSC3 Hs00954406_m1 213423_x_at tumor suppressor candidate 3 0.021
Sunitinib
CD9 Hs00233521_m1 201005_at CD9 molecule 0.002
EPCAM Hs00158980_m1 201839_s_at epithelial cell adhesion molecule 0.009
KRT18 Hs01941416_g1 201596_x_at keratin 18 0.001
KRT8 Hs01630795_s1 209008_x_at keratin 8 0.041
LGALS8 Hs00374634_m1 208934_s_at lectin, galactoside-binding, soluble, 8 0.019
LSR Hs00210880_m1 208190_s_at lipolysis stimulated lipoprotein receptor 0.046
PPL Hs00160312_m1 203407_at periplakin 0.001
RAB17 Hs00940833_m1 218931_at RAB17, member RAS oncogene family 0.002
SAT1 Hs00161511_m1 203455_s_at spermidine/spermine N1-acetyltransferase 1 0.003
SIGIRR Hs00222347_m1 52940_at single immunoglobulin and toll-interleukin 1 receptor domain 0.004 Lapatinib
FURIN Hs00965485_g1 201945_at furin (paired basic amino acid cleaving enzyme) 0.011
ME1 Hs00159110_m1 204059_s_at malic enzyme 1, NADP(+)-dependent, cytosolic 0.011
TMOD3 Hs00205710_m1 220800_s_at tropomodulin 3 0.004
Genes associated with resistance against multiple agents
AGR2 Hs00180702_m1 209173_at anterior gradient homolog 2 sunitinib 0.013
ANXA3 Hs00971411_m1 209369_at annexin A3 gefitinib 0.040
sorafenib 0.032 sunitinib 0.001 lapatinib 0.045
CDH1 Hs01023894_m1 201130_s_at cadherin 1, type 1, E-cadherin erlotinib 0.050
sunitinib 0.002
CLDN7 Hs00600772_m1 202790_at claudin 7 sunitinib 0.013
COL3A1 Hs00943809_m1 215076_s_at collagen, type III, alpha 1 gefitinib 0.005
sorafenib 0.000 sunitinib 0.009 FXYD3 Hs00254211_m1 202488_s_at FXYD domain containing ion transport regulator 3 erlotinib 0.037
(p = 0.14) - was not significant. The Kaplan-Meier survival plot for EPCAM is depicted inFigure 4.
Discussion
Targeted therapy agents acting via the ERBB/RAS pathway entered the mainstream cancer therapy guidelines. As still only 10–47% of patients respond to these therapies, it is of utmost importance to identify the drivers and potential markers of resistance. In our study we used 45 cancer cell lines and genome- wide gene expression signatures to identify potential new intrinsic biomarker genes. As a potential clinical application of our strategy, we validated the products of resistance-associated genes by IHC analysis in sunitinib-treated renal cell carcinomas.
We used a heterogeneous panel of cancer cell lines originating from lung (used TKIs include erlotinib and gefitinib), breast (lapatinib), renal (sorafenib and sunitinib), and liver (sorafenib).
Cell lines with a known RAS mutation were excluded, since activating RAS mutations render the inhibition of upstream tyrosine kinases completely ineffective, as has been previously shown for colon cancer [35]. The selection of cell lines enables identification of robust genes related to previously unidentified independent pathways.
In a recent study of Barretina et al, a large panel of cell lines was investigated to identify markers of sensitivity against a set of cytotoxic and targeted agents including three of the tyrosine kinase
inhibitors used in present study (erlotinib, lapatinib and sorafenib) by measuring sensitivity at the IC50 and EC50 values [36]. To increase clinical relevance of cancer cell line testing, we used drug concentrations applied in clinical settings, as we expected to find the most reliable candidate markers at concentrations also achievable in patients [37,38]. The robustness of the approach using such pre-defined clinical concentrations is supported by the successful validation in a clinical cohort of sunitinib-treated patients.
We have found most cross-resistance associated genes related to sunitinib-resistance. Interestingly, so far only a few genes have been correlated with sunitinib-resistance in the literature while the number of candidate genes involved in resistance against the other agents is much larger. Therefore, we particularly focused on sunitinib resistance and performed immunohistochemical exper- iments on tumor samples to validate the discriminatory potential of four new candidate biomarkers,LGALS8,RAB17,EpCAM, and CD9.
Our first candidate gene LGALS8 encodes a member of the galectin family. Galectins have been implicated in many functions including development, differentiation, cell-cell adhesion, cell- matrix interaction, growth regulation, apoptosis, and RNA splicing. Galectin-8 may also be involved in angiogenesis [39], and the expression is changed during hypolaryngeal and laryngeal tumor progression [40]. The second gene,RAB17is an epithelial cell-specific GTPase playing an important role in the regulation of Table 3.Cont.
Symbol TaqMan ID Affymetrix ID Gene name p value
sunitinib 0.016
GJA1 Hs00748445_s1 201667_at gap junction protein, alpha 1, 43 kDa sunitinib 0.000
KRT19 Hs00761767_s1 201650_at keratin 19 erlotinib 0.032
sorafenib 0.029 sunitinib 0.000
LHX2 Hs00180351_m1 211219_s_at LIM homeobox 2 sorafenib 0.021
MPZL2 Hs00170684_m1 203780_at myelin protein zero-like 2 sorafenib 0.036
sunitinib 0.008
NEFH Hs00606024_m1 33767_at neurofilament, heavy polypeptide erlotinib 0.001
sunitinib 0.002
RAB25 Hs00220628_m1 218186_at RAB25, member RAS oncogene family erlotinib 0.006
gefitinib 0.011 sorafenib 0.015 sunitinib 0.007
S100P Hs00195584_m1 204351_at S100 calcium binding protein P sunitinib 0.024
TACSTD2 Hs00242741_s1 202286_s_at tumor-associated calcium signal transducer 2 sunitinib 0.037 confirmed literature-based genes
ERBB2 Hs01001580_m1 216836_s_at v-erb-b2 oncogene lapatinib 0.034
TGFA Hs00608187_m1 205016_at transforming growth factor, alpha lapatinib 0.034
ANGPT1 Hs00375822_m1 205608_s_at angiopoietin 1 sunitinib 0.036
IFNG Hs00989291_m1 210354_at interferon, gamma sunitinib 0.024
PDGFA Hs00964426_m1 205463_s_at platelet-derived growth factor alpha polypeptide sunitinib 0.044
AKT1 Hs00178289_m1 207163_s_at v-akt murine thymoma viral oncogene homolog 1 erlotinib 0.047
lapatinib 0.041
COX2 Hs00153133_m1 204748_at cyclooxygenase sunitinib 0.034
For the complete results of RT-PCR measurements refer to Table S6.
doi:10.1371/journal.pone.0059503.t003
membrane trafficking [41]. The third gene, epithelial cell adhesion molecule (EpCAM) is a membrane protein with proto-oncogenic properties that is expressed in numerous cancers and is a promising anticancer drug target. It functions as a homotypic calcium-independent cell adhesion molecule. The release of the intracellular domain of the molecule results in the activation of the WNT pathway [42]. High expression ofEpCAMis associated with poor prognosis in gallbladder carcinoma [43]. Finally,CD9plays a role in many cellular processes including differentiation, adhesion, signal transduction, growth, and in the suppression of cancer cell motility and metastasis. Miyakeet aldemonstrated that in patients with invasive ductal carcinomas the decreased expression ofCD9 protein was associated with poor prognosis [44]. The IHC staining results confirmed the correlations betweenLGALS8, RAB17 and EpCAM and survival of renal carcinoma patients treated with sunitinib, while CD9 failed to achieve significant discriminatory potential.
According the results of our study these genes might represent new candidates to identify patients who may benefit from sunitinib therapy. While the immunohistochemical analysis validated 3 of the 4 biomarker candidates, a larger clinical study will be needed to rigorously estimate the power and confirm their clinical significance.
In the last decade, oncogene addiction has been acknowledged as one of the key factors of cancer evolution that can also mark pathways and genes for targeted therapies [45]. However, due to the adaptation of cancer cells, drug addiction resulting from
intensive treatment can overcome oncogene addiction as has been recently demonstrated in lung cancer cell lines [46]. To understand these processes, the identification of genes, which share a functional role in the resistance against several targeted therapy agents, is of high priority.
Despite the similar mechanism of action, no gene was identified to be correlated with the sensitivity against all five agents in our study. Two genes,ANXA3andRAB25were related to four drugs.
Annexin 3 (ANXA3) plays a role in cellular growth and signal transduction [47], and was previously linked to platinum resistance in ovarian cancer [48]. The product of theANXA3gene was also identified as one of the tyrosine-phosphorylation targets of EGFR by immunoprecipitation and western blotting [49]. ANXA3 was identified as one of the four down-regulated genes involved in prostate cancer progression in a recent study that compared EGFR mutated and non-mutated tumours [50]. Our results imply the possibility of the involvement ofANXA3in collateral pathways enabling cancer cells to circumvent TKI therapy.
RAB25is a member of the RAS oncogene family. Loss ofRAB25 was associated with human colorectal adenocarcinomas [51] and triple-negative breast cancer [52], but the gene has not yet been investigated in relationship to tyrosine kinase resistance. Future studies involving patients with simultaneously sequenced tyrosine kinases and RAS signaling pathway members are needed to assess its relevance in targeted therapy.
In summary, we present a comprehensive analysis pipeline for future studies of the investigated tyrosine kinase inhibitors. As a Figure 2. Circos plot of genes conferring multiple resistances.Circos plot of RT-PCR validated correlations for genes associated with resistance against multiple agents as identified by microarray analysis. The thickness of the ribbons correlate to thelog(p)of the correlation (see Table 2.). Note the high number of genes associated with sunitinib resistance and the single gene associated with lapatinib resistance. The two most informative genes are ANXA3 and RAB25, each associated with resistance against four agents.
doi:10.1371/journal.pone.0059503.g002
Figure 3. Immunohistochemistry.Representative examples of the immunhistochemical validation for CD9, EpCAM and LGALS8. Left column:
normal kidney, right column: selected tumor tissue.
doi:10.1371/journal.pone.0059503.g003
proof of principle we selected a set of genes associated with sunitinib resistance (the agent with the least published predictive biomarkers) for testing in a clinical cohort.
Supporting Information
Table S1 Normalized microarray data of all genes in all cell lines.
(XLSX)
Table S2 List of the genes selected for qRT-PCR validation.
(XLSX)
Table S3 Significant genes for each agent.
(XLSX)
Table S4 Cross validation.The accuracy of the classification in the leave-one-out cross-validation setting using all genes in the cell lines resulted in an efficiency of 92.8% in PAM (cell lines with intermediate resistances were excluded). The use of the top 100 genes identified by rank products resulted in 79% correct predictions. The correct classifications using the top 100 rank products identified genes are presented in blue and incorrect classifications in red.
(XLSX)
Table S5 Overlapping gene sets in other studies as identified using the ccancer algorithm.
(XLSX)
Table S6 The complete normalized result of the Taq- Man assays.CT values normalized to the housekeeping gene.
(XLSX)
Table S7 Immunohistochemistry. The intensity and fre- quency of the CD9, epCAM, LGALS8 and RAB17 staining, with the number of the sample and the patient ID.
(XLSX)
Script S1 R file of the used statistical analysis.
(PDF)
Author Contributions
Conceived and designed the experiments: ZP BT BG AMS RS. Performed the experiments: ZP BT IL AS AMS. Analyzed the data: ZS BG BT ZP.
Contributed reagents/materials/analysis tools: IL BG AS AMS. Wrote the paper: ZP BT BG RS.
References
1. Gyorffy B, Schafer R (2010) Biomarkers downstream of RAS: a search for robust transcriptional targets. Curr Cancer Drug Targets 10: 858–868.
2. Cohen AJ, Mankey J, Wendt W (2003) Response: the claims of public health and public safety. Sci Pract Perspect 2: 15–17.
3. Gomez HL, Doval DC, Chavez MA, Ang PC, Aziz Z, et al. (2008) Efficacy and safety of lapatinib as first-line therapy for ErbB2-amplified locally advanced or metastatic breast cancer. J Clin Oncol 26: 2999–3005.
4. Escudier B, Eisen T, Stadler WM, Szczylik C, Oudard S, et al. (2007) Sorafenib in advanced clear-cell renal-cell carcinoma. N Engl J Med 356: 125–134.
5. Motzer RJ, Hutson TE, Tomczak P, Michaelson MD, Bukowski RM, et al.
(2007) Sunitinib versus interferon alfa in metastatic renal-cell carcinoma.
N Engl J Med 356: 115–124.
6. Cohen MH, Williams GA, Sridhara R, Chen G, Pazdur R (2003) FDA drug approval summary: gefitinib (ZD1839) (Iressa) tablets. Oncologist 8: 303–306.
7. Cameron D, Casey M, Press M, Lindquist D, Pienkowski T, et al. (2008) A phase III randomized comparison of lapatinib plus capecitabine versus capecitabine alone in women with advanced breast cancer that has progressed on trastuzumab: updated efficacy and biomarker analyses. Breast Cancer Res Treat 112: 533–543.
8. Geyer CE, Forster J, Lindquist D, Chan S, Romieu CG, et al. (2006) Lapatinib plus capecitabine for HER2-positive advanced breast cancer. N Engl J Med 355:
2733–2743.
9. Motzer RJ, Hutson TE, Tomczak P, Michaelson MD, Bukowski RM, et al.
(2009) Overall survival and updated results for sunitinib compared with interferon alfa in patients with metastatic renal cell carcinoma. J Clin Oncol 27:
3584–3590.
10. Choueiri TK, Plantade A, Elson P, Negrier S, Ravaud A, et al. (2008) Efficacy of sunitinib and sorafenib in metastatic papillary and chromophobe renal cell carcinoma. J Clin Oncol 26: 127–131.
11. Zhou W, Ercan D, Chen L, Yun CH, Li D, et al. (2009) Novel mutant-selective EGFR kinase inhibitors against EGFR T790M. Nature 462: 1070–1074.
12. Armato SG, 3rd, McNitt-Gray MF, Reeves AP, Meyer CR, McLennan G, et al.
(2007) The Lung Image Database Consortium (LIDC): an evaluation of radiologist variability in the identification of lung nodules on CT scans. Acad Radiol 14: 1409–1421.
13. Huang D, Ding Y, Zhou M, Rini BI, Petillo D, et al. (2010) Interleukin-8 mediates resistance to antiangiogenic agent sunitinib in renal cell carcinoma.
Cancer Res 70: 1063–1071.
14. Marks JL, Broderick S, Zhou Q, Chitale D, Li AR, et al. (2008) Prognostic and therapeutic implications of EGFR and KRAS mutations in resected lung adenocarcinoma. J Thorac Oncol 3: 111–116.
15. Dave B, Migliaccio I, Gutierrez MC, Wu MF, Chamness GC, et al. (2011) Loss of phosphatase and tensin homolog or phosphoinositol-3 kinase activation and response to trastuzumab or lapatinib in human epidermal growth factor receptor 2-overexpressing locally advanced breast cancers. J Clin Oncol 29: 166–173.
16. Di Nicolantonio F, Martini M, Molinari F, Sartore-Bianchi A, Arena S, et al.
(2008) Wild-type BRAF is required for response to panitumumab or cetuximab in metastatic colorectal cancer. J Clin Oncol 26: 5705–5712.
17. Sartore-Bianchi A, Martini M, Molinari F, Veronese S, Nichelatti M, et al.
(2009) PIK3CA mutations in colorectal cancer are associated with clinical resistance to EGFR-targeted monoclonal antibodies. Cancer Res 69: 1851–
1857.
18. Pao W, Wang TY, Riely GJ, Miller VA, Pan Q, et al. (2005) KRAS mutations and primary resistance of lung adenocarcinomas to gefitinib or erlotinib. PLoS Med 2: e17.
19. Jackman DM, Miller VA, Cioffredi LA, Yeap BY, Janne PA, et al. (2009) Impact of epidermal growth factor receptor and KRAS mutations on clinical outcomes in previously untreated non-small cell lung cancer patients: results of an online tumor registry of clinical trials. Clin Cancer Res 15: 5267–5273.
20. Lugthart S, Cheok MH, den Boer ML, Yang W, Holleman A, et al. (2005) Identification of genes associated with chemotherapy crossresistance and treatment response in childhood acute lymphoblastic leukemia. Cancer Cell 7:
375–386.
21. Gyorffy B, Serra V, Jurchott K, Abdul-Ghani R, Garber M, et al. (2005) Prediction of doxorubicin sensitivity in breast tumors based on gene expression profiles of drug-resistant cell lines correlates with patient survival. Oncogene 24:
7542–7551.
22. Huang F, Reeves K, Han X, Fairchild C, Platero S, et al. (2007) Identification of candidate molecular markers predicting sensitivity in solid tumors to dasatinib:
rationale for patient selection. Cancer Res 67: 2226–2238.
23. Coldren CD, Helfrich BA, Witta SE, Sugita M, Lapadat R, et al. (2006) Baseline gene expression predicts sensitivity to gefitinib in non-small cell lung cancer cell lines. Mol Cancer Res 4: 521–528.
24. Balko JM, Potti A, Saunders C, Stromberg A, Haura EB, et al. (2006) Gene expression patterns that predict sensitivity to epidermal growth factor receptor Figure 4. Survival plots. Kaplan-Meier survival plots of sunitinib-
treated metastatic RCC samples divided into two cohorts based on the median of EpCAM positive cells (p = 0.01).
doi:10.1371/journal.pone.0059503.g004
tyrosine kinase inhibitors in lung cancer cell lines and human lung tumors. BMC Genomics 7: 289.
25. Akcakanat A, Zhang L, Tsavachidis S, Meric-Bernstam F (2009) The rapamycin-regulated gene expression signature determines prognosis for breast cancer. Mol Cancer 8: 75.
26. Gyorffy B, Surowiak P, Kiesslich O, Denkert C, Schafer R, et al. (2006) Gene expression profiling of 30 cancer cell lines predicts resistance towards 11 anticancer drugs at clinically achieved concentrations. Int J Cancer 118: 1699–
1712.
27. Gautier L, Cope L, Bolstad BM, Irizarry RA (2004) affy–analysis of Affymetrix GeneChip data at the probe level. Bioinformatics 20: 307–315.
28. Gyorffy B, Molnar B, Lage H, Szallasi Z, Eklund AC (2009) Evaluation of microarray preprocessing algorithms based on concordance with RT-PCR in clinical samples. PLoS One 4: e5645.
29. Tusher VG, Tibshirani R, Chu G (2001) Significance analysis of microarrays applied to the ionizing radiation response. Proc Natl Acad Sci U S A 98: 5116–
5121.
30. Breitling R, Herzyk P (2005) Rank-based methods as a non-parametric alternative of the T-statistic for the analysis of biological microarray data.
J Bioinform Comput Biol 3: 1171–1189.
31. Breitling R, Armengaud P, Amtmann A, Herzyk P (2004) Rank products: a simple, yet powerful, new method to detect differentially regulated genes in replicated microarray experiments. FEBS Lett 573: 83–92.
32. Jeffery IB, Higgins DG, Culhane AC (2006) Comparison and evaluation of methods for generating differentially expressed gene lists from microarray data.
BMC Bioinformatics 7: 359.
33. Tibshirani R, Hastie T, Narasimhan B, Chu G (2002) Diagnosis of multiple cancer types by shrunken centroids of gene expression. Proc Natl Acad Sci U S A 99: 6567–6572.
34. Dietmann S, Lee W, Wong P, Rodchenkov I, Antonov AV (2010) CCancer: a bird’s eye view on gene lists reported in cancer-related studies. Nucleic Acids Res 38: W118–123.
35. Amado RG, Wolf M, Peeters M, Van Cutsem E, Siena S, et al. (2008) Wild-type KRAS is required for panitumumab efficacy in patients with metastatic colorectal cancer. J Clin Oncol 26: 1626–1634.
36. Barretina J, Caponigro G, Stransky N, Venkatesan K, Margolin AA, et al. (2012) The Cancer Cell Line Encyclopedia enables predictive modelling of anticancer drug sensitivity. Nature 483: 603–607.
37. Minematsu T, Giacomini KM (2011) Interactions of tyrosine kinase inhibitors with organic cation transporters and multidrug and toxic compound extrusion proteins. Mol Cancer Ther 10: 531–539.
38. Widemann BC, Kim A, Fox E, Baruchel S, Adamson PC, et al. (2012) A Phase I Trial and Pharmacokinetic Study of Sorafenib in Children with Refractory Solid Tumors or Leukemias: A Children’s Oncology Group Phase I Consortium Report. Clin Cancer Res 18: 6011–6022.
39. Delgado VM, Nugnes LG, Colombo LL, Troncoso MF, Fernandez MM, et al.
(2011) Modulation of endothelial cell migration and angiogenesis: a novel function for the ‘‘tandem-repeat’’ lectin galectin-8. FASEB J 25: 242–254.
40. Cludts S, Decaestecker C, Mahillon V, Chevalier D, Kaltner H, et al. (2009) Galectin-8 up-regulation during hypopharyngeal and laryngeal tumor progres- sion and comparison with galectin-1, -3 and -7. Anticancer Res 29: 4933–4940.
41. Lutcke A, Jansson S, Parton RG, Chavrier P, Valencia A, et al. (1993) Rab17, a novel small GTPase, is specific for epithelial cells and is induced during cell polarization. J Cell Biol 121: 553–564.
42. Munz M, Baeuerle PA, Gires O (2009) The emerging role of EpCAM in cancer and stem cell signaling. Cancer Res 69: 5627–5629.
43. Varga M, Obrist P, Schneeberger S, Muhlmann G, Felgel-Farnholz C, et al.
(2004) Overexpression of epithelial cell adhesion molecule antigen in gallbladder carcinoma is an independent marker for poor survival. Clin Cancer Res 10:
3131–3136.
44. Miyake M, Nakano K, Itoi SI, Koh T, Taki T (1996) Motility-related protein-1 (MRP-1/CD9) reduction as a factor of poor prognosis in breast cancer. Cancer Res 56: 1244–1249.
45. Weinstein IB, Joe AK (2006) Mechanisms of disease: Oncogene addiction–a rationale for molecular targeting in cancer therapy. Nat Clin Pract Oncol 3:
448–457.
46. Suda K, Tomizawa K, Osada H, Maehara Y, Yatabe Y, et al. (2012) Conversion from the ‘‘oncogene addiction’’ to ‘‘drug addiction’’ by intensive inhibition of the EGFR and MET in lung cancer with activating EGFR mutation. Lung Cancer 76: 292–299.
47. Jung EJ, Moon HG, Park ST, Cho BI, Lee SM, et al. (2010) Decreased annexin A3 expression correlates with tumor progression in papillary thyroid cancer.
Proteomics Clin Appl 4: 528–537.
48. Yan X, Yin J, Yao H, Mao N, Yang Y, et al. (2010) Increased expression of annexin A3 is a mechanism of platinum resistance in ovarian cancer. Cancer Res 70: 1616–1624.
49. Ruan L, Wang GL, Chen Y, Yi H, Tang CE, et al. (2010) Identification of tyrosine phosphoproteins in signaling pathway triggered TGF-a by using functional proteomics technology. Med Oncol 27: 1407–1414.
50. Peraldo-Neia C, Migliardi G, Mello-Grand M, Montemurro F, Segir R, et al.
(2011) Epidermal Growth Factor Receptor (EGFR) mutation analysis, gene expression profiling and EGFR protein expression in primary prostate cancer.
BMC Cancer 11: 31.
51. Nam KT, Lee HJ, Smith JJ, Lapierre LA, Kamath VP, et al. (2010) Loss of Rab25 promotes the development of intestinal neoplasia in mice and is associated with human colorectal adenocarcinomas. J Clin Invest 120: 840–849.
52. Cheng JM, Volk L, Janaki DK, Vyakaranam S, Ran S, et al. (2010) Tumor suppressor function of Rab25 in triple-negative breast cancer. International Journal of Cancer 126: 2799–2812.