R E S E A R C H A R T I C L E Open Access
Aberrant septin 9 DNA methylation in colorectal cancer is restricted to a single CpG island
Reinhold Wasserkort1,2*, Alexandra Kalmar3, Gabor Valcz3, Sandor Spisak3, Manuel Krispin1,4, Kinga Toth3, Zsolt Tulassay3,6, Andrew Z Sledziewski5and Bela Molnar3,6
Abstract
Background:The septin 9 gene (SEPT9) codes for a GTP-binding protein associated with filamentous structures and cytoskeleton formation. SEPT9 plays a role in multiple cancers as either an oncogene or a tumor suppressor gene. Regulation of SEPT9 expression is complex and not well understood; however, hypermethylation of the gene was recently introduced as a biomarker for early detection of colorectal cancer (CRC) and has been linked to cancer of the breast and of the head and neck. Because the DNA methylation landscape of different regions of SEPT9 is poorly understood in cancer, we analyzed the methylation patterns of this gene in distinct cell populations from normal and diseased colon mucosa.
Methods:Laser capture microdissection was performed to obtain homogeneous populations of epithelial and stromal cells from normal, adenomatous, and tumorous colon mucosa. Microdissected samples were analyzed using direct bisulfite sequencing to determine the DNA methylation status of eight regions within and near the SEPT9 gene. Septin-9 protein expression was assessed using immunohistochemistry (IHC).
Results:Regions analyzed in SEPT9 were unmethylated in normal tissue except for a methylation boundary detected downstream of the largest CpG island. In adenoma and tumor tissues, epithelial cells displayed markedly increased DNA methylation levels (>80%, p <0.0001) in only one of the CpG islands investigated. SEPT9 methylation in stromal cells increased in adenomatous and tumor tissues (≤50%, p <0.0001); however, methylation did not increase in stromal cells of normal tissue close to the tumor. IHC data indicated a significant decrease (p <0.01) in Septin-9 protein levels in epithelial cells derived from adenoma and tumor tissues; Septin-9 protein levels in stromal cells were low in all tissues.
Conclusions:Hypermethylation of SEPT9 in adenoma and CRC specimens is confined to one of several CpG islands of this gene. Tumor-associated aberrant methylation originates in epithelial cells; stromal cells appear to acquire hypermethylation subsequent to epithelial cells, possibly through field effects. The region in SEPT9 with disease- related hypermethylation also contains the CpGs targeted by a novel blood-based screening test (EpiproColon®), providing further support for the clinical relevance of this biomarker.
Keywords:DNA methylation, Septin 9, Colorectal cancer, Adenoma, Epithelial cells, Stromal cells, Direct bisulfite sequencing, Immunohistochemistry
* Correspondence:reinhold.wasserkort@gmx.net
1Epigenomics AG, Berlin, Germany
2Current address: Delta-Vir GmbH, Leipzig, Germany
Full list of author information is available at the end of the article
© 2013 Wasserkort et al.; licensee BioMed Central Ltd. This is an Open Access article distributed under the terms of the Creative Commons Attribution License (http://creativecommons.org/licenses/by/2.0), which permits unrestricted use, distribution, and reproduction in any medium, provided the original work is properly cited.
Background
Alterations in the DNA methylation profile of cells are among the earliest molecular changes in cancer [1].
Both locus-specific hypermethylation and genome-wide hypomethylation commonly occur in different types of tumors [2]. Hypermethylation of tumor suppressor genes has been identified as a critical step in tumor initiation as the silenced expression of such genes affects whether cells maintain normal growth. Such epigenetic events, along with mutations, provide cells with a selective advantage that may lead to their clonal expansion [3].
Septin 9 (SEPT9)ainvolvement in cancer was first discov- ered as a fusion product with the MLL gene in leukemia [4]. Subsequent studies showed that SEPT9 was frequently deleted in sporadic ovarian tumors [5] or amplified in breast cancer [6]; it was suggested that the gene might be a candidate ovarian tumor suppressor gene that may also act like an oncogene. A comprehensive screen of a wide variety of tissue samples and cell lines revealed that SEPT9 was ubiquitously expressed, although, its isoform expression appeared to be tissue specific [7]. Moreover, SEPT9 mRNA and protein were overexpressed in diverse human tumors further suggesting an important role of the gene in tumorigenesis.
SEPT9 belongs to a highly conserved family of septin genes coding for GTP-binding proteins. These multidomain proteins assemble into complexes and form filamentous structures which comprise part of the cytoskeleton [8,9].
The septin proteins play important roles in many cellular processes by providing rigidity to the cell membrane, serving as scaffolds to recruit proteins to specific sub- cellular locales, and creating membrane diffusion bar- riers to establish discrete cellular domains [8]. SEPT9 is characterized by its complex genomic organization that spans 219 kb and has 18 distinct transcripts encoding 15 isoforms [10,11]. Alternative splicing at both 5′and 3′ends generates this transcript diversity [10]. The gene also harbors several CpG islands that when methylated may impact the expression of different transcripts.
Several analyses have been conducted on the expres- sion of the SEPT9 transcripts. The transcript SEPT9_v1 was overexpressed in breast, ovarian, and prostate cancer while no SEPT9_v1 expression was observed in the normal tissue of these organs [12,13]. Two distinct transcripts, SEPT_v4 and SEPT_v4*, code for the same polypeptide, but are translated with different efficiencies and respond differently to cellular stresses; the SEPT9_v4* polypep- tide is thought to play a role in neoplasia [14,15]. The transcript SEPT9_v3 expression was up-regulated in some cancer cell lines and repressed in others in which there was also a reduction in protein levels [16]. This transcript was also associated with promoter hypermethylation.
Recently, SEPT9 was shown to be epigenetically modi- fied in colorectal cancer (CRC) [17]. Subsequent studies
using refined and more sensitive assays confirmed SEPT9 as a biomarker for CRC [18,19]. A complete workflow was developed on the basis of these findings and permits a min- imally invasive, blood-based screening test (EpiproColon®) for colorectal cancer [20], which is currently available for clinical application in Europe [21]. The test detects meth- ylated SEPT9 in circulating DNA in plasma which is believed to be derived from apoptotic cells shed from the tumor [22]. However, it is unknown whether SEPT9 hypermethylation is present in all types of tumor cells of the colon and to what extent the hypermethylation affects the promoter region of SEPT9. To advance our understanding of cancer-associated epigenetic changes in SEPT9, we investigated the methylation profile of SEPT9 in epithelial and stromal cells microdissected from normal and diseased fresh-frozen biopsies and tissue colon samples. Since earlier studies analyzed DNA methylation changes only in a single SEPT9 CpG island, and only in heterogeneous CRC tissue specimens, this study aims at determining whether the aberrant methylation changes are unique to only this CpG island or whether hypermethylation affects multiple CpG dense regions associated with this gene and how SEPT9 methylation is affected in homogeneous populations of epithelial and stromal cells.
Our results provide new insights into the cellular origin of aberrant DNA methylation in the SEPT9 gene for CRC and the clinical relevance of DNA methylation for early CRC detection.
Methods Clinical data
Biopsies of normal mucosa were obtained from three patients, aged 32 to 72 during routine endoscopy exami- nations (Additional file 1: Table S1). Patients from whom normal tissue samples were obtained were verified to be free of bowel disease. Adenomatous polyps and tumor samples were obtained from 5 patients, aged 53 to 75 during surgical resection. Samples were obtained after informed consent and the study had been approved by the local ethics committee (TUKEB 2005/037, Semmelweis University Regional and Institutional Committee of Science and Research Ethics, Budapest, Hungary). Tissue from core tumor areas and normal tissue adjacent to tumor (NAT) from two distances to the tumor were obtained: NAT1, microscopically normal tissue from a distance of 1 cm from tumor; and NAT2, minimum of 10 cm from tumor.
Surgically removed tissue samples were snap-frozen in liquid nitrogen immediately after surgery and stored at −80°C until cryosection.
Laser capture microdissection
Laser capture microdissection (LCM) was performed on normal, adenomatous, and colorectal tumor mucosa specimens after they were embedded in optimal cutting
temperature (OCT) media (Sakura, Netherlands) and prepared for cryosectioning: 6μm sections were cut on PALM Membrane Slide 1.0 PEN (Carl Zeiss, Germany) slides at−20°C and stored at−80°C until used. Consecutive sections were used for H&E and IHC staining for LCM and photo documentation. A PALM laser microdissector (Carl Zeiss, Germany) was used to collect a total of 96 specimens with a target of approximately 1000 cells each, as shown in Additional file 2: Table S2. Dissected specimens were collected in 500μl vials; specimens were immersed in lysis buffer containing proteinase K immediately after sec- tioning and kept at−80°C until further processing.
Preanalytic processing of LCM specimens
Microdissected samples were lysed at 56°C for three hours followed by the addition of fresh proteinase K (ProtK) solu- tion, and then overnight incubation at 37°C to ensure complete digestion of the samples. All lysates were subjected to bisulfite treatment without prior DNA extraction. To further minimize DNA loss while maintaining high DNA conversion rates a non-standard protocol was established.
Bisulfite reagents (from EpiproColon® 2.0 kit, Epigenomics, Germany) were used with a modified protocol: 45 μl of bisulfite solution plus 10 μl of protection buffer were added to each lysate and incubated at 80°C for 45 minutes in a thermocycler (MJ Research Tetrad, GMI, USA). Next, binding buffer and poly-dA (Qiagen, Germany) were added to the lysate solutions, which were then placed on to silica membranes (Zymo Research, USA). On- column desulfonation using 0.2 M NaOH for two minutes was followed by two washing steps using commercial buffer solutions AW1 and AW2 (Qiagen, Germany), and finally, DNA was eluted using 40μl of pre-warmed (50°C) PCR-grade water. Eluted DNA was stored at −20°C until used for analysis. The total amount of bisulfite-converted DNA samples was quantified using an in-house duplex qPCR assay which determines genomic and bisulfite DNA simultaneously [23]. This assay determined the median amount of DNA per specimen as 5.4 ng (Additional file 2:
Table S2) corresponding to a median of around 900 cells per LCM specimen. 92% of the specimens had less than 1% detectable genomic DNA indicating a high conversion of genomic DNA to bisulfite DNA. In two LCM samples, unconverted genomic DNA comprised more than 10% of the total DNA, indicating a poor conversion. However, none of these samples were discarded as there was still a sufficient amount of converted template DNA for the bi- sulfite specific primers in the amplification and sequen- cing assays. Multiplex PCR was then performed once per sample using up to 2 ng of the respective DNA.
Sequencing assays and methylation analysis
To best utilize the limited amounts of DNA obtained from microdissected specimens for the analysis of multiple loci, a
two-step multiplex amplification protocol was adopted [23]
to establish a 13-loci multiplex PCR (mPCR) (Additional file 3: Table S3). For each locus at least two primer pairs were designed and tested in singleplex PCR (sPCR) reac- tions. The better performing primer pair, based on agarose gel analysis, was then tested in combination with other primers. All primers were void of CpGs so that amplifi- cation was not influenced by the methylation status. PCR was performed in two consecutive steps comprising a pre-amplification (mPCR) on 2 ng bisulfite DNA from each sample, and a re-amplification step for each of the amplicons (sPCR). mPCR was done after initial de- naturation for 15 minutes at 95°C for 50 cycles with the following temperature profile: 20 seconds at 95°C, 45 seconds at 58°C, and 30 seconds at 72°C. The highly stringent temperature was selected to minimize false priming in the mPCR reaction, and high cycle numbers were chosen to ensure sufficient amounts of PCR prod- uct generated under these conditions. Re-amplification of a single locus was done using the same forward pri- mer as in the mPCR and a new reverse primer with a short sequence tag (cgtcgtcg) at the 5′end, but other- wise identical to the reverse primer of the mPCR. This tag provided each amplicon with an internal calibrator equivalent to three fully methylated CpGs. A volume of 2 μl of the mPCR product was used as the template of each sPCR, and the same cycling conditions were used for 45 cycles. All sample DNAs were subjected to one mPCR pre-amplification reaction using a single 96-well plate to minimize reaction to reaction variation. For re-amplification with sPCR, we processed all sample- specific mPCR products in parallel for each amplicon to avoid batch processing effects.
Completed PCR reactions were subjected to direct bisulfite sequencing using Sanger sequencing chemistry as previously described [24]. Capillary gel analysis of the purified products was performed on ABI 3730 XL instruments by LGC Genomics (Berlin, Germany). Resulting trace-file data were provided online and analyzed using the ESME software to display methylation status as heatmaps and numerically as previously described [25].
Numerical methylation values were obtained for each CpG and averaged from all CpGs within each amplicon.
The resulting median was used to express methylation levels as a percentage value for each amplicon and sam- ple. Since all amplicons were reamplified and sequenced only once per microdissected sample the obtained sequen- cing data were then averaged as shown in Additional file 2: Table S2 (number of biological replicates indicated in last column).
Artificial mixtures of bisulfite-converted methylated and unmethylated DNA were prepared to analyze the technical performance of the assays in this workflow.
Bisulfite-converted fully methylated DNA from peripheral
blood lymphocytes (PBLs) (Millipore, Germany) and sperm DNA, previously reported to be free of methyla- tion at most loci [23,26], were used to prepare mixtures corresponding to 0%, 25%, 50%, 75%, and 100% methy- lation. Quantification of the measured methylation level was done after these known DNA standards and mix- tures were processed in duplicate through all workflow steps starting from pre-amplification to sequencing.
Statistical significance of methylation differences was tested using one-way ANOVA analysis based on the quan- titative sequencing data obtained for each amplicon.
IHC staining
Immunohistochemistry (IHC) staining was done as pre- viously described [27] with modifications. Fresh-frozen sections (6μm) were fixed in acetone for 5 minutes and air dried for 30 minutes. After fixation, the slides were washed in PBS, followed by a 10-minute incubation in 1% BSA solution to block unspecific binding. Sections were then incubated with the primary antibody against Septin-9 (polyclonal AB cat.# PAB4799, Abnova, Germany) in 1:50 dilution for 60 minutes at 37°C, washed again in PBS, and detected with Alexa Fluor 546 dye in 1:100 dilution after 30 minutes of incubating at 37°C. Stain- ing for cell nuclei was obtained with Hoechst 33258 (Sigma Aldrich, USA) dye for 10 seconds. The slides were scanned using the Panoramic 250 FLASH scanner with the pco.edge camera at 20× magnification (PCO AG,
Germany). Relative quantification of Septin-9 protein expression was done by determining Alexa Fluor 546 mean fluorescence intensity per pixel of selected area of epithelial and stromal cells (10 and 4 areas, respectively) using the Histoquant application within the Panoramic Viewer Software V1.15 (3DHISTECH Ltd., Hungary);
mean fluorescence intensity per pixel was measured.
Data were analyzed using one-way ANOVA.
Results
The mPCR assay established for this study included pri- mer pairs for 13 different loci (Additional file 3: Table S3;
only the results for SEPT9-related loci are presented in this paper). The eight amplicons within and near SEPT9 covered a total of 130 CpGs and were located predomin- antly in CpG-rich regions, except for amplicon 3, which had a lower CpG density (Figure 1 and Additional file 4:
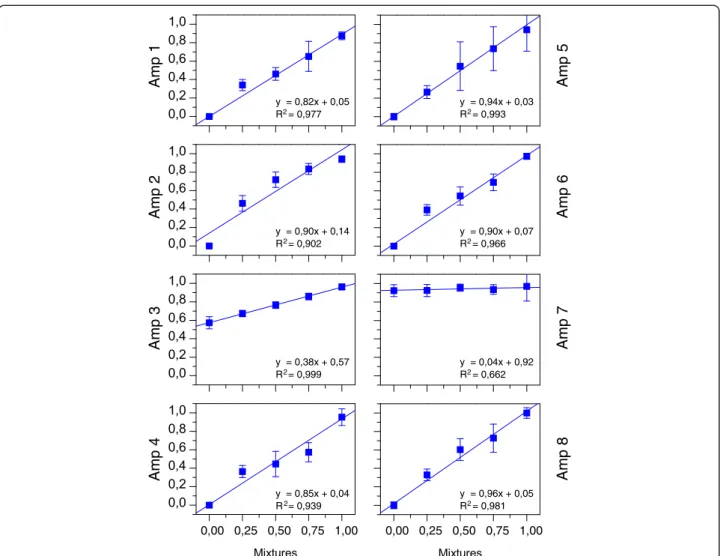
Figure S1). The suitability of the amplicons for quantita- tively determining methylation levels were assessed with the calibration experiments. A slope of the linear regres- sion curve close to one and offset values close to zero were indicative for sensitive assays. The results from these experiments showed that the methylation levels of six of the eight amplicons were well quantified while the results for amplicons 3 and 7 were ambiguous (Figure 2). Sperm DNA was considered an inappropriate control DNA for these loci because both appeared to be either fully or par- tially methylated. However, since the sample sequencing
chr17 (q25.2-q25.3) 13.313.2 p13.1 17p12 17p11.2 17q11.2 17q12 21.31 17q22 24.2q24.3q25.1 17q25.3
Amplicons Scale chr17:
CpG Islands
100 kb hg19
75250000 75300000 75350000 75400000 75450000 75500000
(CpG islands < 300 bases are light green)
SEPT9-204 / v1 SEPT9-208 / v5
SEPT9-201 / v3
SEPT9-203 / v2 SEPT9-206 / v6
SEPT9-209 / v7
SEPT9-205 / v4 GC Percent
Scale chr17:
CpG Islands
2 kb hg19
75367500 75368000 75368500 75369000 75369500 75370000 75370500 75371000 75371500 75372000 75372500 75373000 75373500
SEPT9-204 / v1 SEPT9-208 / v5 SEPT9-201 / v3
SEPT9-203 / v2
SEPT9-206 / v6 GC Percent
Amplicons
(1) (2) (3)
(4) (5) (6) (7)
(8) (4-7)
A
B
CGI1 CGI2 CGI3
CGI3
CGI4
SEPT9-207 / v7
SEPT9-207 / v7
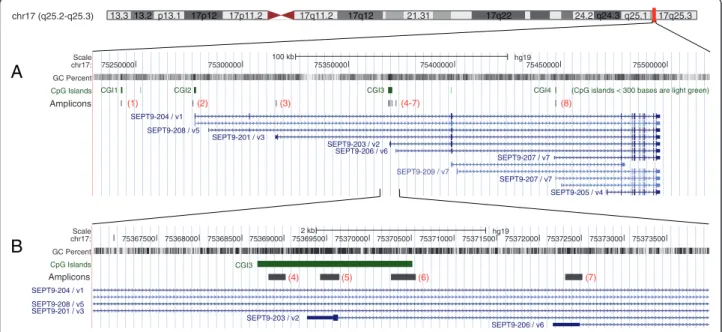
Figure 1Genomic organization of SEPT9.The UCSC genome browser (http://genome.ucsc.edu) was used to display the location and genomic organization of SEPT9 on chromosome 17q25.(A)Genomic region covering approximately 300 kb: the eight amplicons (IDs given in red letters and within brackets) are shown after aligning their sequences using BLAST; CpG islands are shown in the track above the amplicons and gene transcripts are shown in the tracks below the amplicons. CGIs were numbered for easier reference within this manuscript. The UCSC display of transcripts is annotated with the combined IDs from Ensembl and NCBI/gene map for easier cross platform identification.(B)Detail of approximately 6 kb showing a higher resolution of the locations of the closely neighboring amplicons 4 to 7.
results obtained with these two assays were consistent and reproducible, even at lower levels of methylation, we accepted these results in the absence of complete cali- bration data. Together, these eight assays generated ro- bust data from the 96 samples analyzed.
DNA methylation of SEPT9
The results obtained from the eight amplicons within and near SEPT9 provided an overview of the methyla- tion landscape of this gene for two different cell types (Figure 3). One extragenic and three intragenic CpG islands were designated as CGI1, CGI2, CGI3, and CGI4 (Figure 1). CGI3 was the largest of these CpG islands and previously described as differentially methylated in colorectal cancer [17]. This region was covered by three non-overlapping amplicons to obtain a higher resolution of methylation changes in the region.
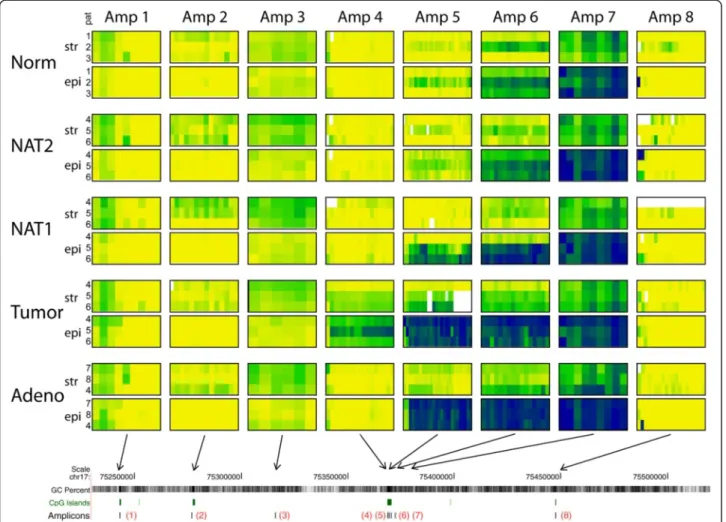
Disease-associated aberrant methylation was seen ex- clusively in CGI3 (Figure 3) while the other regions in
SEPT9 did not show detectable alterations in their methylation status. Amplicon 5, located centrally in CGI3, showed large methylation differences between normal samples and those from colon adenomas and tumors;
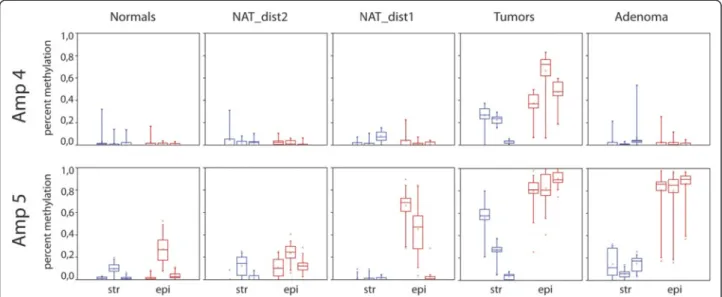
this difference was the most pronounced in epithelial cells (Figures 3 and 4). The methylation difference be- tween normal and tumor tissue in these cells exceeded 80% and was highly significant (p <0.0001). Equally pro- nounced was the difference in epithelial cells between nor- mal and adenomatous tissue. NAT1 samples (i.e., < 1 cm from the tumor) showed significantly elevated methylation levels (p <0.0001) in the epithelial cells in two of the three tumors, a finding that supports the concept of a field effect in CRC [28,29]. This effect was not seen in the third NAT1 sample. No significant methylation dif- ferences were observed between epithelial cells derived from normal and NAT2 samples (p > 0.05). In contrast, in stromal cells, an increase in methylation was seen mainly in tumor samples with changes up to 50%, while
Amp 1Amp 2Amp 3Amp 4
0,00 0,25 0,50 0,75 1,00
Amp 5Amp 6Amp 7Amp 8
0,00 0,25 0,50 0,75 1,00
y = 0,85x + 0,04 R = 0,9392
y = 0,96x + 0,05 R = 0,9812 y = 0,38x + 0,57
R = 0,9992
y = 0,04x + 0,92 R = 0,6622 y = 0,90x + 0,07 R = 0,9662 y = 0,90x + 0,14
R = 0,9022 y = 0,82x + 0,05 R = 0,9772
y = 0,94x + 0,03 R = 0,9932
Figure 2Amplicon calibration curves.Methylation of the artificial DNA mixtures is shown on the x-axis, and the experimentally determined methylation value for each amplicon is shown on the y-axis. Both values are given as a percentage of fully methylated DNA.
in adenomas, methylation levels increased by less than 20%. No increase was detected in stromal cells of the NAT samples. These data suggest that the observed ab- errant methylation in SEPT9 - CGI3 originates in epi- thelial cells and is associated with progression in the adenoma-carcinoma sequence.
Our results further show spreading of aberrant methy- lation from the core of CGI3 towards the 5′end which is covered by amplicon 4 (Figures 3 and 4). This methy- lation expansion was seen only in tumor samples and occurred in both epithelial and stromal cells. In aden- oma samples the 5′end of CGI3 remained unmethylated.
The 3′end of CGI3 (amplicon 6), and the region covered by the neighboring amplicon 7 (located outside CGI3), displayed elevated methylation in normal tissue samples with epithelial cells showing higher methylation levels than
stromal cells (Figure 3). In amplicon 7, all epithelial samples were fully methylated while stromal samples were partially methylated. The tumor-associated increase in methylation, which was seen with amplicon 5, was still detected with amplicon 6 but did not affect the region covered by amplicon 7. This pattern indicates the existence of a DNA methylation boundary neighboring CGI3.
In addition to these major methylation patterns in SEPT9, our results show patient-specific differences in the level of methylation (Figure 3). These differences are clearly seen in CGI3 but also seem to occur in CGI2 (amplicon 2). Although this study was based on a small number of patients, the averaging of sequencing data from several individual microdissected specimens (Additional file 2: Table S2) provided a higher degree of robustness against technical noise. Therefore, the subtle differences
Figure 3Bisulfite DNA sequencing results for SEPT9 amplicons.Each column displays results from one amplicon and each row displays results for one cell type. Within each of the rectangular boxes, the columns correspond to single CpGs and the three rows correspond to three patients. As all amplicons are drawn to the same scale the location of the amplicons is illustrated at the bottom with arrows pointing to the genomic map (compare to Figure 1). Color coding: yellow = unmethylated (0%), green = partially methylated (50%), blue = fully methylated (100%), and lighter or darker green/blue colors provide methylation levels below or above 50%. White areas = no sequencing data available.
Abbreviations: str = stromal cells, epi = epithelial cells, Norm = normal colon tissue, NAT1 = normal adjacent tissue (1 cm away from tumor), NAT2 = normal adjacent tissue (> 10 cm from tumor), Adeno = adenoma tissue, pat = patient no.: only the last number of the patient ID in Additional file 1: Table S1 is shown here.
seen between patients may reflect biological differences especially when they appear in parallel in multiple amplicons (e.g., amplicons 5 and 6). In most stromal cells, amplicon 2 displayed higher methylation levels (up to 25%) in comparison to epithelial cells in all five tissue groups (Figure 3). Amplicon 2 is located within CGI2, which is associated with the transcription start site (TSS) of SEPT9_v1, the longest and possibly the most prominent of the SEPT9 transcripts.
Immunohistochemistry
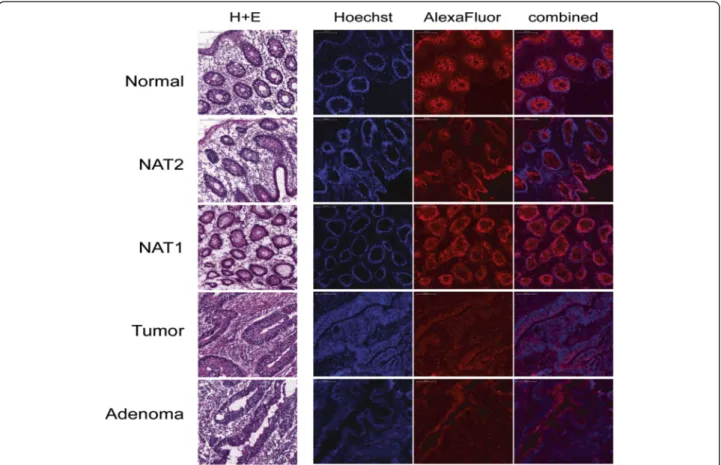
Antibody staining for Septin-9 was positive in all tissue samples irrespective of disease status (Figure 5). In addition, the protein was found in both epithelial and stromal cells, although, at different levels. Septin-9 protein level was significantly higher in epithelial cells than in stromal cells derived from normal and NAT1 tissues (p <0.001) (Figure 6). In adenoma and tumor samples, the epithe- lial Septin-9 level was not different from that found in stromal cells (Figure 6). In all five tissue groups, the level of the Septin-9 protein in stromal cells was com- parable with the lowest Septin-9 level found in tumor samples.
Discussion
Methylation in SEPT9 CGI3
We investigated cell-type specific DNA methylation in eight different regions of the SEPT9 gene in normal, adenoma, and tumor tissues using LCM-separated pop- ulations of epithelial and stromal cells. Our results showed major changes in the methylation pattern in diseased tis- sues in only one of the CpG islands investigated (CGI3).
The observed aberrant methylation in adenoma and tumor samples clearly originated in epithelial cells while in stromal cells, hypermethylation at this locus occurred only after hypermethylation in epithelial cells (Figure 3). The results also indicate spreading of aberrant methylation from the core of CGI3 to the 5′end of the island. This methylation expansion was observed only in CRC samples while in adenoma samples, the 5′end of CGI3 remained clear of methylation indicating that it is a relatively late event in CRC formation. Such a distinctive methylation pattern in the adenoma samples could be described as a transi- tory methylation status which fits between the normal and tumor samples. Together, these findings indicate that methylation changes in the core of CGI3 of the SEPT9 gene reflect the cellular progression towards malignancy in colon mucosa. These findings imply that alterations in this differentially methylated region (DMR) within SEPT9 represent early events in colon carcinogenesis and may directly contribute to colorectal tumor etiology. Although stromal cells seemed to undergo molecular alterations after changes to epithelial cells, the cells comprising the stromal microenvironment are known to also play an important role in the progression of cancer [30]. Epi- genetic differences between epithelial and stromal cells in colon cancer have already been explored in several studies [31-33]. The exact mechanism by which the epi- genetic status of one cell is transferred to a neighboring cell is not understood, but it has been hypothesized that multiple elements are involved, such as defects in the epithelial basement membranes, composition of the extracellular matrix, soluble agents (e.g., growth factors and cytokines), and direct cell-to-cell contacts [34,35].
Figure 4Box plot diagrams of SEPT9 methylation.Results from amplicons 4 and 5 in different LCM tissue specimens. Data are shown separately for stromal (str) and epithelial (epi) cells and for the three patients in each group. Red = epithelial cells, blue = stromal cells. The horizontal bar within boxes shows the median, dots within the boxes the means, the lower and upper boundaries of boxes show the 25th and 75th percentiles, the whiskers are determined by the 5th and 95th percentiles.
For a neoplastic cell to become invasive, it must first acquire the potential for proteolytic degradation of the basement membrane and actively migrate into the sur- rounding mesenchymal compartment, which requires the dissolution of intracellular and cell-matrix contacts [34].
Because Septin-9 is involved in cytokinesis, it is possible that a deregulated SEPT9 gene could impact the pro- pensity of a cell for migration and invasiveness. Add- itionally, accumulating evidence describing the involvement of SEPT9 in the mechanism of epithelial-mesenchymal transition [36] provides further support for such a con- nection. Considering that transcription of SEPT9 produces several different isoforms, a particular ratio of these transcripts may be needed to sustain normal cellular physiology. If disease-related hypermethylation, such as what we observed with CGI3, suppresses the normal ex- pression of one of these transcripts, differently structured filaments may form affecting key cellular functions [8].
Both the genomic location of CGI3 and the presence of a TSS in this specific region (Figure 1) strongly suggest a direct role in the regulation of transcript variant 2 (tv-2).
Figure 6Quantification of immunohistochemistry results.Expression of Septin-9 protein in stromal (blue boxes) and epithelial (red boxes) cells.
The Y axis displays arbitrary units for the normalized fluorescence signals (ratio AlexaFluor 546 to Hoechst) in IHC slides. Each box plot contains multiple scanned slide sections from three patients.
Figure 5Histopathology and Septin-9 immunohistochemistry.The images for H&E staining and IHC were obtained from adjacent sections and are from the same blocks used for LCM sampling. H&E staining in the left panel shows overall tissue morphology. The three IHC images per patient are from one slide: Hoechst staining (blue) marks nuclei, AlexaFluor 546 (red) shows Septin-9 protein; the right panel shows the combination of Hoechst and AlexaFluor 546. For better visualization of the Hoechst staining, these images were obtained with intensified brightness for the blue channel. Normal sections are from BSM0451; NAT1, NAT2, and tumor are from BSM0456, and adenoma is from BSM0457.
All images are at 20x magnifications; the scale bars correspond to 100μm.
Experiments are currently underway to determine whether the expression of this or any of the other transcripts is altered in epithelial cells in adenoma and in colorectal cancer. It is of further interest to note that CGI3 also harbors the specific CpGs interrogated by the early CRC detection test, Epi proColon®, which is currently available for clinical application in Europe [21]. Our findings pro- vide further evidence that EpiproColon® targets SEPT9 at the most informative site of this biomarker gene.
Immunohistochemistry
Our results from the IHC analysis of the different tissues indicated a significant reduction of epithelial Septin-9 protein levels in adenoma and tumor tissue. It is tempt- ing to speculate that the increase in SEPT9 methylation of CGI3 in adenoma and tumor samples is directly re- sponsible for the reduced Septin-9 expression levels.
However, our current methylation data alone cannot ex- plain the different levels of Septin-9 protein in epithelial and stromal cells, as stromal cells display low levels of Septin-9 protein and their SEPT9 gene is not methylated.
Additionally, the increased SEPT9 methylation seen in NAT1 samples and in stromal cells of tumor tissue does not seem to be reflected in a corresponding reduction in protein levels in the same samples. Nevertheless, it is interesting that a reduction of Septin-9 protein levels in epithelial cells was also found in an earlier exploratory study in which a different antibody for Septin-9 detec- tion was used [27]. In our present study, the polyclonal antibody targeted a sequence of 29 amino acids close to the C-terminal end, which is preserved in at least seven Septin-9 isoforms. The antibody used in the previous study targeted a region with a variable length close to the N-terminus detecting only three Septin-9 isoforms.
Despite these differences, both studies provided evidence for a reduced Septin-9 protein level in colon adenoma and in CRC. Each of the Septin-9 proteins will need to be targeted simultaneously with highly specific monoclonal antibodies to determine whether the observed aberrant methylation in one CpG island leads to a reduction in pro- tein expression, and if all isoforms are affected equally.
Furthermore, histone modifications within SEPT9 may need to be considered in different cell types as these modifications are known to impact the regulation of transcription [37].
Methylation in additional SEPT9 regions
While CGI3 is a DMR in cells of the colon mucosa, the same cannot be said for other regions analyzed in this study. Earlier studies reported evidence for epigenetic regulation of SEPT9 in ovarian cancer [38] and in head and neck cancer [39], but did not indicate the exact regions involved. Epigenetic regulation of SEPT9 was recently implicated in breast cancer by Connolly et al.
[16] who reported increased total SEPT9 mRNA expres- sion and an overall increase in Septin-9 protein levels in breast cancer tissue when compared with normal tissue.
In addition, the group found the silencing of a specific transcript variant 3 (tv-3) and the decrease of the Septin-9 protein encoded by tv-3. Elevated methylation in tumor and NAT tissue samples was proposed to trigger these effects. However, the reported region is CpG poor when mapped to the current hg19 build of the human genome, upstream of the first exon for tv-3. The same region is located about 3 kb upstream of amplicon 3 in our study (Figure 1). The reported absolute methylation levels be- tween normal and tumor tissues differed by less than 12%. In comparison, differential methylation in the core of CGI3 seen in our study exceeded 80% in epithelial cells. It remains to be demonstrated whether the same CpG islands in SEPT9 are aberrantly methylated in dif- ferent tumors and how those CpG islands may impact the expression of the various mRNAs.
Methylation boundary
The consistently methylated region covered by amplicon 7, positioned approximately 2 kb downstream of CGI3, stood out as a characteristic feature in the SEPT9 methy- lation landscape of our samples (Figure 3). We compared our results with publicly available next-generation se- quencing data [40]. This database also indicated complete methylation in this particular region in all cell types for which data were available. In addition, the presence of a CTCF binding site approximately 100 bp downstream of amplicon 6 further underscores the functional relevance of this region [41]. Supported by these observations, we concluded that the region around amplicon 7 represents a DNA methylation boundary. Stromal cells in this re- gion consistently displayed lower levels of methylation, which further supports our observation of epigenetic differences between stromal and epithelial cell types.
Boundary elements are frequent features of CpG islands, and they define functionally important domains, such as insulators that may block enhancer activities [42]. The boundary elements, however, are not unchangeable fea- tures of a particular region. Loss of methylation bound- aries have been described in fragile-X syndrome [43], and the shift of boundary elements, either inward or outward of the respective CGI, were reported in colon cancer [44]. Either of these situations leads to a loss of methylation stability in the DMR. Interestingly, while our data indicate the presence of a methylation bound- ary downstream of CGI3, it seems that the position is not shifted in tumor tissue and does not disappear as the location of this element in the region of amplicons 6 and 7 persists in both adenoma and tumor tissues. Genome- wide methylation analyses of the colon have suggested that local detection of CGI hypermethylation usually reflects
only the shift of a boundary element [44]. Additional stud- ies will be required to determine whether this model also applies to SEPT9 or if this CGI is unusual, e.g., it is flanked by a position invariable methylation boundary.
Conclusions
Our results support the idea that epigenetic deregulation of SEPT9 plays a role in the development of colorectal cancer. Aberrant hypermethylation of this gene occurs only in one of its CpG islands and this hypermethylation likely is an early event in the adenoma-carcinoma sequence.
Tumor-associated aberrant methylation in the colon mu- cosa originates in epithelial cells and precedes similar alter- ations in stromal cells. Our data further provide a direct link between the region interrogated by the EpiproColon®
assay, which detects methylation of SEPT9 in cell-free DNA in plasma and the underlying events in the tissue of cancer patients. It is now evident that the EpiproColon® test, cur- rently available for clinical application in Europe, obtains its diagnostic utility by targeting the very region of the SEPT9 promoter that displays the highest susceptibility to methylation changes in the adenoma-carcinoma se- quence. Additional applications of this biomarker in oncology, beyond the known utility for diagnostic screen- ing, are also conceivable.
Endnotes
aThroughout this manuscript the human gene septin 9 is described with the gene symbol name “SEPT9” while
“Septin-9”is used for the protein, following the recommended nomenclature by Expasy Gene/Protein Synonyms databank and UniProt database.
Additional files
Additional file 1: Table S1.Patient characteristics and clinical data.
Additional file 2: Table S2.Collected LCM specimens.
Additional file 3: Table S3.Primers used for mPCR and sPCR assays.
Reverse primers used for locus specific resequencing after mPCR were as shown in the table but had an added‘cgtcgtcg’-tag at their 5′end.
Additional file 4: Figure S1.Amplicon information. Distribution of CpGs within each of the eight amplicons for SEPT9. All amplicons are drawn to the same scale; the real length of each amplicon, given in base pairs, is shown in the second column, and the number of CpGs covered by the respective amplicon in the third column.
Abbreviations
CGI:CpG island; CIMP: CpG island methylator phenotype; CpG: Cytosine guanine dinucleotide; CRC: Colorectal cancer; CTCF: CCCTC-binding factor;
DMR: Differentially methylated region; GTP: Guanosine triphosphate;
H&E: Hematoxylin and Eosin (stain); IHC: Immunohistochemistry; LCM: Laser capture microdissection; MLL: Myeloid/lymphoid or mixed-lineage leukemia gene; mPCR: Multiplex PCR; NAT: Normal adjacent tissue; OCT: Optimal cutting temperature media; PBL: Peripheral blood lymphocytes;
PBS: Phosphate buffered saline; PMR: Percent of methylated reference;
qPCR: Quantitative PCR; SEPT9: Septin 9 gene; sPCR: Singleplex PCR;
TSS: Transcription start site; tv: Transcription variant.
Competing interests
RW and MK were employees at Epigenomics AG at the time the study was designed and the experiments were performed. AZS was an employee at and currently is consultant to Epigenomics Inc. RW and AZS are shareholders of Epigenomics. All other authors declare that they have no competing interests.
Authors’contributions
BM, MK, and RW conceived the study; MK designed primers and performed a pilot study to establish the approach; SS collected the samples and performed cryosectioning; AK and KT performed LCM and IHC experiments;
GV measured and analyzed IHC data; RW supervised and analyzed all methylation related experiments and wrote the manuscript; AZS and ZT contributed to the design and critical review of the manuscript. All authors read and approved the final manuscript.
Acknowledgements
The authors would like to thank Stefanie Vente (Epigenomics AG) for excellent technical work, Gabriella Kónyáné Farkas (Semmelweis University) for her technical support in the IHC experiments, Dr. Esmeralda Heiden (Epigenomics AG, now at Charité, Berlin) for contributing to the study plan, Dr. Joern Lewin (Epigenomics AG) for support with ESME analysis, and Dr. Florian Herse (ECRC, Max-Delbrück-Center, Berlin) for providing logistical support for some experiments. The authors also thank Christine Kuepfer for providing medical writing services on behalf of Epigenomics.
Author details
1Epigenomics AG, Berlin, Germany.2Current address: Delta-Vir GmbH, Leipzig, Germany.32nd Department of Internal Medicine, Semmelweis University, Budapest, Hungary.4Current address: Zymo Research, Irvine CA 92614, USA.
5Epigenomics Inc, Seattle, WA 98104, USA.6Molecular Medicine Research Unit, Hungarian Academy of Science, Budapest, Hungary.
Received: 17 February 2013 Accepted: 28 August 2013 Published: 30 August 2013
References
1. Novak P, Jensen TJ, Garbe JC, Stampfer MR, Futscher BW:Stepwise DNA methylation changes are linked to escape from defined proliferation barriers and mammary epithelial cell immortalization.Cancer Res2009, 69:5251–5258.
2. Feinberg AP, Ohlsson R, Henikoff S:The epigenetic progenitor origin of human cancer.Nat Rev Genet2006,7:21–33.
3. Baylin SB, Jones PA:A decade of exploring the cancer epigenome - biological and translational implications.Nat Rev Cancer2011,11:726–734.
4. Osaka M, Rowley JD, Zeleznik-Le NJ:MSF (MLL septin-like fusion), a fusion partner gene of MLL, in a therapy-related acute myeloid leukemia with a t(11;17)(q23;q25).Proc Natl Acad Sci U S A1999,96:6428–6433.
5. Russell SE, McIlhatton MA, Burrows JF, Donaghy PG, Chanduloy S, Petty EM, Kalikin LM, Church SW, McIlroy S, Harkin DP, Keilty GW, Cranston AN, Weissenbach J, Hickey I, Johnston PG:Isolation and mapping of a human septin gene to a region on chromosome 17q commonly deleted in sporadic epithelial ovarian tumors.Cancer Res2000,60:4729–4734.
6. Montagna C, Lyu MS, Hunter K, Lukes L, Lowther W, Reppert T, Hissong B, Weaver Z, Ried T:The Septin 9 (MSF) gene is amplified and
overexpressed in mouse mammary gland adenocarcinomas and human breast cancer cell lines.Cancer Res2003,63:2179–2187.
7. Scott M, Hyland PL, McGregor G, Hillan KJ, Russell SE, Hall PA:Multimodality expression profiling shows SEPT9 to be overexpressed in a wide range of human tumours.Oncogene2005,24:4688–4700.
8. Estey MP, Kim MS, Trimble WS:Septins.Curr Biol2011,21:R384–R387.
9. Sandrock K, Bartsch I, Bläser S, Busse A, Busse E, Zieger B:Characterization of human septin interactions.Biol Chem2011,392:751–761.
10. McIlhatton MA, Burrows JF, Donaghy PG, Chanduloy S, Johnston PG, Russell SE:
Genomic organization, complex splicing pattern and expression of a human septin gene on chromosome 17q25.3.Oncogene2001,20:5930–5939.
11. Peterson EA, Petty EM:Conquering the complex world of human septins:
implications for health and disease.Clin Genet2010,77:511–524.
12. Scott M, McCluggage WG, Hillan KJ, Hall PA, Russell SE:Altered patterns of transcription of the septin gene, SEPT9, in ovarian tumorigenesis.Int J Cancer2006,118:1325–1329.
13. Gonzalez ME, Peterson EA, Privette LM, Loffreda-Wren JL, Kalikin LM, Petty EM:
High SEPT9_v1 expression in human breast cancer cells is associated with oncogenic phenotypes.Cancer Res2007,67:8554–8564.
14. McDade SS, Hall PA, Russell SE:Translational control of SEPT9 isoforms is perturbed in disease.Hum Mol Genet2007,16:742–752.
15. Connolly D, Abdesselam I, Verdier-Pinard P, Montagna C:Septin roles in tumorigenesis.Biol Chem2011,392:725–738.
16. Connolly D, Yang Z, Castaldi M, Simmons N, Oktay MH, Coniglio S, Fazzari MJ, Verdier-Pinard P, Montagna C:Septin 9 isoform expression, localization and epigenetic changes during human and mouse breast cancer progression.
Breast Cancer Res2011,13:R76.
17. Lofton-Day C, Model F, Devos T, Tetzner R, Distler J, Schuster M, Song X, Lesche R, Liebenberg V, Ebert M, Molnar B, Grützmann R, Pilarsky C, Sledziewski A:DNA methylation biomarkers for bloodbased colorectal cancer screening.Clin Chem2008,54:414–423.
18. Grützmann R, Molnar B, Pilarsky C, Habermann JK, Schlag PM, Saeger HD, Miehlke S, Stolz T, Model F, Roblick UJ, Bruch HP, Koch R, Liebenberg V, Devos T, Song X, Day RH, Sledziewski AZ, Lofton-Day C:Sensitive detection of colorectal cancer in peripheral blood by septin 9 DNA methylation assay.PLoS One2008,3:e3759.
19. DeVos T, Tetzner R, Model F, Weiss G, Schuster M, Distler J, Steiger KV, Grützmann R, Pilarsky C, Habermann JK, Fleshner PR, Oubre BM, Day R, Sledziewski AZ, Lofton-Day C:Circulating methylated SEPT9 DNA in plasma is a biomarker for colorectal cancer.Clin Chem2009,55:1337–1346.
20. Payne SR:From discovery to the clinic: the novel DNA methylation biomarker (m)SEPT9 for the detection of colorectal cancer in blood.
Epigenomics2010,2:575–585.
21. Epi proColon website.http://www.epigenomics.com/en/products-services/
epi-procolon.html.
22. Mouliere F, Robert B, Arnau Peyrotte E, Del Rio M, Ychou M, Molina F, Gongora C, Thierry AR:High fragmentation characterizes tumour-derived circulating DNA.PLoS One2011,6:e23418.
23. Dietrich D, Lesche R, Tetzner R, Krispin M, Dietrich J, Haedicke W, Schuster M, Kristiansen G:Analysis of DNA methylation of multiple genes in microdissected cells from formalin-fixed and paraffin-embedded tissues.J Histochem Cytochem2009,57:477–489.
24. Eckhardt F, Lewin J, Cortese R, Rakyan VK, Attwood J, Burger M, Burton J, Cox TV, Davies R, Down TA, Haefliger C, Horton R, Howe K, Jackson DK, Kunde J, Koenig C, Liddle J, Niblett D, Otto T, Pettett R, Seemann S, Thompson C, West T, Rogers J, Olek A, Berlin K, Beck S:DNA methylation profiling of human chromosomes 6, 20 and 22.Nat Genet2006, 38:1378–1385.
25. Lewin J, Schmitt AO, Adorján P, Hildmann T, Piepenbrock C:Quantitative DNA methylation analysis based on four-dye trace data from direct sequencing of PCR amplificates.Bioinformatics2004,20:3005–3012.
26. Illingworth R, Kerr A, Desousa D, Jørgensen H, Ellis P, Stalker J, Jackson D, Clee C, Plumb R, Rogers J, Humphray S, Cox T, Langford C, Bird A:A novel CpG island set identifies tissue-specific methylation at developmental gene loci.PLoS Biol2008,6:e22.
27. Tóth K, Galamb O, Spisák S, Wichmann B, Sipos F, Valcz G, Leiszter K, Molnár B, Tulassay Z:The influence of methylated septin 9 gene on RNA and protein level in colorectal cancer.Pathol Oncol Res2011,17:503–509.
28. Dakubo GD, Jakupciak JP, Birch-Machin MA, Parr RL:Clinical implications and utility of field cancerization.Cancer Cell Int2007,7:2.
29. Ushijima T:Epigenetic field for cancerization.J Biochem Mol Biol2007, 40:142–150.
30. Peddareddigari VG, Wang D, Dubois RN:The tumor microenvironment in colorectal carcinogenesis.Cancer Microenviron2010,3:149–166.
31. Ishiguro K, Yoshida T, Yagishita H, Numata Y, Okayasu T:Epithelial and stromal genetic instability contributes to genesis of colorectal adenomas.Gut2006,55:695–702.
32. Sheehan KM, Gulmann C, Eichler GS, Weinstein JN, Barrett HL, Kay EW, Conroy RM, Liotta LA, Petricoin EF 3rd:Signal pathway profiling of epithelial and stromal compartments of colonic carcinoma reveals epithelial-mesenchymal transition.Oncogene2008,27:323–331.
33. Moncada-Pazos A, Obaya AJ, Fraga MF, Viloria CG, Capellá G, Gausachs M, Esteller M, López-Otín C, Cal S:The ADAMTS12 metalloprotease gene is epigenetically silenced in tumor cells and transcriptionally activated in the stroma during progression of colon cancer.J Cell Sci2009,122:2906–2913.
34. Bosman FT, de Bruïne A, Flohil C, van der Wurff A, ten Kate J, Dinjens WW:
Epithelial-stromal interactions in colon cancer.Int J Dev Biol1993, 37:203–211.
35. Hanson JA, Gillespie JW, Grover A, Tangrea MA, Chuaqui RF, Emmert-Buck MR, Tangrea JA, Libutti SK, Linehan WM, Woodson KG:Gene promoter methylation in prostate tumor-associated stromal cells.J Natl Cancer Inst 2006,98:255–261.
36. Shankar J, Messenberg A, Chan J, Underhill TM, Foster LJ, Nabi IR:
Pseudopodial actin dynamics control epithelial-mesenchymal transition in metastatic cancer cells.Cancer Res2010,70:3780–3790.
37. Deaton AM, Bird A:CpG islands and the regulation of transcription.
Genes Dev2011,25:1010–1022.
38. Burrows JF, Chanduloy S, McIlhatton MA, Nagar H, Yeates K, Donaghy P, Price J, Godwin AK, Johnston PG, Russell SE:Altered expression of the septin gene, SEPT9, in ovarian neoplasia.J Pathol2003,201:581–588.
39. Bennett KL, Karpenko M, Lin MT, Claus R, Arab K, Dyckhoff G, Plinkert P, Herpel E, Smiraglia D, Plass C:Frequently methylated tumor suppressor genes in head and neck squamous cell carcinoma.Cancer Res2008, 68:4494–4499.
40. Hackenberg M, Barturen G, Oliver JL:NGSmethDB: a database for next- generation sequencing single-cytosine-resolution DNA methylation data.
Nucleic Acids Res2011,39(Database issue):D75–D79.
41. Wallace JA, Felsenfeld G:We gather together: insulators and genome organization.Curr Opin Genet Dev2007,17:400–407.
42. Burgess-Beusse B, Farrell C, Gaszner M, Litt M, Mutskov V, Recillas-Targa F, Simpson M, West A, Felsenfeld G:The insulation of genes from external enhancers and silencing chromatin.Proc Natl Acad Sci U S A2002, 99(Suppl 4):16433–16437.
43. Naumann A, Hochstein N, Weber S, Fanning E, Doerfler W:A distinct DNA-methylation boundary in the 5′- upstream sequence of the FMR1 promoter binds nuclear proteins and is lost in fragile X syndrome.Am J Hum Genet2009,85:606–616.
44. Hansen KD, Timp W, Bravo HC, Sabunciyan S, Langmead B, McDonald OG, Wen B, Wu H, Liu Y, Diep D, Briem E, Zhang K, Irizarry RA, Feinberg AP:
Increased methylation variation in epigenetic domains across cancer types.Nat Genet2011,43:768–775.
doi:10.1186/1471-2407-13-398
Cite this article as:Wasserkortet al.:Aberrant septin 9 DNA methylation in colorectal cancer is restricted to a single CpG island.BMC Cancer 201313:398.
Submit your next manuscript to BioMed Central and take full advantage of:
• Convenient online submission
• Thorough peer review
• No space constraints or color figure charges
• Immediate publication on acceptance
• Inclusion in PubMed, CAS, Scopus and Google Scholar
• Research which is freely available for redistribution
Submit your manuscript at www.biomedcentral.com/submit