DOI:10.28974/idojaras.2018.4.2
IDŐJÁRÁS
Quarterly Journal of the Hungarian Meteorological Service Vol. 122, No. 4, October – December, 2018, pp. 375–392
Trends in the frost-free season with parallel circulation and air mass statistics in Poland
Zuzanna Bielec-Bąkowska1, Katarzyna Piotrowicz2*, and Ewa Krępa-Adolf3
1 Faculty of Earth Science, University of Silesia, Będzińska str. 60, 41-200 Sosnowiec, Poland
2 Institute of Geography and Spatial Management, Jagiellonian University, Gronostajowa str. 7, 30-387 Kraków, Poland
3 Public Primary School No. 7 Budowlanych str. 40, 47-122 Opole, Poland
* Corresponding author E-mail: k.piotrowicz@uj.edu.pl (Manuscript received in final form November 18, 2017)
Abstract⎯This study describes the regularities in spatial and multiannual variations in the occurrence of last spring frost (LSF), first fall frost (FFF) and the length of the frost-free season (FFS). In the paper, daily minimum and maximum air temperatures recorded at 20 stations in Poland in 1951–2015 and a calendar of synoptic situations were used. It was found that at 75% of the analyzed stations the FFS period grew longer and the changes were statistically significant. Clearly, the longer length of the season is attributable to the earlier LSF dates. The frosts under investigation were recorded most frequently in anticyclonic situations, especially in the presence of an anticyclonic wedge (Ka) and a central anticyclone situation (Ca). LSFs and FFFs were predominantly accompanied by arctic (PA), polar maritime old (PPms), and polar continental (PPk) air masses.
Key–words: frost-free season, atmospheric circulation, air masses, Niedźwiedź’s calendar of synoptic situations, Poland
1. Introduction
Freeze events in spring and autumn (hereafter frost in spring, frost in autumn, or frost), which are defined as days with the minimum temperature below 0 °C and the maximum temperature above 0 °C (Kunkel et al., 2004; Tomczyk et al., 2015), have not only a significant influence on the growth of plants, but are also
crucial for the natural environment and human activity. For example, frosts can cause damages to trees, bushes, and other plants which have already started their vegetative growth, including flowers and/or fruiting buds (Chmielewski and Rötzer, 2000; Menzel, 2000; Scheifinger et al., 2002); they are added to the freeze-thaw processes thus accelerating frost weathering and influencing the life-cycle of insects and the spread of pests into new areas (Juszczak et al., 2019). Frosts also have impact on the transport and construction industries.
Long-term changes in the frost occurrence and the length of the frost-free season determine changes in the early and late phenological phases of various plants, determine the size of crops and fructification, and effect the thermal conditions of the vegetation period (Kożuchowski and Żmudzka, 2000; Żmudzka, 2003; Graczyk and Kundzewicz, 2016; Wypych et al., 2017). In turn, these changes force processes of adaptation including the need to use specific types of crops, methods, and dates of agrotechnical works, or the application of plant protection products at specific periodes of the year.
Climatological and particularly agroclimatological studies tend to focus on the thermal and precipitation conditions prevailing the vegetative period.
Multiannual variations in frost-free seasons, which are much shorter than vegetation seasons, are studied far less frequently. In Poland, the differences between the seasons reach as many as 50–60 days in southern and south-eastern Poland (except in mountainous areas), and they are the least pronounced (approximately 20 days) along the Baltic coast (Wypych et al., 2017).
Spring frosts can be particularly dangerous in forestry, agriculture, and above all in fruit farming and horticulture. They appear every year over large areas of Poland, most often in April and May (on average, between April 20 and May 25), and occasionally, also in early June (Czarnecka et al., 2009; Ustrnul et al., 2014; Tomczyk et al., 2015). Spring frosts usually occur on single days, but there are cases when they can last for more than 2 days. Most frequently, such frosts are mild in nature with the minimum temperature ranging between –0.1 and –2.0 °C, while strong frosts (tmin<–6 °C) occur very rarely in Poland (Tomczyk et al., 2015). In general, fall frosts cause much less damage to crops than spring frosts. They occur most frequently in September and October, sometimes in November, and along the Baltic coast, in extreme cases, even as late as December. Thus, on average, the first fall frosts are recorded between September 20 and November 5 (Tomczyk et al., 2015; Wypych et al., 2017).
Plants are gradually preparing for their winter dormancy, therefore, they can be damaged only by early frosts involving large air temperature drops.
The length of the frost-free season, which lasts on average 160–180 days in Poland, depends on local conditions (altitude, landform, land cover, and distance from water bodies). However, given the multiannual and seasonal changes in air temperatures observable in Poland and worldwide (nearly all seasons are warmer), it is certain that these changes will also be reflected in the dates of the
first and last frost, and the length of the frost-free season (Yu et al., 2014; Zhang et al., 2014; Modala et al., 2017).
The presence of frost within a given area is related, among other factors, to the synoptic situation (type of circulation and/or inflow of cool air masses), as well as the landform. The following types of frosts are distinguished: 1) radiation frost, associated with a high-pressure system, when the heat radiates from the surface into the atmosphere on a clear night and 2) advection frost, when wind moves air from cold regions. A third, mixed type of frost may be distinguished as radiation-advection frost (3).
Studies, e.g., by Yu et al. (2014) and Zhang et al. (2014) prove that in the Great Lakes region of the United States, there is a significant correlation between the last spring frost (LSF) and the Pacific North American (PNA) pattern index and between both the first fall frost (FFF) and the length of the frost-free season (FFS) and the Pacific Decadal Oscillation (PDO) indices (Yu et al., 2014), whereas on the Tibetan Plateau the length of the FFS depends on the Northern Hemisphere Polar Vortex indices (Zhang et al., 2014). In Central Europe and Poland, multi-annual variations in the FFS relative to the atmospheric circulation have not been extensively studied. Tomczyk et al. (2015) based such studies on values of the sea level pressure (SLP) and the height of the 500 hPa isobaric surface derived from reanalyses, and the types of circulation of the Grosswetterlagen classification. Ustrnul et al. (2014) narrowed down their research to the relationships between the occurrence of the last spring frost (LSF) and types of circulation using three classifications, the Grosswetterlagen, Lityński, and Niedźwiedź classifications. However, the above studies do not take into account the multiannual changeability in the types of circulation and air masses, which determines the occurrence of frost in this part of Europe. For this reason, the present study aims to investigate the spatiotemporal changes in the occurrence of the first and last frost and in the length of the frost-free season in Poland in 1951–2015, and to determine the frequency and changes in the types of circulation and air masses co-occurring with spring and fall frosts.
2. Data and methods
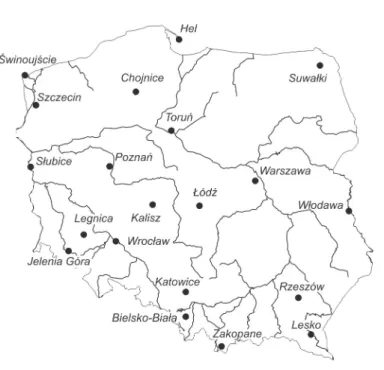
The study is based on daily minimum and maximum air temperature values read at 2 m above ground level at 20 synoptic stations of the Institute for Meteorology and Water Management in Poland in 1951–2015 (Fig. 1, Table 3).
The only exception was data from Rzeszów and Lesko, which covers the period starting in 1952 and 1955, respectively. Data have been checked, and they are homogeneous. The homogeneity of records was tested by means of the Alexandersson (1986) test. A frost day in spring and autumn is defined as one when the minimum temperature is lower than 0 °C and the maximum
temperature is higher than 0 °C (Kunkel et al., 2004; Tomczyk et al. 2015). In the individual years, the date of the last spring frost (LSF) and the date of the first fall frost (FFF) were determined for each station. These dates were the beginning and end dates of the frost-free season, respectively, used as the basis for determining the duration of the FFS. The trends of change in the beginning and end dates and the length of the frost-free season were determined using an equation of a linear regression, whereas trend significances were calculated using the Mann-Kendall test (Mann, 1945; Kendall, 1975).
Fig. 1. Meteorological stations used in the study.
Explaining the impact of atmospheric circulation on the occurrence of LSFs and FFFs requires the determination of mesoscale circulation and air mass types. For this reason, a calendar of synoptic situations developed by Niedźwiedź (2016a; Table 1 and 2), based on the period of 1873–2015 was used. Types of atmospheric circulation and air masses performed on the basis of synoptic maps came from the forecasting offices were determined. The identified synoptic situations are characteristic of the atmospheric conditions present in the basin of the upper Vistula (covering south-east Poland). Because some authors state that they can be used for identifying the synoptic weather conditions over the entire territory of Poland, relevant data was compared to verify this. For this purpose, a similar version of the calendar of synoptic situations for nine regions of Poland
spanning the period 2001–2015 was applied (Niedźwiedź, 2016b). The obtained results show that the differences between the frequency of the circulation types occurring on the frost days under study identified for the individual regions and for the basin of the upper Vistula may reach as much as 33%. As a consequence, the part of the analysis in question was conducted only for frost days occurring in Bielsko-Biała, Katowice, Zakopane, Rzeszów, and Lesko.
Table 1. Types of synoptic situations (according to catalogue of Niedźwiedź, 2016a)
Types of synoptic situations
Anticyclonic situations Cyclonic situations Symbol Direction of advection Symbol Direction of advection
Na North Nc North
NEa North–East NEc North–East
Ea East Ec East
SEa South–East SEc South–East
Sa South Sc South
SWa South–West SWc South–West
Wa West Wc West
NWa North–West NWc North–West
Ca Central anticyclonic
situation (high center) Cc Central cyclonic situation (low center)
Ka Anticyclonic wedge or
ridge of high pressure Bc Through of low pressure X unclassified situations or pressure col
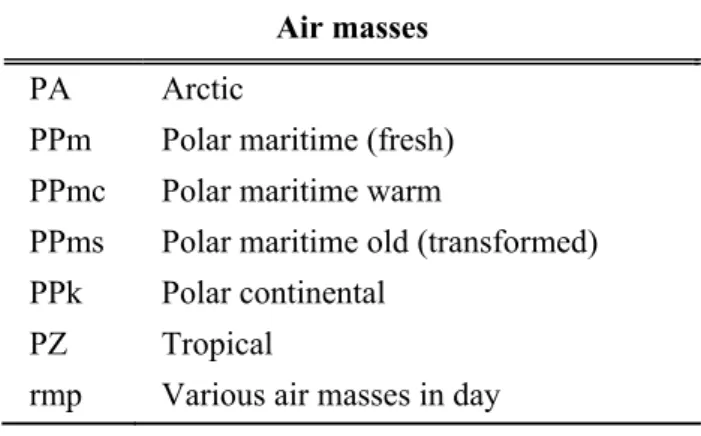
Table 2. Types of air masses (according to catalogue of Niedźwiedź, 2016a)
Air masses PA Arctic
PPm Polar maritime (fresh) PPmc Polar maritime warm
PPms Polar maritime old (transformed) PPk Polar continental
PZ Tropical
rmp Various air masses in day
3. The beginning, end, and length of the frost-free season
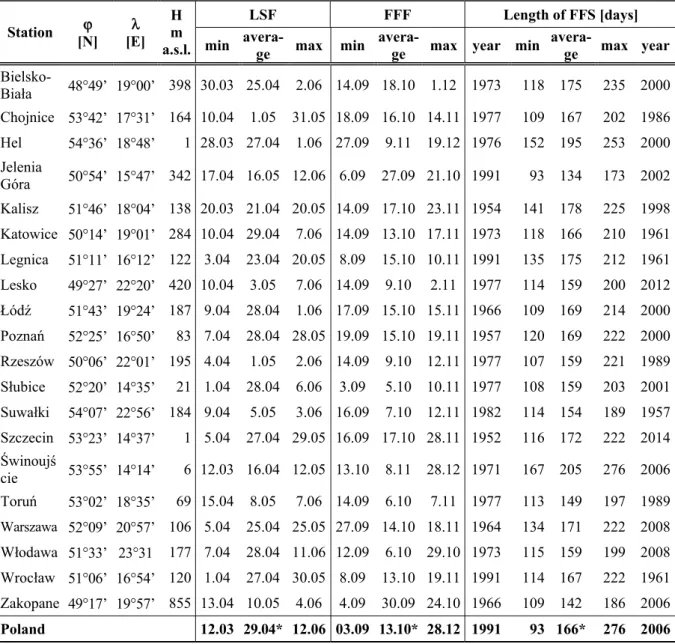
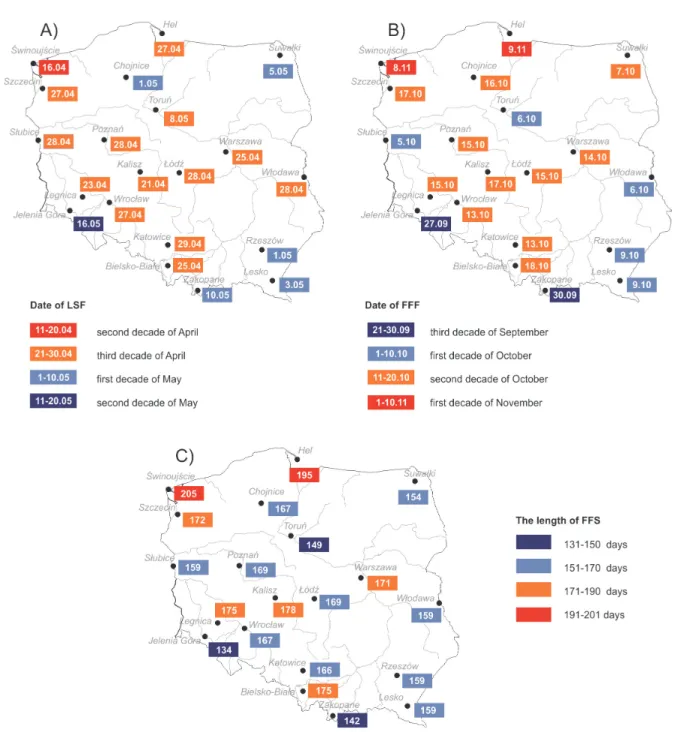
In Poland, in the years 1951–2015, on average the LSF fell on April 29, and the FFF fell on October 13. The FFS began the earliest in the northern (along the Baltic coast), western, and central parts of Poland (Fig. 2). On average, the LSF occurred as late as the first half of May in the north-east and south-east parts of Poland, in the mountains and intermontane valleys (Zakopane, Jelenia Góra), as well as in Toruń and Chojnice (Fig. 2). When analyzing the individual stations it was found that the earliest LSFs were recorded in Świnoujście, Hel, Kalisz, and Bielsko-Biała (March 12–30), while the latest ones was observed in Jelenia Góra and Włodawa (June 11–12) (Table 3).
Table 3. Dates of the last (LSF) and first frost day (FFF) and length of frost-free season (FFS) at selected stations in Poland (see also their coordinates) in the period of 1951–2015
Station ϕ [N] λ
[E]
H m a.s.l.
LSF FFF Length of FFS [days]
min avera-
ge max min avera-
ge max year min avera-
ge max year Bielsko-
Biała 48°49’ 19°00’ 398 30.03 25.04 2.06 14.09 18.10 1.12 1973 118 175 235 2000 Chojnice 53°42’ 17°31’ 164 10.04 1.05 31.05 18.09 16.10 14.11 1977 109 167 202 1986 Hel 54°36’ 18°48’ 1 28.03 27.04 1.06 27.09 9.11 19.12 1976 152 195 253 2000 Jelenia
Góra 50°54’ 15°47’ 342 17.04 16.05 12.06 6.09 27.09 21.10 1991 93 134 173 2002 Kalisz 51°46’ 18°04’ 138 20.03 21.04 20.05 14.09 17.10 23.11 1954 141 178 225 1998 Katowice 50°14’ 19°01’ 284 10.04 29.04 7.06 14.09 13.10 17.11 1973 118 166 210 1961 Legnica 51°11’ 16°12’ 122 3.04 23.04 20.05 8.09 15.10 10.11 1991 135 175 212 1961 Lesko 49°27’ 22°20’ 420 10.04 3.05 7.06 14.09 9.10 2.11 1977 114 159 200 2012 Łódź 51°43’ 19°24’ 187 9.04 28.04 1.06 17.09 15.10 15.11 1966 109 169 214 2000 Poznań 52°25’ 16°50’ 83 7.04 28.04 28.05 19.09 15.10 19.11 1957 120 169 222 2000 Rzeszów 50°06’ 22°01’ 195 4.04 1.05 2.06 14.09 9.10 12.11 1977 107 159 221 1989 Słubice 52°20’ 14°35’ 21 1.04 28.04 6.06 3.09 5.10 10.11 1977 108 159 203 2001 Suwałki 54°07’ 22°56’ 184 9.04 5.05 3.06 16.09 7.10 12.11 1982 114 154 189 1957 Szczecin 53°23’ 14°37’ 1 5.04 27.04 29.05 16.09 17.10 28.11 1952 116 172 222 2014 Świnoujś
cie 53°55’ 14°14’ 6 12.03 16.04 12.05 13.10 8.11 28.12 1971 167 205 276 2006 Toruń 53°02’ 18°35’ 69 15.04 8.05 7.06 14.09 6.10 7.11 1977 113 149 197 1989 Warszawa 52°09’ 20°57’ 106 5.04 25.04 25.05 27.09 14.10 18.11 1964 134 171 222 2008 Włodawa 51°33’ 23°31 177 7.04 28.04 11.06 12.09 6.10 29.10 1973 115 159 199 2008 Wrocław 51°06’ 16°54’ 120 1.04 27.04 30.05 8.09 13.10 19.11 1991 114 167 222 1961 Zakopane 49°17’ 19°57’ 855 13.04 10.05 4.06 4.09 30.09 24.10 1966 109 142 186 2006 Poland 12.03 29.04* 12.06 03.09 13.10* 28.12 1991 93 166* 276 2006
Notation for dates in the second and third columns: 30.03 stands for March 30, etc.;
* average from 20 stations, min – the earliest date or the shorter frost-free period max – the latest date or the longest frost-free period
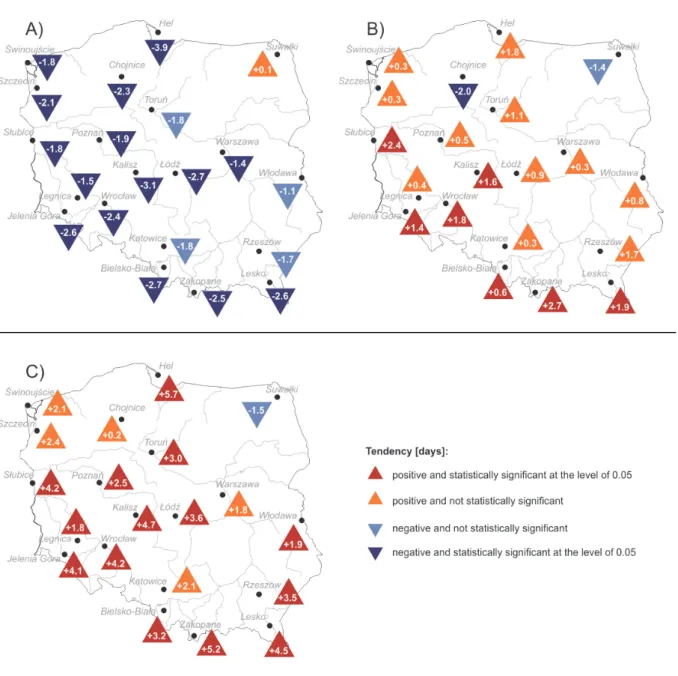
Fig. 2. Date of the last spring frost (A), first fall frost (B), and length of frost-free season (C) in Poland in the period of 1951–2015.
As a rule, the earliest FFFs occurred at stations located in eastern and southern Poland, including those lying in mountain valleys (Zakopane and Jelenia Góra – September 27–30), but also in Słubice, Toruń, Włodawa, Suwałki, Rzeszów, and Lesko (in the first decade of October) (Fig. 2). On the
other hand, the latest FFFs occurred at those sites, where the earliest beginning dates of the FFS were recorded, i.e., coastal stations (Hel and Świnoujście – November 8–9). In extreme cases, the FFF occurred on the first days of September (Słubice, Zakopane –September 3–4) or as late as the second half of December (Hel, Świnoujście –December 19–28) (Table 3).
Based on the extreme beginning and end dates of the FFS at the individual stations (Table 3), it was found that in Poland, in the period concerned, a potential FFS could last as many as 291 days (LSF recorded on March 12, 2014 in Świnoujście – FFF recorded on December 28, 2006 in Świnoujście). This means that in the last 9 years, the length of the season increased by 6 days (Bielec-Bąkowska and Piotrowicz, 2011). At the same time, the season without a single frosty day remained unchanged, spanning the period between June 13 and September 2, i.e., 82 days (LSF recorded on June 12, 1955 in Jelenia Góra – FFF recorded on September 3, 2003 in Słubice).
In the period under analysis, the FFS lasted 166 days on average (Table 3). The spatial differences in the length of the season clearly indicate a significant impact of local conditions. While at most stations the length of the season ranged between 160 and 180 days, it was shorter by 20–25 days at the stations located in intermontane valleys (134 days in Jelenia Góra, 142 days in Zakopane). By contrast, the moderating effect of the Baltic Sea lengthened the FFS to 195 days in Hel, and even to 205 days in Świnoujście (Fig. 2).
Naturally, in the individual years, the length of the FFS was determined by the weather conditions prevailing over a given area, even though it is difficult to identify a single year which would be particularly conducive to the occurrence of short- or long-lasting frosts. The examples could be the particularly short FFS recorded in Jelenia Góra in 1991, which lasted only 93 days, and the exceptionally long season in Świnoujście in 2006, which lasted more than 9 months (276 days).
4. Frost-free season change trends
Fifteen of the stations included in the study (75%) recorded increasingly early beginning dates of the FFS (statistically significant trend, p < 0.05), and another two stations observed indications of similar changes (Fig. 3). The greatest change was observed at the Hel station, where the LSF occurred earlier by an average of 3.9 days per 10 years. At the other sites, mainly those located in the southern and central-west parts of Poland, the change ranged between –1.4 days/decade in Warsaw and –3.1 days/decade in Kalisz. It was only the Suwałki station that recorded a slight shift towards later occurrence of LSF of 0.1 days/decade.
Fig. 3. Trends of shift in the beginning (A), end (B), and length (C) of the frost-free season (FFS) at selected stations in Poland in the period of 1951–2015.
The multiannual changes in the end dates of the frost-free season (FFF) are not so noticeable as in the case of the beginning dates (LSF). At only 7 stations (35%), most of which are located in the southern and south-western parts of Poland, the differences had proven to be positive and statistically significant at the level of 0.05 (Fig. 3). This means that the FFF occurred there at increasingly late dates. The values of these trends ranged between 1.4 in Jelenia Góra and 2.7 days/decade in Zakopane. 12 stations (60%) also show indications of later occurrence of the end of the FFS, even though the tendencies are not statistically significant. At the other two stations located in the northern part of the country
(Chojnice and Suwałki), FFF occurred slightly earlier towards the end of the period under study than in the mid-20th century (–2.0 and –1.5 days/decade, respectively), even though the changes had proven to be statistically significant only in Chojnice (Fig. 3).
As a result of the above shifts in the beginning and end dates of the FFS, the length of the season has changed. Except for Suwałki, it was clearly longer at all stations, with statistically significant changes at the level of 0.05 recorded at 14 of them (75%) (Fig. 3). The changes ranged between 1.8 days/decade in Legnica and 5.7 days/decade in Hel.
The described changes in the occurrence of spring and autumn frosts and in the length of the frost-free season (FFFs) are related to changes in the air temperature during the twentieth century. In a large part of Europe, increase in temperature was observed (Brázdil et al., 1996; Wibig and Głowicki, 2002; Yan et al., 2002; Alexander et al., 2006; Moberg et al., 2006). The pace of these changes was the fastest within the last quarter of the century (Klein Tank and Können, 2003).
Results of the research on seasonal air temperature changes in various regions of Europe have shown that the values of the change tendency were different (Brázdil et al., 1996; Wibig and Głowicki, 2002; Yan et al., 2002;
Alexander et al., 2006; Moberg et al., 2006). Studies of seasonal variability of air temperature in Central and Eastern Europe indicate that the temperature increased the most in wintertime – up to 3.5 °C/10 years (Brázdil et al., 1996).
Summer temperature trends showed a small increase, while spring and autumn temperature trends did not indicate a similar direction of change; however, temperature predominantly tended to increase rather than decrease.
Average trends, for 75 stations mostly representing the western part of Europe, showed a warming also for the maximum and minimum temperatures (Moberg et al., 2006). According to Alexander et al. (2006), in Europe the changes in the minimum temperature extremes are higher than the changes of the maximum temperature extremes. Winter has, on average, warmed more (1.0 °C/100 years) than summer (0.8 °C/100 years), both for daily maximum and minimum temperatures (Moberg et al., 2006). The value of the trends was also generally greater for the minimum temperature (Alexander et al., 2006).
5. Synoptic conditions of the beginning and end of the frost-free season The occurrence of frosts marking the beginning and end of the frost-free season is usually associated with specific synoptic situations, which include anticyclonic types of circulation and advection of very cold air masses (Ustrnul et al., 2014;
Tomczyk et al., 2015). Thus, the multiannual change in the FFS in Poland and worldwide, as described in the literature and mentioned above, should be associated with changes in the atmospheric circulation over a given area.
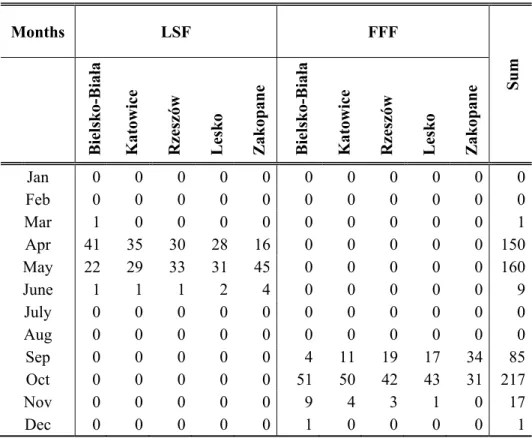
This part of the study checks what types of atmospheric circulation and air masses co-occurred most often with LSFs and FFFs in the multiannual period under study. As it was already stated above, the analysis comprises only 5 sites located in south-eastern Poland. Because nearly all the cases of frosts in question occurred as follows: spring frosts in April (46.9%) and May (50.0%), fall frosts in September (26.6%) and October (67.8%) (Table 4), the analysis is narrowed down to these periods of the year.
Table 4. Monthly distribution of the number of days with the last (LSF) and first (FFF) frost day at selected stations in Poland in the period of 1951–2015
Months LSF FFF
Sum
Bielsko-Biała Katowice Rzeszów Lesko Zakopane Bielsko-Biała Katowice Rzeszów Lesko Zakopane
Jan 0 0 0 0 0 0 0 0 0 0 0 Feb 0 0 0 0 0 0 0 0 0 0 0 Mar 1 0 0 0 0 0 0 0 0 0 1
Apr 41 35 30 28 16 0 0 0 0 0 150
May 22 29 33 31 45 0 0 0 0 0 160
June 1 1 1 2 4 0 0 0 0 0 9 July 0 0 0 0 0 0 0 0 0 0 0 Aug 0 0 0 0 0 0 0 0 0 0 0 Sep 0 0 0 0 0 4 11 19 17 34 85 Oct 0 0 0 0 0 51 50 42 43 31 217 Nov 0 0 0 0 0 9 4 3 1 0 17 Dec 0 0 0 0 0 1 0 0 0 0 1
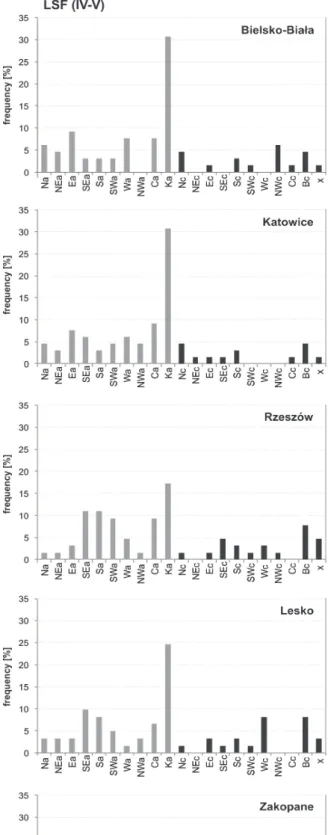
During the analyzed period, the occurrence of the last spring frost and particularly the first fall frost, was usually associated with the presence of the anticyclonic type of circulation over a given region. In spring, the frequency of such circulation ranged from 68.9% in Lesko to 80.0% in Katowice, while in fall – from 86.2% in Bielsko-Biała to 90.8% in Zakopane. However, it must be stressed that it would be hard to identify a single frequency distribution pattern for the types of circulation in question across the stations. Also, when comparing the occurrence of frost in fall and spring, it can be observed that the frequency of
the synoptic situations differ noticeably. This is attributable to the local nature of frosts which modifies the general tendencies in the distribution of air temperatures in an area.
Last spring frosts occurred most frequently during the presence of a ridge of high pressure over south-eastern Poland (from 17.2% in Rzeszów to 30.8% of the cases in Katowice and Bielsko-Biała) (Fig. 4). The other most distinguishable anticyclonic types included SEa, Sa, SWa (especially in Lesko and Rzeszów), Ca, while in Bielsko-Biała also Na, NEa and Ea. In fall, the predominant types of circulation involving first frosts were anticyclonic wedges and central anticyclonic situations (Ka and Ca; Fig. 4). The respective frequencies of their occurrence ranged from 13.8% in Bielsko-Biala to 25.0% in Katowice and from 12.3% in Lesko to 21.9% in Rzeszów. Against this background, Bielsko-Biała stands out in terms of the occurrence of fall frost, where they appeared with similar frequency during the types Na, Ea and SEa (12.3–13.8%). The combination of the three elements of circulation strongly determines the type of weather on a given day, in particular the radiation and thermal conditions.
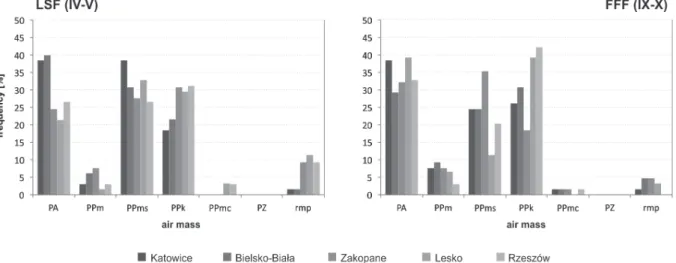
In the years of 1951–2015, both LSFs and FFFs were chiefly recorded during the advection of arctic (PA), polar maritime old (PPms), and polar continental (PPk) air masses (Fig. 5). In spring, a slightly higher frequency was observed for frosts occurring in PPms masses (31.3% of all cases), and the lowest was observed in PPk masses (25.9%). By contrast, in fall, the highest numbers of frost days were registered during the presence of PA masses (34.4%), and the lowest – when PPms was present over a given area (23.4%).
However, the frequency of frost in the air masses analyzed here varied considerably from site to site. This is best illustrated by the frequency of occurrence of LSF in PA masses, which ranged between 21.3% in Lesko and 40.0% in Bielsko-Biała, or of occurrence of FFF in PPk masses, which ranged from 18.5% in Zakopane to 42.2% in Rzeszów (Fig. 5).
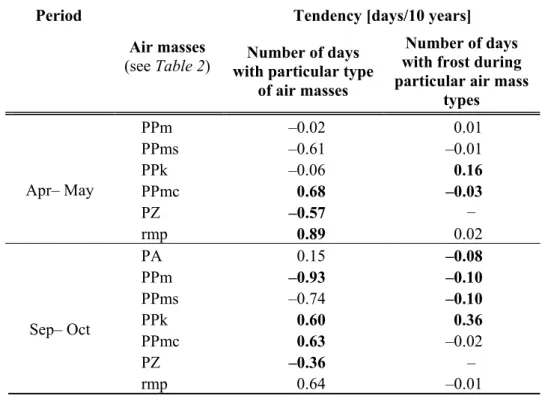
The correlations described above mean that an increase or decline in the number of days with a specific type of circulation or air mass should be reflected by a corresponding growth or decline in the number of frost days. However, given the small number of the days with frost under study, the correlations are not always noticeable or strong (Table 5 and 6). This is exemplified by the increase in the number of LSFs during SEa and Ka circulation patterns, and in the number of FFFs occurring during a ridge of high pressure (Ka). The number of frost days during such types of circulation from the beginning of the analyzed period increased as follows: for LSF by1.0 and 0.9, and FFF by 1.3. A clear correlation, indeed the strongest one, is noticeable for air masses in fall: there is a correlation between the decline in the frequency of occurrence of polar maritime fresh air masses (PPm) and the decline in the number of days with FFF, as well as, between the growth in the number of days with polar continental air (PPk) and the growth in the number of days with FFF (Table 6).
Fig. 4. Frequency of the last spring frost (LSF) and first fall frost (FFF) occurrence in the particular circulation types at selected stations in Poland in the period of 1951–2015.
Fig. 5. Frequency of the last spring frost (LSF) and first fall frost (FFF) occurrence in the particular types of air masses at selected stations in Poland in the period of 1951–2015.
Table 5. Tendency of the number of days with circulation types and number of days with the last (LSF) and first (FFF) frost day during particular types of circulation at 5 stations in Poland in the period of 1951–2015
Period
Circulation type (see Table 1)
Tendency [days/10 years]
Number of days with particular circulation type
Number of days with frost during
particular circulation types
Na –0.11 –0.02
Apr.–May
NEa 0.24 0.03
Ea –0.21 –0.08
SEa 0.46 0.16
Sa –0.70 0.02
SWa 0.56 0.00
Wa –0.01 –0.01
NWa 0.03 –0.13
Ca –0.49 –0.05
Ka 0.85 0.13
Na –0.05 –0.09
Sept.–Oct.
NEa 0.08 0.02
Ea –0.35 –0.06
SEa 0.24 0.02
Sa –0.45 0.04
SWa 0.26 0.07
Wa –0.03 –0.08
NWa 0.17 0.01
Ca –0.30 0.06
Ka 0.79 0.21
Table 6. Tendency of the number of days with types of air masses and number of days with the last (LSF) and first (FFF) frost day during particular types of air masses at 5 stations in Poland in the period of 1951–2015
Period
Air masses (see Table 2)
Tendency [days/10 years]
Number of days with particular type
of air masses
Number of days with frost during particular air mass
types
PPm –0.02 0.01
Apr– May
PPms –0.61 –0.01
PPk –0.06 0.16
PPmc 0.68 –0.03
PZ –0.57 –
rmp 0.89 0.02
PA 0.15 –0.08
Sep– Oct
PPm –0.93 –0.10
PPms –0.74 –0.10
PPk 0.60 0.36
PPmc 0.63 –0.02
PZ –0.36 –
rmp 0.64 –0.01
6. Discussion and conclusions
The results of the research indicate that, in the period in question, there was a clear trend towards earlier occurrence of LSF dates over most of the territory of Poland. For FFF dates, the changes were not pronounced and were statistically insignificant over a large proportion of the area. Nevertheless, shifts in the beginning and end dates of the FFS increased the length of the season at 95% of the stations included in the study, with 70% of them recording statistically significant changes.
The greatest changes in the beginning dates and length of the frost–free season took place in the southern and west–central parts of Poland and in Hel.
Similar correlations may be found in studies by Ustrnul et al. (2014), Tomczyk et al. (2015), and Wypych et al. (2017). However, in some regions of Europe, especially in the southern, south–eastern, and north–eastern parts of the continent, the changes may be opposite in nature (Chmielewski and Rötzer, 2000; Tomczyk et al., 2014). It should be stressed here, that the average length of the FFS remained similar to that identified for the years of 1951–2006 (Bielec–
Bakowska and Piotrowicz 2011), and it changed by no more than 1–2 days at the different stations.
To find the causes underlying the trends, the authors investigated the long–
term variability of the occurrence of air masses and types of circulation and their correlation with changes in the occurrence of LSFs and FFFs. As it was found by other authors (Ustrnul et al., 2014; Tomczyk et al., 2015), the results of the present analysis indicate that the frosts in question are most often associated with anticyclonic situations, especially in fall. LSFs were recorded exceptionally frequently during the presence of an anticyclonic wedge (Ka), whereas FFFs occurred most often in September and October during the Ka and Ca types. The frosts in question appeared most often during the advection of the following air masses: arctic, polar continental, and polar maritime transformed. Even though the frequency differed from station to station and from season to season, on average it ranged between 23–34% of all the cases across the stations (attaining the highest values in spring in Bielsko–Biała – 40% in a PA mass, and in autumn in Rzeszów – 42% in a PPk air mass).
The positive and mostly statistically significant correlations between the types of circulation or the above types of air masses and the occurrence of LSFs and FFFs would indicate, that it is possible to use forecasts of changes in the types of synoptic situations to predict the overall trends in the occurrence of the frosts under study. However, the low number of frost cases in the individual types of synoptic situations and a comparison of their long–term variability with changes in the types of circulation and air masses do not clearly indicate such relationship. It is also worth stressing that, even though the entire period saw an overall increase in the frequency of the types of circulation accompanied by a large percentage of frosts (Ka, SEa, SWa and NEa), Poland has seen a clear drop in pressure values and also a drop in the number of strong anticyclones (Bielec–
Bąkowska, 2016) since the 1990s, which may partly explain the longer FFSs.
Most probably, however, the main cause of the changes is the increase in air temperatures, which is particularly noticeable in spring (Kożuchowski and Żmudzka, 2000). Hence, it seems that a more accurate explanation of the changes discussed in the paper requires the investigation of the temporal frequency, thermal characteristics, and air masses of the individual types of circulation.
The regularities obtained will certainly change the phenology of plants, which will consequently cause changes in agricultural production (Wypych et al., 2017). The growing length of the frost–free season, which is influenced most strongly by its increasingly earlier beginning date (LSF), may contribute to an increase in the crop production and a fall in the occurrence of late, May frosts, which very frequently causes damages to fruit plants and trees in bloom.
Nevertheless, the risk of such a frost remains high, particularly in eastern Poland.
References
Alexander, L.V., Zhang, X., Peterson, T.C., Caesar, J., Gleason, B., Klein Tank, A.M.G., Haylock, M., Collins, D., Trewin, B., Rahimzadeh, F., Tagipour, A., Rupa Kumar, K., Revadekar, J., Griffiths, G., Vincent, L., Stephenson, D.B., Burn, J., Aguilar, E., Brunet, M., Taylor, M., New, M., Zhai, P., Rusticucci, M., and Vazquez–Aguirre, J.L., 2006: Global observed changes in daily climate extremes of temperature and precipitation. J. Geophys. Res. 111, D05109.
https://doi.org/10.1029/2005JD006290
Alexandersson, H. 1986: A homogeneity test applied to precipitation data. J. Climate 6, 661–675.
https://doi.org/10.1002/joc.3370060607
Bielec–Bąkowska, Z. 2016: Long–term variability of the frequency and persistence of strong highs over Poland. Environ Socio–econ Stud 4(1), 12–23, DOI: 10.1515/environ–2016–0002.
https://doi.org/10.1515/environ-2016-0002
Bielec–Bąkowska, Z. and Piotrowicz K. 2011: Wieloletnia zmienność okresu bezprzymrozkowego w Polsce w latach 1951–2006. Prace i Studia Geograficzne 47, 77–86. (In Polish)
Brázdil, R., Budíková, M., Auer, I., Böhm, R., Cegnar, T., Faško, P., Lapin, M., Gajić–Čapka, M., Zaninović, K., Koleva, E., Niedźwiedź, T., Ustrnul, Z., Szalai, S., and Weber, R.O. (1996) Trends of maximum and minimum daily temperatures in Central and Southeastern Europe. Int J Climatol 16, 765–782.
https://doi.org/10.1002/(SICI)1097-0088(199607)16:7<765::AID-JOC46>3.0.CO;2-O
Chmielewski, F.M. and Rötzer, T. 2000: Phenological trends in Europe in relation to climatic changes.
Agrarmeteorologische Schriften 7, 1–15.
Czarnecka, M., Koźmiński, C., and Michalska, B. 2009: Climatic risk for plant cultivation in Poland.
Acta Agrophysica 169, 78–96.
Graczyk, D. and Kundzewicz, Z.W. 2016: Changes of temperature–related agroclimatic indices in Poland. Theor Appl Climatol 124, 401–410.
https://doi.org/10.1007/s00704-015-1429-7
Juszczak, R., Leśny, J., Serba, T., and Olejnik, J. 2009: Cumulative degree–days as an indicator of agroclimatic condition changes in the Wielkopolska Region. Implications for codling moth development. Acta Agrophysica 169, 122–136.
Kendall, M.G. 1975: Rank correlation methods. 4th edn Charles Griffin, London.
Klein Tank, A.M.G. and Können, G.P. 2003: Trends in indices of daily temperature and precipitation extremes in Europe, 1946–1999. J. Climate 16, 3665–3680.
https://doi.org/10.1175/1520-0442(2003)016<3665:TIIODT>2.0.CO;2
Kożuchowski, K. and Żmudzka, E. 2000: Vegetation and climate in Poland in the 1990’s: Variation of the normalized difference vegetation index, air temperature, sunshine and precipitation. Prace Geograficzne 107, 235–242.
Kunkel, K.E., Easterling, D.R., Hubbard, K., and Redmond, K. 2004: Temporal variations in frost–free season in the United States. Geophys. Res. Lett. 31, 1895–2000.
https://doi.org/10.1029/2003GL018624
Mann, H.B. 1945: Non–parametric tests against trend. Econometrica 13, 245–259.
https://doi.org/10.2307/1907187
Menzel, A. 2000: Trends in phenological phases in Europe between 1951 and 1996. Int J Biometeorol.
44, 76–81.https://doi.org/10.1007/s004840000054
Moberg, A., Jones, P.D., Lister, D., Walther, A., Brunet, M., Jacobeit, J., Alexander, L.V., Della–
Marta, P.M., Luterbacher, J., Yiou, P., Chen, D., Klein Tank, A.M.G., Saladiée, O., Sigró, J., Aguilar, E., Alexandersson, H., Almarza, C., Auer, I., Barriendos, M., Begert, M., Bergström, H., Böhm, R., Butler, C.J., Caesar, J., Drebs, A., Founda, D., Gerstengarbe, F.–W., Micela, G., Maugeri, M., Österle, H., Pandzic, K., Petrakis, M., Srnec, L., Tolasz, R., Tuomenvirta, H., Werner, P.C., Linderholm, H., Philipp, A., Wanner, H., and Xoplaki, E. 2006: Indices for daily temperature and precipitation extremes in Europe analyzed for the period 1901–2000.
J. Geophys Res 111, D22106. https://doi.org/10.1029/2006JD007103
Modala, N.R., Ale, S., Goldberg, D.W., Olivares, M., Munster, C.L., Rajan, N., Feagin, R.A. 2017:
Climate change projections for the Texas High Plains and Rolling Plains. Theor. Appl. Climatol.
129, 263–280. https://doi.org/10.1007/s00704-016-1773-2
Niedźwiedź, T., 2016a: Calendar of Circulation Types for territory of Southern Poland, Uniwersytet Śląski, Katedra Klimatologii, Sosnowiec. http://klimat.wnoz.us.edu.pl/#!/glowna (accessed 01.09.2016).
Niedźwiedź, T,. 2016b: Calendar of Circulation Types for Poland. Uniwersytet Śląski, Katedra Klimatologii, Sosnowiec.
Scheifinger, H., Menzel, A., Koch, E., Peter, Ch., and Ahas, R. 2002: Atmospheric mechanisms governing the spatial and temporal variability of phenological phases in Central Europe. Int. J.
Climatol. 22, 1739–1755. https://doi.org/10.1002/joc.817
Tomczyk, A.R., Szyga–Pluta, K., and Majkowska, A. 2015: Frost periods and frost–free periods in Poland and neighbouring countries. Open Geosci 7, 812–823.
https://doi.org/10.1515/geo-2015-0061
Ustrnul, Z., Wypych, A., Winkler, J.A., and Czekierda, D. 2014: Late spring freezes in Poland in relation to atmospheric circulation. Quaestiones Geographicae 33, 165–172.
https://doi.org/10.2478/quageo-2014-0039
Wibig, J. and Głowicki, B. 2002: Trends of minimum and maximum temperature in Poland. Clim. Res.
20, 123–133. https://doi.org/10.3354/cr020123
Wypych, A., Sulikowska, A., Ustrnul, Z., and Czekierda, D. 2017: Variability of growing degree days in Poland in response to ongoing climate changes in Europe. Int. J. Biometeorol. , 61 49–59.
https://doi.org/10.1007/s00484-016-1190-3
Yan, Z., Jones, P.D., Davies, T.D., Moberg, A., Bergström, H., Camuffo, D., Cocheo, C., Maugeri, M., Demarée, G.R., Verhoeve, T., Thoen, E., Barriendos, M., Rodríguez, R., Martín–Vide, J. and, Yang, C. 2002: Trends of extreme temperatures in Europe and China based on daily observations. Clim. Change 53, 355–392. https://doi.org/10.1023/A:1014939413284
Yu, L., Zhong, S., Bian, X., Heilman, W.E., and Andresen, J.A. 2014: Temporal and spatial variability of frost–free seasons in the Great Lakes region of the United States. Int. J. Climatol. 34, 3499–
3514. https://doi.org/10.1002/joc.3923
Zhang, D., Xu, W., Li, J., Cai, Z., and An, D. 2014: Frost–free season lengthening and its potential cause in the Tibetan Plateau from 1960 to 2010. Theor. Appl. Climatol. 115, 441–450.
https://doi.org/10.1007/s00704-013-0898-9
Żmudzka, E. 2003: The circulation–related conditioning for the variability of the spring date of air temperature passage through the +5°C threshold in Poland. Acta Universitatis Wratislaviensis, Studia Geograficzne 75, 250–261.