INTRODUCTION
Asthma is a complex pulmonary disease with genetic and en- vironmental components. It is characterized by variable and re- versible inflammation and narrowing of the small airways of the lung, increased bronchial responsiveness to a variety of trigger- ing factors, and symptoms of wheezing, cough, and shortness of breath.1,2 It is now estimated that as many as 300 million people of all ages and all ethnic backgrounds suffer from asthma, and the prevalence of the disease is on the rise.3 In spite of our im- proving knowledge of asthma, fundamental causes of this dis- ease are still not known. Up until now, more than 200 asthma candidate genes have been examined or found to be implicated in its pathomechanism.4-7 Gene expression studies in animal models have revealed numerous genes that are differentially ex- pressed in lung tissues of animals with ovalbumin-induced asthma compared to that of control animals.8-11 These studies in-
Novel genes in Human Asthma Based on a Mouse Model of Allergic Airway Inflammation and Human Investigations
Gergely Temesi,
1Viktor Virág,
1Éva Hadadi,
1,3Ildikó Ungvári,
1Lili E Fodor,
1András Bikov,
2Adrienne Nagy,
4Gabriella Gálffy,
2Lilla Tamási,
2Ildikó Horváth,
2,5András Kiss,
4Gábor Hullám,
6András Gézsi,
1Péter Sárközy,
6Péter Antal,
6Edit Buzás,
1Csaba Szalai
1,4,7*
1Department of Genetics, Cell- and Immunobiology and 2Department of Pulmonology, Semmelweis University, Budapest, Hungary
3Department of Cardiovascular Science, University of Sheffield, Sheffield, UK
4Heim, Pal Children Hospital, Budapest, Hungary
5Ministry of National Resources, Budapest, Hungary
6Department of Measurement and Information Systems, University of Technology and Economics, Budapest, Hungary
7Csertex Research Laboratory, Budapest, Hungary
dicate that several additional, still unidentified genes might play an important role in the disease and might be potential thera- peutic targets.
The aim of the current study was to identify novel asthma-as- sociated genes by designing a candidate gene association study based on the results of our previously completed whole genome gene expression microarray analysis using the ovalbumin-in- duced mouse model of asthma (GSE11911 record number in GEO database).10 First, we conducted single nucleotide poly- Purpose: Based on a previous gene expression study in a mouse model of asthma, we selected 60 candidate genes and investigated their possible roles in human asthma. Methods: In these candidate genes, 90 SNPs were genotyped using MassARRAY technology from 311 asthmatic children and 360 healthy controls of the Hungarian (Caucasian) population. Moreover, gene expression levels were measured by RT PCR in the induced spu- tum of 13 asthmatics and 10 control individuals. t-tests, chi-square tests, and logistic regression were carried out in order to assess associations of SNP frequency and expression level with asthma. Permutation tests were performed to account for multiple hypothesis testing. Results: The fre- quency of 4 SNPs in 2 genes differed significantly between asthmatic and control subjects: SNPs rs2240572, rs2240571, rs3735222 in gene SCIN, and rs32588 in gene PPARGC1B. Carriers of the minor alleles had reduced risk of asthma with an odds ratio of 0.64 (0.51-0.80; P=7×10⁻⁵) in SCIN and 0.56 (0.42-0.76; P=1.2×10⁻⁴) in PPARGC1B. The expression levels of SCIN, PPARGC1B and ITLN1 genes were significantly lower in the sputum of asthmatics. Conclusions: Three potentially novel asthma-associated genes were identified based on mouse experiments and human studies.
Key Words: Asthma; child; genetic association studies, gene expression; sputum; disease model; animal
This is an Open Access article distributed under the terms of the Creative Commons Attribution Non-Commercial License (http://creativecommons.org/licenses/by-nc/3.0/) which permits unrestricted non-commercial use, distribution, and reproduction in any medium, provided the original work is properly cited.
Correspondence to: Csaba Szalai, PhD, DSc, Department of Genetics, Cell- and Immunobiology, Semmelweis University, Budapest, Hungary, H-1089 Nagyvárad Sq. 4.
Tel: +36-1-210-2930/56236; Fax: +36-1-303-6968; E-mail: szalaics@gmail.com Received: December 12, 2013; Revised: March 10, 2014; Accepted: April 14, 2014
•Gergely Temesi and Viktor Virág contributed equally on this paper.
•There are no financial or other issues that might lead to conflict of interest.
Allergy Asthma Immunol Res. 2014 November;6(6):496-503.
http://dx.doi.org/10.4168/aair.2014.6.6.496 pISSN 2092-7355 • eISSN 2092-7363
morphism (SNP) association analyses to reveal potential rela- tionships between genetic variations in these genes and asth- ma. Next, we examined if the expression of the genes carrying significantly associated SNPs is detectable in human induced sputum samples and compared those expression levels be- tween healthy controls and asthmatic patients. This approach yielded 3 novel asthma-associated genes.
MATERIALS AND METHODS Subjects for genotyping
The study population involved in genotype analysis comprised of 671 unrelated individuals (311 asthmatic children and 360 healthy controls) of the Hungarian (Caucasian) population.
Asthma was diagnosed by respiratory medicine specialists ac- cording to the recent Global Initiative for Asthma guidelines (http://www.ginasthma.org/). Asthmatic patients were recruit- ed from the Allergic Outpatient Consultation of the Budai and Heim Pál Children’s Hospitals, Budapest. Atopy was determined by skin prick tests (Lofarma SpA, Milan, Italy) and specific IgE blood tests (RAST test, Roche kit, Roche Diagnostics, Mannheim, Germany) to environmental aeroallergens and food allergens.
Atopy was defined by positive skin prick test to at least 1 allergen (wheal diameter 3 mm greater than saline control) and/or posi- tive total or specific IgE levels. Total and specific serum IgE lev- els to more than 100 allergens were determined by 3gAllergyTM blood tests in Immulite 2,000 Immunoassay System (Siemens Healthcare Diagnostics; Deerfield, IL, USA). Serum IgE levels were classified as normal or high according to the following age- specific reference ranges (kU/L): 0-1 year, <15; 1-5 years, <60;
5-10 years, <90; and adult, <100.
The control children were randomly selected from the Ortho- pedic Department in the Budai Children’s Hospital or from the Urological Department of Heim Pal Hospital, Budapest. Chil- dren in the control group had mild musculoskeletal alterations (like pes planus or scoliosis), phimosis, or other minor urogeni- tal problems, showed no symptoms of asthma and required no medication. Older subjects were also included as controls. They were adult blood donors without asthma, and according to questionnaires they had not experienced asthma symptoms earlier (Table 1). Statistical adjustments and verifications were carried out to account for potential population stratification is- sues resulting from the slight mean age difference between cas-
es and controls.
Subjects for the sputum expression
Thirty-four adults were enrolled in the study to measure their gene expression levels of the selected genes in induced spu- tum, but 11 of them were excluded from the analysis because of the quality of the sputum samples (the study population was comprised of 13 asthmatic patients and 10 controls). Their de- tailed characteristics were previously described by Ungvári et al.12 The asthmatic patients had mild to moderate stable asth- ma, with neither other lung diseases nor lower respiratory tract infection. Patients were required to have FEV1 of greater than 70% of predicted, baseline methacholine PC20 (the provocative concentration of methacholine causing a 20% fall in FEV1) of less than 16 mg/mL. Healthy volunteers were recruited from the staff and students of the participating Hungarian universi- ties. They gave no history of respiratory diseases, and had a FEV1/FVC>80% and normal methacholine airway responsive- ness (PC20>16 mg/mL). The included groups did not differ statistically in age, sex, smoking status, and allergy.
The study was conducted according to the principles ex- pressed in the Declaration of Helsinki and approved by the Eth- ics Committee of the Hungarian Medical Research Council (ETT TUKEB) (Ethics Committee of the Hungarian Medical Research Council [http://www.ett.hu/tukeb/tukeb.htm]). Written in- formed consents were obtained from all patients, or the parents or guardians of the minors involved in the study.
Candidate gene and SNP selection, and genotyping
The current study is based on our former gene expression mi- croarray analysis of the ovalbumin-induced mouse model of asthma. The former experiment used female 6-8 weeks old, fe- male, pathogen-free, BALB/c mice kept on an ovalbumin-free diet. Groups of mice were sensitized (on days 0 and 14) and challenged with ovalbumin (on days 28, 29, and 30), and 1 group was sensitized and challenged with placebos. On day 31, 24 hours after the third (last) allergen challenge, mice were anes- thetized, bronchoalveolar lavage fluid was isolated, and the lungs were removed for further analysis. RNA was isolated from the lung tissues and gene expression patterns were measured with Agilent Whole Mouse Genome Oligo Microarray 4×44 K chips (record number GSE11911 in the GEO database). Micro- array data was analyzed with unpaired t-test and one-way anal- ysis of variance (ANOVA). Over thousand transcripts showed>
2.0-fold statistically significant differential expression in the 3 groups relative to the control group. See Tölgyesi et al.10 for fur- ther details.
The gene expression results of the mouse model were used to identify genes whose orthologues may be candidates for human asthma or atopy. A gene was selected for further consideration if its expression level in the lung changed significantly during the asthmatic process (corrected P value under 0.02, see the paper Table 1. Genotype analysis study population characteristics
Clinical and biological
characteristic asthma subjects
(n=311) control subjects (n=360)
Age (years)±SD 10.58±4.79 21.71±13.89 *
Gender (male=1/female=0) 203/108 181/179
Atopic asthma 195 (62.7%) -
* indicates significant P values (≤0.05) between cases and controls.
of Tölgyesi et al.10). The candidate list was ranked based on the strength of the regulation change, the potential role in asthma, earlier findings in the scientific literature, and their scientific novelty. The final list of the 60 selected genes is presented in Supplementary Material 1.
UCSC Table Browser was used to select SNPs.13 In the final SNP sorting, we preferred the promoter, missense, and UTR re- gion polymorphisms. To reach the best coverage of a studied gene or genomic region, linkage disequilibrium (LD) data was involved in the selection process (International HapMap Proj- ect,14 Haploview software15).
Genomic DNA was isolated from whole blood samples using iPrep PureLink gDNA Blood Kit, iPrep Purification Instrument (Invitrogen).
A total of 90 SNPs were genotyped using the Sequenom iPLEX Gold MassARRAY technology at McGill University and Gé- nome Québec Innovation Centre, Montréal, Canada.
Sputum induction, RNA isolation, and gene-expression measurement
Sputum induction was carried out as previously described by Ungvári et al.12,16 RNA was isolated with Qiagen Mini Rneasy Kit (Qiagen, MD USA) and transcribed to cDNA with High Capaci- ty cDNA Reverse Transcription Kit (Applied Biosystems, Foster City, CA, USA). Real-time quantitative PCR was performed for the selected genes using the ABI 7900HT Fast Real-Time PCR System (Applied Biosystems, Foster City, CA, USA). The relative mRNA levels in each sample were normalized to its β-actin content, which proved to be a stable control reference.
Statistical analysis and bioinformatics
Hardy-Weinberg equilibrium (HWE) was tested for the control population using the chi-square goodness-of-fit test (results in Supplementary Material 2) implemented in the online DeFinet- ti HWE application (Helmholtz Zentrum München, Institut für Humangenetik http://ihg.gsf.de/cgi-bin/hw/hwa1.pl). The sig- nificance level was set at 0.01. The same software was used to perform Pearson’s chi-squared tests of association to asthma and calculate odds ratios (using single marker allele, recessive and dominant models). Confidence intervals (CI) were calcu- lated at the 95 percent level. For each SNP, missing genotypes were imputed by sampling from the univariate distribution. The Haploview application15 was used to perform single marker and haplotype association tests. To account for multiple hypothesis testing, we performed permutation tests in Haploview with both single marker and haplotype associations with a minimum of 1,000 permutations. The single marker associations and the dominant-recessive models were also verified with IBM SPSS Statistics V20 (Pearson’s chi-squared test); to account for multi- ple hypothesis testing in this case, we applied the more stringent Bonferroni correction.
In all multivariate logistic regression analyses (IBM SPSS Sta-
tistics V20), age was included as a covariate to apply sufficient statistical adjustment for the mean age difference between cas- es and controls (–11 years).
Additional statistical verifications were also carried out (IBM SPSS Statistics V20) to avoid false positive associations resulting from population stratification. We used binary logistic regres- sion models with and without age as a covariate and assessed how the polymorphisms’ P values and odds ratios differ. If the P values and odds ratios differed considerably, that would be a clear sign of a confounded relation between asthma and the polymorphism. However, the assessed P values and odds ratios were nearly identical in all of the models; the preventive or risk status of the predictor remained the same (the largest odds ratio differences were in the range of 20%-30%), thus no evidence for a population stratification was found.
For the analysis of the RT PCR measurements, we used the delta-delta-CT algorithm to normalize CT values for house- keeping genes and for the control samples. Samples with RNA Integrity Number of poor quality or extreme CT values were ex- cluded from the study. We used Student’s t-test on the normal- ized fold change values to assess statistical significance.
RESULTS
SNP association studies
The basic characteristics of the studied SNPs (containing gene, rs id, functional classification and alleles) are presented in Sup- plementary Material 1, whereas genotype frequencies in con- trols and cases, odds ratios, and results for statistical tests of HWE and of population association are available in Supplemen- tary Material 2. The total percentage of missing genotype data was 7.1%. Patients with over 80% missing genotype data were excluded (n=9, ~1%), and polymorphisms with over 20% miss- ing ratio were also excluded (rs2432561, rs3814896, rs1821142, rs17027410). Out of the remaining 86 polymorphisms 2 showed significant deviation from the HWE in the control population, thus they were also excluded (rs11016071, rs2857600).
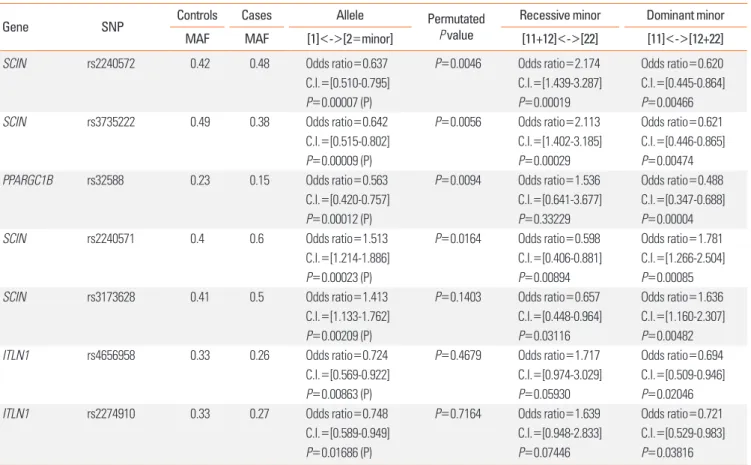
Between asthma cases and controls, the genotype distribu- tions of 4 SNPs of 2 genes differed significantly in all of the ap- plied statistical tests: SCIN (rs2240572, rs2240571, rs3735222) and PPARGC1B (rs32588). The polymorphisms of 6 other genes (ITLN1, FABP3, MAT1A, OSGIN, LY9, LGMN) showed statisti- cally borderline differences (they were significant with most of the statistical tests but failed multiple testing correction with permutation testing: 0.05<P value <0.5). However, based on its statistical significance in the genotyping study, our results in mice, and its possible role in the asthmatic process, we includ- ed one of these genes in our further investigations: ITLN1 (rs4656958). We examined if the P values of the dominant and recessive models show a difference compared to the single marker allele associations tests, but none of the uncorrected P value differences were notable, thus these models were not ex-
amined further (Table 2). The single marker results and the dominant-recessive model ones were also verified by IBM SPSS Statistics V20 with Pearson’s chi-squared test combined with Bonferroni correction (the corrected significance threshold for 90 polymorphisms was 0,00055). The results are in a complete agreement with our earlier findings, in which the same poly-
morphisms proved to be significantly associated with asthma.
To see if the polymorphisms have greater combined effects compared to what was seen in single SNP analyses, we tested for their association to asthma at the level of haplotype blocks.
This analysis confirmed the present single SNP findings, but the haplotype-level P values did not differ significantly from the corresponding single marker results: the association of the SCIN haplotypes was very significant, and the weak association of ITLN1 was stronger compared to the single marker results, but the latter was still not significant after correction for multi- Table 2. Summary of the genes and polymorphisms showing significant association with asthma
Gene SNP Controls Cases Allele Permutated
P value
Recessive minor Dominant minor MAF MAF [1]<->[2=minor] [11+12]<->[22] [11]<->[12+22]
SCIN rs2240572 0.42 0.48 Odds ratio=0.637 P=0.0046 Odds ratio=2.174 Odds ratio=0.620
C.I.=[0.510-0.795] C.I.=[1.439-3.287] C.I.=[0.445-0.864]
P=0.00007 (P) P=0.00019 P=0.00466
SCIN rs3735222 0.49 0.38 Odds ratio=0.642 P=0.0056 Odds ratio=2.113 Odds ratio=0.621
C.I.=[0.515-0.802] C.I.=[1.402-3.185] C.I.=[0.446-0.865]
P=0.00009 (P) P=0.00029 P=0.00474
PPARGC1B rs32588 0.23 0.15 Odds ratio=0.563 P=0.0094 Odds ratio=1.536 Odds ratio=0.488
C.I.=[0.420-0.757] C.I.=[0.641-3.677] C.I.=[0.347-0.688]
P=0.00012 (P) P=0.33229 P=0.00004
SCIN rs2240571 0.4 0.6 Odds ratio=1.513 P=0.0164 Odds ratio=0.598 Odds ratio=1.781
C.I.=[1.214-1.886] C.I.=[0.406-0.881] C.I.=[1.266-2.504]
P=0.00023 (P) P=0.00894 P=0.00085
SCIN rs3173628 0.41 0.5 Odds ratio=1.413 P=0.1403 Odds ratio=0.657 Odds ratio=1.636
C.I.=[1.133-1.762] C.I.=[0.448-0.964] C.I.=[1.160-2.307]
P=0.00209 (P) P=0.03116 P=0.00482
ITLN1 rs4656958 0.33 0.26 Odds ratio=0.724 P=0.4679 Odds ratio=1.717 Odds ratio=0.694
C.I.=[0.569-0.922] C.I.=[0.974-3.029] C.I.=[0.509-0.946]
P=0.00863 (P) P=0.05930 P=0.02046
ITLN1 rs2274910 0.33 0.27 Odds ratio=0.748 P=0.7164 Odds ratio=1.639 Odds ratio=0.721
C.I.=[0.589-0.949] C.I.=[0.948-2.833] C.I.=[0.529-0.983]
P=0.01686 (P) P=0.07446 P=0.03816
Column header notations of the DeFinetti HWE application of the Helmholtz Zentrum München, Institut für Humangenetik: [1] major allele, [2] minor allele, [11] ho- mozygous major allele genotype, [22] homozygous minor allele genotype, [12] heterozygous genotype; [11+12] heterozygous genotype and homozygous major allele genotype combined [12+22] heterozygous genotype and homozygous minor allele genotype combined; significance was calculated with chi-squared test (<->).
Table 3. Comparison of the distributions of haplotype blocks based on the cor- responding SNPs in column 2 in cases vs controls
Gene SNPs Haplotype
block P value Permutated P value
SCIN rs3735222,
rs2240571, rs2240572, rs3173627
GCAA 0.0002 0.003
SCIN rs3735222,
rs2240571, rs2240572, rs3173628
AGGG 0.0004 0.01
ITLN1 rs2274910,
rs4656957 TA 0.008 0.2
ITLN1 rs2274910,
rs4656958 CG 0.0084 0.206
Table 4. Linkage disequilibrium statistics in the examined haplotype blocks
Gene SNP1 SNP2 D' r2
SCIN rs3735222 rs2240571 0.99 0.61
SCIN rs3735222 rs2240572 0.99 0.99
SCIN rs3735222 rs3173628 0.94 0.56
SCIN rs2240571 rs2240572 0.99 0.61
SCIN rs2240571 rs3173628 0.96 0.91
SCIN rs2240572 rs3173628 0.64 0.58
ITLN1 rs2274910 rs4656958 0.99 0.93
ple hypothesis testing (Table 3). We calculated LD coefficients between the different SNPs (Table 4) and found that, in both genes, the significantly associated SNPs were in strong linkage with each other. This suggests that, in each gene, there is only 1 causal variant, which mediates the association of all nearby SNPs to asthma. In PPARGC1B, only 1 polymorphism was stud- ied; therefore, no haplotype was investigated.
We analyzed the multivariate relevance of the polymorphisms investigated with logistic regression using age and gender as co- variates. All the 3 previously selected SNPs (SCIN: rs2240572, PPARGC1B: rs32588, ITLN1: rs4656958) remained significantly related to asthma with protective effects. Similar to our previous results, a strong haplotype level association was not observed (1 SNP from each gene got into the model) (Supplementary Mate- rial 3).
We also examined the effects of these polymorphisms within each gender group using logistic regression. The effect of SCIN:
rs2240572 (P=0.002, OR=0.41) and PPARGC1B: rs32588 (P=0.013, OR=0.48) was highly significant in women, but that of ITLN1: rs4656958 was not significant in this group. In men, ITLN1: rs4656958 (P=0.005, OR=0.59) was highly significant, but not the other 2 polymorphisms. Logistic regression also re- vealed that ITLN1: rs4656958 had a significant (P=0.007, OR=0.665) protective effect in the severe atopic asthmatic sub- group (Supplementary Material 3).
Taken together, these results indicate association to asthma of 3 genes in our study: SCIN, PPARGC1B, and ITLN1.
Gene expression in induced sputum
Next, we investigated whether gene expression levels in in- duced sputum samples corroborate the association of SCIN, PPARGC1B, and ITLN1. Indeed, the expression level of all 3 genes was significantly lower in the sputum sample of asthmat- ics than of controls.
We compared our results to the third measurement (24 hours after the third/last allergen challenge) of the original asthmatic
mouse model study.10 The results were somewhat unexpected:
the expression of all 3 genes changed in the opposite direction, i.e., the expression levels were significantly higher in the lung of mice with ovalbumin-induced airway inflammation (Figure).
Fusion of the results
We can apply Fisher’s method to combine the P values of the statistically independent studies, such as the genotyping study and the gene expression studies in our case. This method quan- titatively combines the strength of the evidence from both ex- periments in order to rank the results (Table 5). According to these, the SCIN gene had the lowest combined P value, indicat- ing the strongest evidence for true association. The PPARGC1B also had a relatively low combined P value. It must be noted, however, that an insignificant combined P value does not mean the absence of association in this respect.
DISCUSSION
In the present study, we selected 60 genes from our previous experiments on a mouse model of asthma based on significant- ly different gene expressions in the lungs of mice, and accord- ing to different considerations mentioned previously in the text.
We carried out a genetic association study on our human bio- bank and detected several differences in genotype distributions between asthmatics and controls. Among these, the distribu- tion of 4 SNPs in 2 genes (SCIN and PPARGC1B) proved to be statistically different with all of the applied statistical tests. SNPs in 6 other genes also showed nominally significant differences.
We compared the expression levels of 3 genes in induced spu- tum samples from asthmatics and controls. The expression lev- els of SCIN, PPARGC1B, and ITLN1 were significantly lower in the sputum of asthmatics. These latter results are unexpected, since in our previous mouse model experiments, all the differ- ences in the gene expression levels were in the opposite direc- tions. The original mouse study had 3 temporal measurement points and the expression levels for all three of the investigated genes were trend-like and did not oscillate; thus short-term temporal effects probably do not account for the result. An im- portant question is how these seemingly contradictory results can be reconciled?
We compared publicly available data at the NCBI GEO from asthmatic microarray studies to our results and calculated the expression fold change statistics. Tsitsiou et al.17 examined cir- Table 5. Combined P values of the genotyping and expression tests
Gene Genotyping
permuted P value Sputum gene
expression P value Combined P value
SCIN 0.0046 0.0011 0.000067
PPARGC1B 0.0094 0.0537 0.004341
ITLN1 0.4679 0.0350 0.067466
Sputum log2 Fold Change Mouse log2 Fold Change 5
4 3 2 1 0 -1
-2 SCIN PPARGC1B ITLN1
Figure. Gene expression level changes between cases and controls in human induced sputum samples and ovalbumin-induced mouse model: all the 3 inves- tigated genes (SCIN, PPARGC1B, ITLN1) had significant expression level change, but their expressions were higher in the mouse model (marked with darker columns) and lower in human asthmatics (marked with brighter columns) than in the controls. For statistical significance of the sputum samples, please refer to Table 5.
culating T cells, and their microarray measurements (GSE31773) covered SCIN, PPARGC1B, but not ITLN1. Their results are in line with our findings in human induced sputum in case of SCIN, but they did not have significant results for PPARGC1B. Another public asthmatic microarray study available at NCBI GEO GSE473 examined also T cells isolated form peripheral blood.
This study also has measurements for SCIN and PPARGC1B, but not for ITLN1. They studied severe and mild asthmatic patients with or without atopy. The study confirmed our results for PPARGC1B and also had a statistically borderline confirming re- sult for SCIN.
Both studies strengthen our results showing unexpected di- rection of the expression change for the investigated genes, and it is also worth mentioning that even the statistically insignifi- cant results were in line with our findings in humans. We re- viewed the literature for other examples of ‘discordant’ human- mouse expression pairs, and the phenomenon is well known.
Tsaparas et al. systematically reviewed gene co-expression net- works in human and mouse orthologs, and besides conserved global topological properties they found substantial diver- gence.18 Kuhn et al. reviewed human-mouse orthologous gene expression and found that the ratio of concordant-discordant expressions of their significant results were 5:1.19 Several sepa- rate studies also studied the phenomenon and reported similar findings.20-25
There are several possible explanations for this phenomenon in our study. First, in the mouse model we measured the gene expression levels in whole lungs, while in humans in induced sputum. Although both of them are influenced by airway in- flammation, their cell compositions differ considerably, thus the measured average gene expression levels can also be signif- icantly different. Furthermore, it is known that mouse allergen- induced airway inflammation is an acute process. In these ex- periments the dynamic gene expression changes during this process are measured. In contrast, the human asthma is a chronic disease; the individuals participating in the present study had stable, chronic asthma but no acute symptoms dur- ing the protocol. It can be hypothesized that genes that over- or underexpressed during acute inflammatory processes are over- compensated in the chronic phase. Naturally, it is also possible that different mechanisms are involved in the 2 species, al- though this would not easily explain the opposite direction in 3 genes. Nevertheless, differential expression of a gene in a pro- cess provides clear evidence for involvement in that process.
However, it must also be added that our induced sputum bio- bank is relatively small for drawing definitive conclusions, and the asthma patients represent a relatively heterogenous popu- lation. In addition, due to the limited number of available study subjects we could not create subpopulations in this study.
Our study is the first to investigate the association of SCIN with asthma in the human population. The minor alleles of SCIN SNPs rs2240572 (H61R) on exon 1 and rs3735222 on pro-
moter region had protective effects against asthma, and these associations proved to be more prominent when studying the female cohort separately. Additionally, we found reduced SCIN mRNA level in the sputum samples of asthma patients com- pared to those of healthy controls.
Functionally, the protein scinderin (also known as adseverin, encoded by the SCIN gene) is an actin filament–severing and – capping enzyme which is able to rearrange the apical actin cap in airway goblet cells.26,27 Although the SCIN overexpression fol- lowed by allergen challenge is well known from the literature of murine asthma models,10,11 up to the present, there are no hu- man studies reported in which altered expression of scinderin was observed in the airways of asthma patients compared to controls. Among the associated SNPs in the gene, rs2240571 is located approximately 400 bp upstream from the SCIN gene on chromosome 7 and has previously been found associated with sclerosis multiplex.28 Until now, there have been no functional studies investigating the effect of SCIN polymorphisms on gene regulation or function, Future research is needed on this topic.
Peroxisome proliferator-activated receptor gamma coactiva- tor 1-beta (PPARGC1B) is a nuclear hormone receptor which is involved in cell activation, differentiation, proliferation, and apoptosis. Upregulation of PPARgamma expression has been observed in asthmatic airways, and a growing body of evidence suggests that PPARgamma contributes to airway inflammation and airway hyperresponsiveness in asthma.29 Furthermore, studies carried out with PPARgamma agonists pose the possi- bility to consider PPARgamma as a novel therapeutic target in asthma.30 The activity of PPAR is enhanced by the interaction with the PPARGC1B; therefore, genetic variations in the PPAR- GC1B gene may contribute to the functional changes in this transcription factor, which may lead to airway inflammation and remodeling in asthma.
Recently, Lee et al.31 have reported a study which found no ge- netic associations between SNPs in the PPARGC1B gene with the risk of asthma. However, by gene and protein expression measurements they showed that the -427C>T polymorphism on the promoter and+102525G>A (R265Q, rs45520937) on exon 5 of the PPARGC1B gene may affect the development of airway hyperresponsiveness through the modulation of PPARGC1B gene products. Our study is the first to report that the minor allele of rs32588 (L42L) on exon 2 is associated with asthma and has a protective effect, but the exact mechanism by which this coding SNP exerts its effect is still unclear. Besides, considering that this polymorphism is in LD with many other SNPs, we cannot exclude the possibility that other functional polymorphisms are responsible for the observed strong associ- ation.
Intelectin-1 (ITLN1) may recognize carbohydrate chains of pathogens and bacterial components and thus play a role in the defense system against microorganisms. It has an anti-inflam- matory role by preventing the TNF-α-induced COX-2 expres-
sion. As both microbial infection and TNF-α can have an impor- tant role in asthma,32-35 the ITLN1 gene might have a role in the asthmatic process. Although genetic variations in the gene showed associations only in certain tests, the expression levels of the gene differed both in animal lung and human samples.
Theoretically, a possible bias can originate from the slight, but statistically significant age difference between cases and con- trols. Nevertheless on one hand all of our multivariate analyses were carried out with age as a covariate to apply sufficient statis- tical adjustment for the mean age difference; on the other hand, both the cases and controls had the same ethnicity and were re- cruited from the same location, so it is very unlikely that the dis- tributions of the investigated polymorphisms would be influ- enced by the 11-year age difference which was also confirmed by our analysis.
In summary, based on a gene expression study in a mouse model of asthma we selected 60 candidate genes and investi- gated their involvement in human asthma. We detected poly- morphisms in 2 genes (SCIN and PPARGC1B) which signifi- cantly influenced the risk of asthma. The expression level of 3 genes (SCIN, PPARGC1B, and ITLN1) was significantly lower in induced sputum samples of the asthmatics. According to these results, these genes may play a role in human asthma. Future research on the function of these genes may help identify new candidates for therapeutic targeting and promote our under- standing of the pathogenesis of asthma.
ACKNOWLEDGMENTS
This study was supported by OTKA (Hungarian Scientific Re- search Fund): K81941 (Szalai); and ETT (Ministry of Health, Hungary) 415/2009 (Szalai), OTKAPD (Hungarian Scientific Re- search Fund): 76348 (Antal), Bolyai Grant (Hungarian Academy of Science): (Antal) and NKTH (National Research and Technol- ogy) TECH_08-A1/2-2008-0120: (Szalai and Antal). This work is connected to the scientific program of the Development of quality oriented and harmonized R+D+I strategy and functional model at BME project. This project is supported by the New Széchenyi Plan (Project ID: TÁMOP-4.2.1/B-09/1/KMR-2010- 0002). Web pages for the funding organizations: OTKA: http://
www.otka.hu/, NKTH: www.nih.gov.hu, ETT: http://www.ett.
hu/palyazat.htm, Bolyai Grant: http://www.bolyaitestamen- tum.hu/?m=24. The sponsors had no role in study design, data collection and analysis, decision to publish, or preparation of the manuscript.
REFERENCES
1. Holgate ST. Pathogenesis of asthma. Clin Exp Allergy 2008;38:872- 97.
2. Lemanske RF Jr, Busse WW. Asthma: clinical expression and mo- lecular mechanisms. J Allergy Clin Immunol 2010;125:S95-102.
3. Braman SS. The global burden of asthma. Chest 2006;130:4S-12S.
4. Vercelli D. Discovering susceptibility genes for asthma and allergy.
Nat Rev Immunol 2008;8:169-82.
5. Bierbaum S, Heinzmann A. The genetics of bronchial asthma in children. Respir Med 2007;101:1369-75.
6. Finkelman FD, Vercelli D. Advances in asthma, allergy mechanisms, and genetics in 2006. J Allergy Clin Immunol 2007;120:544-50.
7. Weiss ST, Raby BA, Rogers A. Asthma genetics and genomics 2009.
Curr Opin Genet Dev 2009;19:279-82.
8. Zimmermann N, King NE, Laporte J, Yang M, Mishra A, Pope SM, Muntel EE, Witte DP, Pegg AA, Foster PS, Hamid Q, Rothenberg ME. Dissection of experimental asthma with DNA microarray analysis identifies arginase in asthma pathogenesis. J Clin Invest 2003;111:1863-74.
9. Karp CL, Grupe A, Schadt E, Ewart SL, Keane-Moore M, Cuomo PJ, Köhl J, Wahl L, Kuperman D, Germer S, Aud D, Peltz G, Wills-Karp M. Identification of complement factor 5 as a susceptibility locus for experimental allergic asthma. Nat Immunol 2000;1:221-6.
10. Tölgyesi G, Molnár V, Semsei AF, Kiszel P, Ungvári I, Pócza P, Wie- ner Z, Komlósi ZI, Kunos L, Gálffy G, Losonczy G, Seres I, Falus A, Szalai C. Gene expression profiling of experimental asthma reveals a possible role of paraoxonase-1 in the disease. Int Immunol 2009;
21:967-75.
11. Di Valentin E, Crahay C, Garbacki N, Hennuy B, Guéders M, Noël A, Foidart JM, Grooten J, Colige A, Piette J, Cataldo D. New asthma biomarkers: lessons from murine models of acute and chronic asthma. Am J Physiol Lung Cell Mol Physiol 2009;296:L185-97.
12. Ungvári I, Hadadi E, Virág V, Bikov A, Nagy A, Semsei AF, Gálffy G, Tamási L, Horváth I, Szalai C. Implication of BIRC5 in asthma pathogenesis. Int Immunol 2012;24:293-301.
13. Karolchik D, Hinrichs AS, Furey TS, Roskin KM, Sugnet CW, Haus- sler D, Kent WJ. The UCSC Table Browser data retrieval tool. Nucle- ic Acids Res 2004;32:D493-6.
14. International HapMap Project [Internet]. [place unknown]: Interna- tional HapMap Project; [cited 2013 May 31]. Available from: http://
hapmap.ncbi.nlm.nih.gov/cgi-perl/gbrowse/hapmap28_B36/.
15. Barrett JC, Fry B, Maller J, Daly MJ. Haploview: analysis and visual- ization of LD and haplotype maps. Bioinformatics 2005;21:263-5.
16. Ungvári I, Hullám G, Antal P, Kiszel PS, Gézsi A, Hadadi É, Virág V, Hajós G, Millinghoffer A, Nagy A, Kiss A, Semsei ÁF, Temesi G, Me- legh B, Kisfali P, Széll M, Bikov A, Gálffy G, Tamási L, Falus A, Szalai C. Evaluation of a partial genome screening of two asthma suscep- tibility regions using bayesian network based bayesian multilevel analysis of relevance. PLoS One 2012;7:e33573.
17. Tsitsiou E, Williams AE, Moschos SA, Patel K, Rossios C, Jiang X, Adams OD, Macedo P, Booton R, Gibeon D, Chung KF, Lindsay MA.
Transcriptome analysis shows activation of circulating CD8+ T cells in patients with severe asthma. J Allergy Clin Immunol 2012;129:95- 103.
18. Tsaparas P, Mariño-Ramírez L, Bodenreider O, Koonin EV, Jordan IK. Global similarity and local divergence in human and mouse gene co-expression networks. BMC Evol Biol 2006;6:70.
19. Kuhn A, Luthi-Carter R, Delorenzi M. Cross-species and cross-plat- form gene expression studies with the Bioconductor-compliant R package ‘annotationTools’. BMC Bioinformatics 2008;9:26.
20. Strand AD, Aragaki AK, Baquet ZC, Hodges A, Cunningham P, Hol- mans P, Jones KR, Jones L, Kooperberg C, Olson JM. Conservation of regional gene expression in mouse and human brain. PLoS Genet 2007;3:e59.
21. Song KH, Chiang JY. Glucagon and cAMP inhibit cholesterol 7al- pha-hydroxylase (CYP7A1) gene expression in human hepatocytes:
discordant regulation of bile acid synthesis and gluconeogenesis.
Hepatology 2006;43:117-25.
22. Jordan IK, Mariño-Ramírez L, Koonin EV. Evolutionary significance of gene expression divergence. Gene 2005;345:119-26.
23. Jordan IK, Mariño-Ramírez L, Wolf YI, Koonin EV. Conservation and coevolution in the scale-free human gene coexpression network.
Mol Biol Evol 2004;21:2058-70.
24. Su AI, Cooke MP, Ching KA, Hakak Y, Walker JR, Wiltshire T, Orth AP, Vega RG, Sapinoso LM, Moqrich A, Patapoutian A, Hampton GM, Schultz PG, Hogenesch JB. Large-scale analysis of the human and mouse transcriptomes. Proc Natl Acad Sci U S A 2002;99:4465- 70.
25. Yanai I, Graur D, Ophir R. Incongruent expression profiles between human and mouse orthologous genes suggest widespread neutral evolution of transcription control. OMICS 2004;8:15-24.
26. Ehre C, Rossi AH, Abdullah LH, De Pestel K, Hill S, Olsen JC, Davis CW. Barrier role of actin filaments in regulated mucin secretion from airway goblet cells. Am J Physiol Cell Physiol 2005;288:C46- 56.
27. Davis CW, Dickey BF. Regulated airway goblet cell mucin secre- tion. Annu Rev Physiol 2008;70:487-512.
28. Bush WS, McCauley JL, DeJager PL, Dudek SM, Hafler DA, Gibson RA, Matthews PM, Kappos L, Naegelin Y, Polman CH, Hauser SL, Oksenberg J, Haines JL, Ritchie MD; International Multiple Sclero- sis Genetics Consortium. A knowledge-driven interaction analysis
reveals potential neurodegenerative mechanism of multiple scle- rosis susceptibility. Genes Immun 2011;12:335-40.
29. Park SJ, Lee YC. Peroxisome proliferator-activated receptor gamma as a novel therapeutic target in asthma. J Asthma 2008;45:1-8.
30. Lee KS, Park SJ, Hwang PH, Yi HK, Song CH, Chai OH, Kim JS, Lee MK, Lee YC. PPAR-gamma modulates allergic inflammation thro- ugh up-regulation of PTEN. FASEB J 2005;19:1033-5.
31. Lee SH, Jang AS, Woo Park S, Park JS, Kim YK, Uh ST, Kim YH, Chung IY, Park BL, Shin HD, Park CS. Genetic effect of single-nu- cleotide polymorphisms in the PPARGC1B gene on airway hyper- reactivity in asthmatic patients. Clin Exp Allergy 2011;41:1533-44.
32. Tölgyesi G, Keszei M, Ungvári I, Nagy A, Falus A, Szalai C. Involve- ment of TNFalpha -308A promoter polymorphism in the develop- ment of asthma in children infected with Chlamydophila pneu- moniae. Pediatr Res 2006;60:543-8.
33. Ungvári I, Tölgyesi G, Semsei AF, Nagy A, Radosits K, Keszei M, Kozma GT, Falus A, Szalai C. CCR5 Delta 32 mutation, Mycoplasma pneumoniae infection, and asthma. J Allergy Clin Immunol 2007;
119:1545-7.
34. Nagy A, Kozma GT, Keszei M, Treszl A, Falus A, Szalai C. The devel- opment of asthma in children infected with Chlamydia pneumoni- ae is dependent on the modifying effect of mannose-binding lec- tin. J Allergy Clin Immunol 2003;112:729-34.
35. Nagy A, Keszei M, Kis Z, Budai I, Tölgyesi G, Ungvári I, Falus A, Sza- lai C. Chlamydophila pneumoniae infection status is dependent on the subtypes of asthma and allergy. Allergy Asthma Proc 2007;
28:58-63.