Article
Decreased R:FR Ratio in Incident White Light A ff ects the Composition of Barley Leaf Lipidome
and Freezing Tolerance in a
Temperature-Dependent Manner
Terézia Kovács1,2,*, Mohamed Ahres3,4, Tamás Pálmai3 , LászlóKovács1, Matsuo Uemura5 , Cristina Crosatti6and Gabor Galiba3,4
1 Biological Research Centre, Institute of Plant Biology, H-6701 Szeged, Hungary; kovacs.laszlo@brc.hu
2 Department of Plant Biology, University of Szeged, 6720 Szeged, Hungary
3 Centre for Agricultural Research, Agricultural Institute, 2462 Martonvásár, Hungary;
mohamed.ahres@atk.hu (M.A.); palmai.tamas@atk.hu (T.P.); galiba.gabor@atk.hu (G.G.)
4 Festetics Doctoral School, Georgikon Campus, Szent István University, H-2100 Gödöll˝o, Hungary
5 Department of Plant-Bioscience, Faculty of Agriculture, Iwate University, Morioka 020-8550, Japan;
uemura@iwate-u.ac.jp
6 CREA Research Centre for Genomics and Bioinformatics, Fiorenzuola d’Arda, 29017 San Protaso, Italy;
cristina.crosatti@crea.gov.it
* Correspondence: kovacs.terezia@brc.hu
Received: 3 September 2020; Accepted: 8 October 2020; Published: 13 October 2020 Abstract: In cereals, C-repeat binding factor genes have been defined as key components of the light quality-dependent regulation of frost tolerance by integrating phytochrome-mediated light and temperature signals. This study elucidates the differences in the lipid composition of barley leaves illuminated with white light or white light supplemented with far-red light at 5 or 15◦C. According to LC-MS analysis, far-red light supplementation increased the amount of monogalactosyldiacylglycerol species 36:6, 36:5, and 36:4 after 1 day at 5 ◦C, and 10 days at 15 ◦C resulted in a perturbed content of 38:6 species. Changes were observed in the levels of phosphatidylethanolamine, and phosphatidylserine under white light supplemented with far-red light illumination at 15◦C, whereas robust changes were observed in the amount of several phosphatidylserine species at 5◦C.
At 15 ◦C, the amount of some phosphatidylglycerol species increased as a result of white light supplemented with far-red light illumination after 1 day. The ceramide (42:2)-3 content increased regardless of the temperature. The double-bond index of phosphatidylglycerol, phosphatidylserine, phosphatidylcholine ceramide together with total double-bond index changed when the plant was grown at 15◦C as a function of white light supplemented with far-red light. white light supplemented with far-red light increased the monogalactosyldiacylglycerol/diacylglycerol ratio as well. The gene expression changes are well correlated with the alterations in the lipidome.
Keywords: barley; cold acclimation; freezing; lipidome; lipid signaling; light regulation;
monogalactosyldiacylglycerol; phospholipid
1. Introduction
Cold stress is one of the major limiting environmental factors of plant growth [1]. Overwintering plants have high plasticity to adapt to cooling [2] at multiple points during their life cycle from seed germination to transition from vegetative to reproductive phase and flowering. The cold acclimation process is also controlled by the circadian clock, day length, and illumination depending on both light intensity and spectral composition [3–6].
Int. J. Mol. Sci.2020,21, 7557; doi:10.3390/ijms21207557 www.mdpi.com/journal/ijms
Winter-hardy plants can improve their freezing tolerance during a 2–7 week-long cold acclimation period prior to the appearance of frost periods under natural conditions. The threshold temperature that triggers cold acclimation is significantly higher in the case of winter-hardy cultivars than for sensitive ones. Furthermore, the capability of winter-hardy plants to sense the low red to far-red ratio (R:FR) conditions in the twilight period significantly contributes to a quick pre-hardening process leading to increased freezing tolerance. Indeed, it was reported inA. thalianaand more recently in cereals that freezing tolerance was increased at non-acclimating temperatures (15–16◦C) when plants were illuminated by supplemented with far-red light (WL+FR) [7–9]. The same C-repeat binding factor (CBF) molecular pathway was found to connect photoperiodic and light quality regulation with frost tolerance in bothA. thalianaand cereals. That process is mediated by phyB and phyA [7–10]. It is also well established that some of the CBF-genes are circadian regulated and their expression reaches a maximum after 6–12 h after dawn in wheat and barley, but the FR light causes earlier transcription (ZT4 to ZT8) [6,9]. Apart from the CBF regulon, FR light-induced activation of PhyA also induces ABA signaling and subsequently JA signaling. The ABA pathway is rather important, because low R:FR treatment did not confer cold tolerance in an ABA-deficient mutant in tomato [11]. These authors concluded that JA functioned downstream of ABA to activate the CBF pathway. Apart from this, ABA does have another important role, namely it is involved in the regulation of the unsaturated fatty acids biosynthesis in plants [12]. Accordingly, it was hypothesized that ABA may activate SnRK2 and FUS3 and suppress PhyB (for details see the very recent review by He et al. [13]). A cluster ofCBFgenes are located in thefrost resistance 2 locus (Fr-A2)on the long arm of chromosome 5A [14–16] in wheat and barley, and therefore they were postulated to be responsible for freezing tolerance. Among them, CBF14 has a major role in the expression of freezing tolerance, both in wheat and barley [17–20].
We found that WL+FR illumination enhancesCBF14expression and increases frost tolerance at 15◦C in winter wheat and barley genotypes, but not inT. monococcum(einkorn), which has a relatively low freezing tolerance [8].
To elucidate the interaction between far-red (FR) light and cold treatment in the pre-hardening process, barley plantlets were grown under different light conditions with low, normal, and high light intensities at 5 and 15◦C, and the expression of theHvCBF14gene and two well-characterized members of the CBF-regulon, HvCOR14b and HvDHN5, were studied [21]. The supplemented FR illumination induced the expression of HvCBF14 and of its target gene HvCOR14b at both temperatures, and the combined effects of cold and FR supplementation increased freezing tolerance in synergy [21]. Earlier experiments demonstrated the impact of complementary FR illumination onCBF gene expression [6,8,22] in different cereals, and the strongest impact of the FR treatment was found at 15◦C after 10 days, whereas at 5◦C after 7 days.
In the recent years, several lines of evidence proved that lipids not only provide structural bases for cell membranes and energy stocks for metabolism in plant cells, but they are also involved in the initiation of defense reactions, as signal mediators in the mitigation processes in response to stress [23,24]. For instance, under WL+FR conditionsHordeum vulgare phosphatidylinositol 4-kinase (HvPI4K)displayed an early phase of expression under light/dark cycles [6], and this signaling pathway plays a role in Ca2+release from intracellular Ca2+stores [25,26]. It is known that calmodulins bind Ca2+when Ca2+levels increase and activate the calmodulin-binding transcriptional activator (CAMTA) proteins. InA. thalianaCAMTA transcription factors bind to the conserved DNA motif 2 (CM 2) of the promoter ofCBFgenes. The calmodulin-binding transcriptional activator 3 (CAMTA 3) is a positive regulator ofCBF2expression, and the doublecamta1 camta3 A. thaliana mutant showed impaired freezing tolerance [27]. In cereals, a direct connection between the regulating effect of CAMTA proteins andCBFexpression has not been disclosed yet [6]. Currently, signaling lipids involved in sensing various stresses such as light and low-temperature are attracting more scientific attention, and among them phosphatidylinositol (PI) and sphingolipids (SL) (the common name is cerebrosides) are the main lipid species [28]. The fact that plant sphingolipids participate in cellular signaling and they are not only structural elements of membranes has also resulted in an increased interest in these molecules.
Ceramides are one group of SLs composed of a long-chain base (LCB) bound to a fatty acyl chain via an amide bond. The hydroxylation and unsaturation level, as well as the fatty acyl chain length of ceramide constituents, is highly variable. In plants, SLs are synthesized through two pathways:
a “de novo” and an alternative salvage route. Ceramides are synthesized by ceramide synthases in the endoplasmic reticulum, where they are further modified to provide more complex SLs [29]. About a thousand SL molecular species have been identified in plants, which makes SLs the most structurally diverse group of lipids [30,31]. Ceramides might play an important role as signaling lipids in both prokaryotes and eukaryotes [32–36]. In plants, SLs are important for plant development, adaptation to abiotic stress and the response to pathogens [37–42].
Earlier experiments have shown that membrane rigidity increases when plants are exposed to cold temperature, resulting in the distortion of the structure of membrane-embedded proteins including photosynthetic complexes [43]. The modification of membrane lipid composition can help to avoid cold-induced damage [2]. This process is strictly regulated [44] through the following traits: membrane fluidity/rigidity, fluctuation of glycerolipid levels [45], saturation level of lipids [46–51], and the ratio of the bilayer (BL) forming and non-bilayer-forming (NBL) lipids [52,53].
Previous studies have identified some key elements in the response to cold treatment of plants, such as MGDG/DGDG, phosphatidylcholine/phosphatidylethanolamine ratio (PC/PE), increase in PA [54], change in the amount and composition of SLs [55–60] and diacylglycerol acyltransferase signaling [61].
Furthermore, ceramides are involved in signal transduction that regulates the amount and composition of SLs in the membrane by cold treatment [33,38].
In our studies, we wanted to explore the role of membrane lipids in cold acclimation during the vegetative stage of cereals. Based on recent experiments, we studied the expression of themonogalactosyl diacylglycerol synthase 2 (MGD2), digalactosyldiacyl glycerol synthase 1 (DGD1), andneutral ceramidase (NC) genes that may play significant roles in the regulation of lipid composition during cold treatment [62–64].
MGD2plays a role in the synthesis of major structural components of photosynthetic membranes and in the biogenesis of envelope. This enzyme can use both prokaryotic (18:1/16:0) and eukaryotic (18:2/18:2) 1,2-diacylglycerol species, but operates with some preference for the eukaryotic one. MGD2is also responsive to phosphate deficiency [63].DGD1is involved in the biosynthesis of DGDG and is located in the thylakoid membrane.DGD1is specific for alpha-glycosidic linkages and is responsible for the final assembly of galactolipids in photosynthetic membranes [65]. TheNCfamily consists of three members:neutral ceramidase 1 (NC1)serves to maintain SL homeostasis. It is involved in the control of oxidative stress.Neutral ceramidase 2 (NC2)hydrolyzes the SL ceramide into sphingosine and free fatty acid.Neutral ceramidase 3 (NC3)is involved in SL biosynthesis [62]. As under stress conditions the levels of phospholipase D and A are also elevated [54,66,67], the relative mRNA expression ofphospholipase D alpha 1 (PLDα1),phospholipase D alpha 2 (PLDα2)andPLDα3 (phospholipase D alpha 3)was also selected for investigation. Plant lipoxygenases may be involved in a number of diverse aspects of plant physiology including growth and development, pest resistance, and senescence or responses to wounding.
These enzymes catalyze the hydroperoxidation of polyunsaturated fatty acids. Based on our previous results, the expression of thelinoleate 9S-lipoxygenase 2 (LLO2)gene can be detected principally during transient increases in lipoxygenase activity in seedlings. Jasmonic acid (JA), derived from linolenic acid via lipoxygenation in plant cells is recognized as a growth regulator [68,69].Lipoxygenase 2.3 (LOC)is required for the wound-induced synthesis of JA in leaves [70,71].Non-lysosomal glucosylceramidase (GC) catalyzes the hydrolysis of glucosylceramide to free glucose and ceramide [28].Aldehyde reductase (ARL) catalyzes the reduction of the aldehyde carbonyl groups on saturated andα,β-unsaturated aldehydes with more than five carbons. It may act as a short alcohol-polyol-sugar dehydrogenase possibly related to carbohydrate metabolism and the acquisition of desiccation tolerance. It may also be involved in signal transduction [72].Alcohol dehydrogenase (AD3)provides a constant supply of NAD+. If the roots lack oxygen, the expression ofAD3increases significantly. Its expression is also increased in response to dehydration and low temperatures; it plays an important role in fruit ripening, seedling and pollen development [73,74]. To elucidate the cold acclimation process of plants, lipidomic approaches have
been extensively applied to the model plantA. thalianabut scarcely to winter cereals such as barley.
Moreover, according to our best knowledge, the possible lipid background of the light quality induced pre-hardening process has not been studied yet. Lipids, especially PLs are the key components, at least as signal molecules, during the phyA-regulated acclimation process [6,7]. It is important to emphasize that phyA is the primary plant photoreceptor responsible for mediating photomorphogenic responses in FR light, and is essential for survival in canopy shade [75–77]. Consequently, its involvement in the pre-hardening process can be considered as a temperature-dependent pleiotropic effect.
Our main goal was to elucidate in what way the plant lipidome responds to FR light, which eventually leads to a significant improvement in the freezing tolerance of plants. Applying the most up-to-date lipidomic analysis technique (electrospray ionization triple quadrupole mass spectrometry [78]), we could determine how the membrane lipid species are quantitatively and qualitatively altered under different temperature and light conditions. This study demonstrates that WL+FR can substitute cold treatment at higher temperature (15◦C), and mostly acts in a synergistic manner at cold (5◦C) nonfreezing temperature.
2. Results
2.1. Addition of FR Light to WL in the Incident Light Improves Basal Freezing Tolerance in a Temperature-Dependent Manner
Plants grown either at 5 or 15◦C under 12-h light/12-h dark photoperiods were exposed to white light (WL) (control) and WL+FR and tested for their freezing tolerance. The results of the electrolyte leakage measurements showed clear differences between the light treatments (Figure1).
At 15◦C, a significant decrease was observed in the relative conductance level of the WL+FR treatment, but only at−7◦C freezing temperature. When the plants were exposed to 5◦C, a substantial reduction in electrolyte leakage was observed, and after freezing at−10 ◦C the deviation was almost 20%
between the different light treatments, whereas at−12 ◦C this diversion was even greater (22%).
These results indicate that WL+FR positively affected the freezing tolerance of barley plants in a temperature-dependent manner.
Figure 1.Relative conductance of barley leaf segments frozen at−5,−7 and−9◦C after incubation at 15◦C for 10 days (A) and frozen at−8,−10 and−12◦C after incubation at 5◦C for 7 days (B) under WL or WL+FR. Mean values±SD of 5 independent biological repetitions are shown. Significance levels are designated as **p<0.05, ***p<0.01.
2.2. Expression Analysis
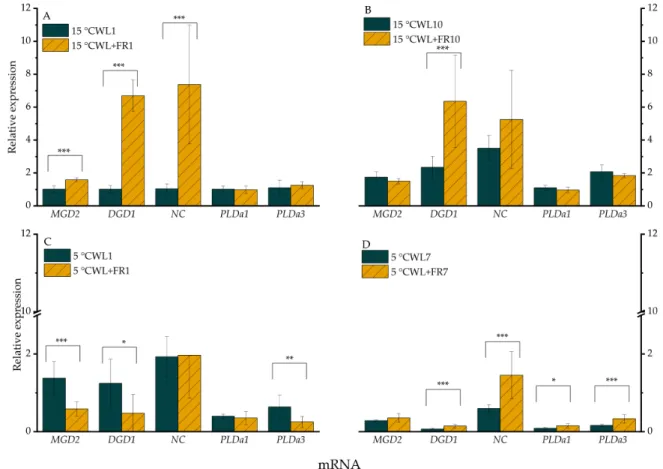
The expression ofMGD2mRNAs in the sample grown under WL+FR was significantly greater (p<0.05) at 15◦C after 1 day (Figure2A), but the differences did not persist on day 10 since the mRNA level also increased in the WL control. When the temperature was shifted from 15 to 5◦C, the expression ofMGD2was significantly lower (p<0.05), after 1 day under WL+FR illumination (Figure2C).
Figure 2. Relative expression levels of selected genes in leaves of barley “Nure” plants incubated at 15◦C for 1 day (A) and for 10 days (B), and leaves grown at 5◦C for 1 day (C) and for 7 days (D), under WL and WL+FR. Mean values±SD of 9 independent biological replicates are shown.
Significance levels are designated as *p<0.1, **p<0.05, ***p<0.01.
The expression ofDGD1was significantly greater (p<0.005) following exposure to WL+FR after both 1 (Figure2A) and 10 days at 15◦C (Figure2B). Compared to the control WL, the mRNA level of DGD1was lower as a consequence of FR supplementation after 1 day at 5◦C (Figure2C) and was drastically lower, independently of the spectral composition of the incident light, after 7 days at 5◦C (Figure2D).
TheNCexpression profile was very similar to that ofDGD1at 15◦C (Figure2A,B), whereas no variation inNCmRNA level was detected at 5◦C in response to a change in WL+FR after 1 day (Figure2C); then, after 7 days, the gene was expressed at a higher level in the sample exposed to WL+FR compared to WL, mainly due to down-regulation ofDGD1mRNA in the latter (Figure2D).
The expression level of thePLDα1andPLDα3genes turned out to be temperature-sensitive (Figure2); after 1 day, it was moderately lowered but a more significant reduction in expression was detected after 7 days at 5◦C. Although the same expression trends could be observed in both WL and WL+FR light regimes, FR light illumination alleviated the cold temperature repression at day 7. WL+FR slightly increased the expression of both genes after 7 days at 5◦C (Figure2D). Notably, the expression ofPLDα2was hardly detectable.
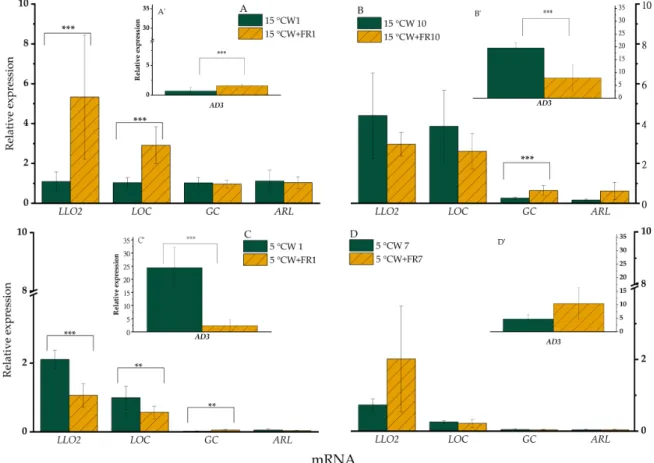
WL+FR significantly (p<0.05) increased the expression ofLLO2after 1 day at 15◦C (Figure3A), whereas after 10 days variation of WL+FR did not impact significantly on the expression ofLLO2 (Figure3B). When the same light conditions were tested in plants exposed to 5◦C, this expression pattern was reversed and WL+FR illumination significantly (p<0.05) lowered the expression ofLLO2 after both 1 and 7 days (Figure3C,D). The gene expression profiles ofLOCandAD3were very similar to that ofLLO2described above (Figure3), except that at 5◦C theLOCmRNA level was not greater after 7 days as a result of FR enrichment.
Figure 3. mRNA relative expression of barley “Nure” leaves grown at 15◦C for 1 day (A,A’) and for 10 days (B,B’), and leaves grown at 5◦C for 1 day (C,C’) and for 7 days (D,D’), under WL and WL+FR. Significance level was determined from 9 independent biological replicates and is designated as **p<0.05, ***p<0.01.
WL+FR elevated the expression level ofGCandARLonly after 10 days at 15◦C compared to the corresponding WL-grown sample (Figure3A,B). At 5◦C, this WL+FR treatment induced a significantly greater expression of GC (p<0.05) only after 1 day, whereas no effect was detected after 7 days (Figure3C,D).
Summary diagrams of the gene expression results can be found in Supplementary Figure S2.
According to the hierarchical clustering of gene expression levels (Figure S3), the most characteristic gene expression changes were observed as a function of WL+FR illumination after 7 days at 5◦C, showing the synergistic relationship between the two treatments.
2.3. Mass Spectrometry Analyses of Isolated Lipids
For lipid analyses, total lipid extracts from barley leaves were used. Electrospray ionization triple quadrupole mass spectrometry was employed to monitor lipid changes that occur both during WL+FR and cold treatment. The alterations caused by WL+FR in membrane lipid quantity and quality were compared at 5◦C and 15◦C.
2.3.1. Changes in Lipid Class Distribution
The effect of FR and 5◦C on lipid class distribution was determined by LC-MS/MS. Table1shows the changes in total lipid contents. WL+FR illumination slightly (not significantly) increased the total lipid content in barley leaves grown at 15◦C. Cold treatment (5◦C) significantly reduced total lipid content after both 1 and 7 days in the leaves of the control WL-illuminated plants. Total lipid content in the WL+FR-treated plants remained constant during the cold treatment (Table1).
Table 1.Total lipid content in barley leaves grown at 15◦C for 1 and 10 days and in leaves grown at 5◦C for 1 and 7 days under WL and WL+FR.
Total Lipid p p
WL (mol%) WL+FR (mol%)
15◦C 1 day 398.64±57.02 473.52±71.02 0.228 15◦C 10 days 405.71±62.59 549.34±87.04 0.081 *
5◦C 1 day 292.3±47.39 457.85±70.17 0.028 **
5◦C 7 days 306.95±47.09 472.46±72.43 0.029 **
Mean±SD values were calculated from three independent biological replicates. Significance levels in table are designated as *p<0.1, **p<0.05. Mean±SD values were calculated from 3 independent biological replicates.
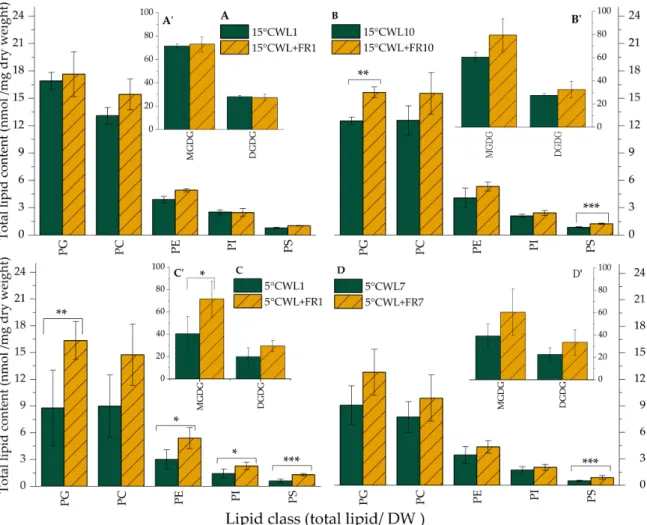
Most of the lipids identified in barley leaves illuminated with both WL and WL+FR belong to the MGDG lipid class (Figure4). Upon WL+FR treatment, the MGDG content in barley leaves was significantly greater at 5◦C after 1 day. DGDG content was not altered substantially (Figure4A’–D’).
As for the other lipid classes, only PG, PE, and PS responded to WL+FR significantly. Compared to WL, WL+FR treatment resulted in greater PS content in the leaves, reached at different rates but significantly under each set of experimental conditions.
PE content was significantly greater after 1 day of WL+FR treatment at 5◦C, whereas PG increased significantly both after 1 day at 5◦C and after 10 days at 15◦C (Figure4A–C).
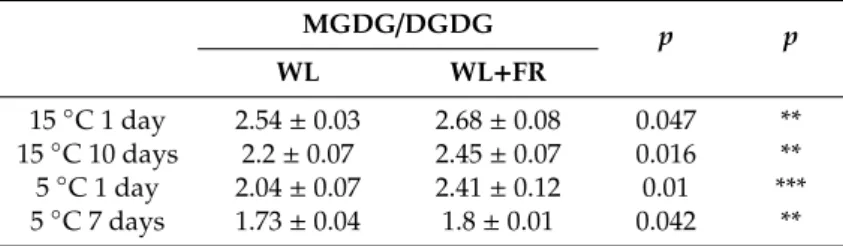
The ratio of MGDG and DGDG, the main lipid components in the chloroplast that form the double-layered membrane was greater as a result of FR treatment at each sampling point, most substantially at 5◦C after 1 day (Table2).
Table 2.The MGDG/DGDG lipid ratios in barley leaves grown at 15◦C for 1 and 10 days and in leaves grown at 5◦C for 1 and 7 days under WL and WL+FR.
MGDG/DGDG p p
WL WL+FR
15◦C 1 day 2.54±0.03 2.68±0.08 0.047 **
15◦C 10 days 2.2±0.07 2.45±0.07 0.016 **
5◦C 1 day 2.04±0.07 2.41±0.12 0.01 ***
5◦C 7 days 1.73±0.04 1.8±0.01 0.042 **
Significance levels in tables are designated as **p<0.05, ***p<0.01. Mean±SD values were calculated from 3 independent biological replicates.
The PC to PE ratio determines the membrane chilling responses, and moreover, serves as an index for membrane resistance against frost injury [79]. In general, PC/PE was lower in the leaf samples as a consequence of WL+FR. Changes induced by WL+FR treatment were in synergy with cold treatment, since after lowering the temperature from 15 to 5◦C, PC/PE decreased even in the WL-illuminated control (Supplementary Table S2).
Figure 4. Lipid class distribution of barley “Nure” leaves grown at 15◦C for 1 day (A,A’) and for 10 days (B,B’), as well as in leaves grown at 5◦C for 1 day (C,C’) and for 7 days (D,D’) under WL and WL+FR. Mean values±SD were calculated from 3 independent biological replicates. Significance levels are designated as *p<0.1, **p<0.05, ***p<0.01.
2.3.2. Lipid Species Distribution within Different Lipid Classes
Although there was no significant alteration within the MGDG lipid molecular class in barley leaves upon WL+FR treatment at 15◦C (Supplementary Figure S4), an increase in the amount of each lipid species was noticeable at 5◦C (Figure5A,B). In the case of the DGDG molecular species, WL+FR increased the content of 34:2, 36:5 and 34: 2, 36: 3 lipid species in the barley leaves at 5◦C after the 1 and 7-day treatment (Figure5C,D).
The total HexCer content increased significantly (p<0.05) from 215 nmol/mg dry weight to 295 in barley leaves upon WL+FR treatment at 15◦C both in 1 and 10 days in comparison with WL-illuminated samples. Among the different HexCer lipid molecular species, the highest increment was observed in the amount of the (42:2)-3 lipid molecular species at WL+FR and 15◦C. This deviation was highly significant (p<0.01) after 10 days (Figure6B). The total HexCer content of barley leaf samples illuminated by the control WL did not change significantly under treatment at 5◦C. Contrarily, when the plants were grown under WL+FR illumination, the ratio of HexCer (42:2)-3 increased significantly in plants kept for 7 days at 5◦C (Figure6D). This lipid molecule contains two DBs;
consequently, its increased amount could be important in the cold acclimation process, because it might increase membrane fluidity [66].
Figure 5.The amount of the most abundant MGDG and DGDG lipid species in barley “Nure” leaves grown at 5◦C for 1 day (A,C) and for 7 days (B,D) under WL and WL+FR. Lipid species are denoted as total carbon number: total double-bond. Mean values±SD were calculated from 3 independent biological replicates. Significance levels are designated as *p<0.1, **p<0.05.
Figure 6.HexCer lipid-class distribution of barley “Nure” leaves grown at 15◦C for 1 day (A) and for 10 days (B), as well as in leaves grown at 5◦C for 1 day (C) and for 7 days (D), under WL and WL+FR.
Mean values±SD were calculated from 3 independent biological replicates. Significance levels are designated as **p<0.05, ***p<0.01.
The concentration of each PA species, especially the 34:1 (p<0.01) and 36: 4 (p<0.01), 36:3 (p<0.01), 36:2 (p<0.01) polyunsaturated lipids, increased in barley leaves as a result of WL+FR treatment at 5◦C at both sampling dates (data not shown). The measured small alterations were not expected, because PA is an important precursor for lipid biosynthesis and plays a role in signaling pathways [54].
2.3.3. Changes in the Unsaturation Level of Fatty Acids
To review cell membrane lipid unsaturation, the double-bond index (DBI) was calculated based on the percentage of lipid species and total double bonds (DB) identified by lipidomics. Table3shows the DBI of total lipids of plants treated at different temperatures. Unexpectedly, we could not observe significant differences in DBI under any conditions we applied [49]. However, we found significant differences in certain lipid classes.
Table 3.Total lipid double-bond index in barley leaves grown at 15◦C for 1 and 10 days and in leaves grown at 5◦C for 1 and 7 days under WL and WL+FR.
DBI p p
WL WL+FR
15◦C 1 day 4.78±0.36 4.74±0.23 0.879 15◦C 10 days 4.8±0.34 4.87±0.5 0.851 5◦C 1 day 4.78±0.4 4.76±0.37 0.952 5◦C 7 days 4.6±0.35 4.7±0.73 0.841
Double-bond indices were calculated as described in the Materials and Methods. Mean±SD values were calculated from 3 independent biological replicates.
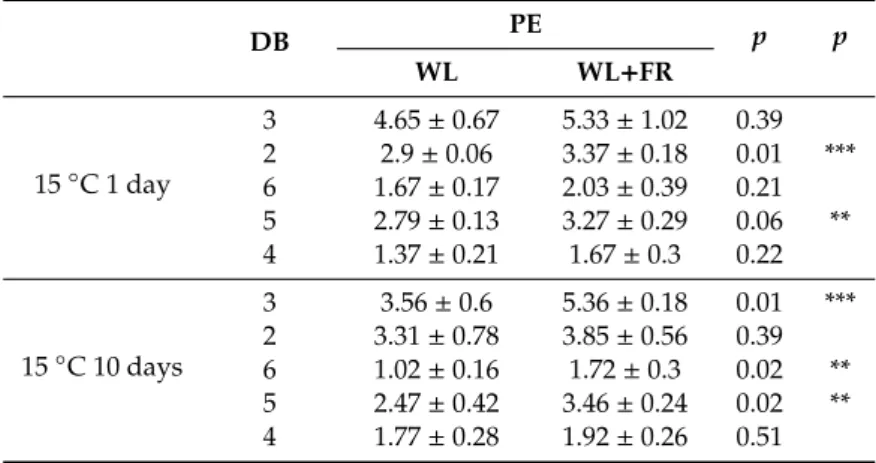
The saturation of PE species can be seen in Table4. With WL+FR illumination, the level of unsaturation was greater on day 1 at 15◦C, and this trend continued until day 10 of the treatment.
The same trend can be seen on days 1 and 7 at 5◦C. At 15◦C, there is a significant difference in the number of species containing 2 and 5 DBs and 3, 6 and 5 DBs on days 1 and 10, respectively. Saturation levels were significantly greater on day 1 for the 5◦C treatment to 3, 2, 5 and 4, but this difference diminished by day 7 of the treatment (Table4).
Table 4.PE species content in barley leaves grown at 15◦C for 1 and 10 days and in leaves grown at 5◦C for 1 and 7 days under WL and WL+FR.
DB PE p p
WL WL+FR
15◦C 1 day
3 4.65±0.67 5.33±1.02 0.39 2 2.9±0.06 3.37±0.18 0.01 ***
6 1.67±0.17 2.03±0.39 0.21 5 2.79±0.13 3.27±0.29 0.06 **
4 1.37±0.21 1.67±0.3 0.22
15◦C 10 days
3 3.56±0.6 5.36±0.18 0.01 ***
2 3.31±0.78 3.85±0.56 0.39 6 1.02±0.16 1.72±0.3 0.02 **
5 2.47±0.42 3.46±0.24 0.02 **
4 1.77±0.28 1.92±0.26 0.51
Table 4.Cont.
DB PE p p
WL WL+FR
5◦C 1 day
3 2.8±1.13 5.27±1.01 0.05 **
2 2.27±0.7 4.23±0.77 0.03 **
6 0.9±0.44 1.67±0.45 0.11 5 1.97±0.68 3.49±0.68 0.05 **
4 1.25±0.37 2.13±0.39 0.04 **
5◦C 7 days
3 2.9±0.66 4.2±1.7 0.29
2 3.04±0.89 3.38±0.14 0.54 6 0.85±0.25 1.41±0.9 0.35 5 2.17±0.62 2.76±0.78 0.36 4 1.6±0.5 1.74±0.07 0.65
Amount of PE species was calculated as described in Materials and Methods. Significance levels in tables are designated as **p<0.05, ***p<0.01. Mean±SD values were calculated from 3 independent biological replicates.
2.3.4. Changes in the Lysophospholipid Level of Fatty Acids
LPD serves as a precursor pool available for PC and PE biosynthesis [54]. These molecules are also considered as indicators for the correctness of lipid extraction from various samples. Upon decreasing the temperature from 15 to 5◦C, the amount of LysoPC was lower in the WL-illuminated control samples. Contrary to this phenomenon, WL+FR illumination increased their concentration substantially upon a shift to low temperature (Table5). However, LysoPE content was altered as a consequence of temperature decrease; moreover, WL+FR illumination does affect its concentration in the leaf samples (Table6). From a technical point of view, we can conclude that the low amount of LysoPC lipids in the samples indicates that our extraction procedure was appropriate (see Materials and Methods).
Table 5.LysoPC in barley leaves grown at 15◦C for 1 and 10 days and in leaves grown at 5◦C for 1 and 7 days under WL and WL+FR.
LysoPC (Signal/Mass Dry Tissue Weight) p p
WL WL+FR
15◦C 1 day 0.37±0.2 0.7±0.08 0.057 *
15◦C 10 day 0.57±0.42 0.46±0.21 0.706
5◦C 1 day 0.5±0.29 0.66±0.33 0.562
5◦C 7 day 0.46±0.32 0.49±0.27 0.907
Significance levels in tables are designated as *p<0.1. Mean±SD values were calculated from 3 independent biological replicates.
Table 6.Lyso PE in barley leaves grown at 15◦C for 1 and 10 days and in leaves grown at 5◦C for 1 and 7 days under WL and WL+FR.
Lyso PE (Signal/Mass Dry Tissue Weight) p p
WL WL+FR
15◦C 1 day 0.25±0.05 0.39±0.03 0.014 **
15◦C 10 day 0.3±0.14 0.36±0.16 0.651
5◦C 1 day 0.37±0.12 0.43±0.12 0.573
5◦C 7 day 0.35±0.1 0.4±0.05 0.482
Significance levels in tables are designated as **p<0.05. Mean±SD values were calculated from 3 independent biological replicates.
3. Discussion
It is well established that illumination affects several aspects of plant development including stem elongation, shoot branching and flower induction. In addition, more and more evidence
has been accumulated recently about the active adaptation of plants to the current and impending changes in the environment by using light-derived non-photogenic signals coming from photosensory receptors [80,81]. Several studies inA. thalianaand cereals showed the modulation of cold acclimation by phytochrome-derived signals affecting the expression of the CBF regulon [6–8,82]. The changes in the lipidome that maintains membrane integrity during frost as a result of FR-induced freezing tolerance in plants have not been described yet. Therefore, we set out to study the alterations in the composition and quality of membrane lipids and the expression of possible related genes in barley leaves subjected to a combination of temperature and WL+FR light treatments. WL+FR illumination markedly elevated the PG and PS levels of barley leaves after 10 days at 15◦C as compared to the WL control, whereas the levels of other lipid classes remained unchanged (Figure4B). Intriguingly, WL+FR caused bigger alterations in the lipid composition at 5◦C than at 15◦C. At 5◦C, WL+FR illumination led to markedly increased levels of MGDG, PG, PE, PI and PS already after 1 day (Figure4C). PE, PS, and PG are prominent lipid classes, which have important roles in signal transduction processes [80].
We presume that elevated amount of PG (Figure4) promotes the proper functioning of the thylakoid membrane at 5◦C [54]. PG is known to play a significant role in the construction of the thylakoid membrane and is an important constituent of photosynthetic complexes [83].
It is generally recognized that the unsaturation of fatty acid side chains plays an important role in cold acclimation by modulating membrane fluidity [43]. The increase of DBI would imply more fluid membrane composition. Although we could not observe any significant alterations in total lipid DBI (Table3), some lipid classes showed a significant increase in DBI. For example, WL+FR illumination elevated the amounts of the 34:2 and 36:3 DGDG molecular species, which were significantly greater after a 7-day WL+FR treatment (Figure 5D). Under WL+FR illumination, the proportion of the HexCer (42:2)-3 lipid molecular species was significantly greater after 10 days at 15◦C (Figure6B).
Furthermore, the ratio of the HexCer (42:2)-3 molecular species was also significantly greater among ceramides in plants kept at 5◦C for 7 days (Figure6C). We may consider these alterations as a cold acclimation process triggered by WL+FR illumination.
Previous research has shown that MGDG and DGDG account for the largest proportion of the total lipid composition of barley chloroplast membranes [84]. In addition, an increased ratio of BL to NBL membrane lipids (i.e., a decrease in MGDG/DGDG) was observed in plants responding to low temperatures [52,54,85]. Our experimental results contradict this trend to some extent, because as a result of WL+FR treatment the MGDG/DGDG ratio increased at both 5 and 15 ◦C (Table2). According to our frost test, the small increase in the MGDG/DGDG ratio does not have any detrimental effect on membrane stability in barley leaves, suggesting that the other changes triggered by WL+FR treatment, either in lipid composition or DBI content, counterbalanced this modification.
Notably, membrane fluidity increases parallel to the ratio of phospholipids/free sterols in plants, which improves cold tolerance [86].
It was reported that the total amount of PC and PE increased during cold acclimation in rye, A. thalianaand wheat leaves, and the gradual increase in PE parallels the cold-induced increase in frost tolerance [86–88]. Under our experimental conditions, the 7-day cold treatment at 5◦C did not significantly affect the total amount of PC and PE (Figure4D). During this treatment, the plants could reach only a pre-hardened phase, because full cold hardiness in winter cereals is achieved after 3 to 5 weeks of cold treatment at−2–4◦C [88,89]. Surprisingly, however, the amount of PE increased as a result of WL+FR illumination after 1 day at 5◦C (Figure4C). Therefore, we presume that the applied FR light accelerated the cold acclimation process. The other, and probably more important, alteration caused by WL+FR treatment was the significant increment in the number of DBs in the different molecular classes belonging to PE (Table4). The ratio of the increment within the PE molecular species was much more pronounced. The amount of unsaturated molecular species in the plasma membranes has been correlated with cold-acclimation in cereals andA. thaliana[86,87,90–92]. The frost-resistant “Onice”
winter barley, for example, had a much higher free fatty acid content (predominantly unsaturated) than the frost-sensitive barley cultivar “Gitane” [89]. Accordingly, Bohn et al. (2007) [88] suggested that the
changes in PE molecular species during cold acclimation can be used as a diagnostic marker to predict the degree of frost tolerance in cereals. Based on our results, we highly agree with this statement and presume that WL+FR illumination increased freezing tolerance of the winter-hardy barley cultivar
“Nure” at 15◦C through a modification of the abundance of different PE molecular species. The above results also warrant future studies to elucidate the role of barley fatty acid desaturase and SL desaturase enzymes in cold acclimation.
Changes in membrane lipids under cold or freezing stress influence the formation of lipid signaling molecules. Cellular receptors recognize lipid molecules by their phosphate head groups [93]. The levels of lysophospholipids species, LysoPC, LysoPE, and PA increased whenA. thalianaplants were exposed to cold treatments [54]. The PA level was also greater in cold-tolerantEutrema salsugineumplants slightly similar to the “Nure” cultivar of barley [94]. In our experiments, higher total LysoPC (Table5) and lower total LysoPE (Table6) levels were detected in leaves exposed to WL+FR light for 10 days at 15◦C, but the PA level did not change. This tendency was more pronounced for plants grown at 5◦C (Tables5and6) under the same illumination. The PA levels were also raised higher at 5◦C by WL+FR illumination as early as on day 1 of the treatment. These results may indicate that WL+FR illumination may induce a signal transduction pathway, thus increasing the viability of the plant grown at 5◦C as compared to WL only.
The HexCer lipid family is known to be involved in a variety of stress processes and cell death, as well as in ABA signaling activity [73,74]. However, while the level of the HexCer species (42:2)-3 did not change significantly either at 5 or at 15◦C after 1 day (Figure6A,C), the amount of this HexCer species markedly increased after day 10 at 15◦C (Figure6B) and particularly after day 7 at 5◦C (Figure6D). The most significant difference was on day 7 at 5 ◦C. This lipid species may be involved in the signal transduction induced by WL+FR. We also investigated the related gene expressions. Expression of NCwas strongly up-regulated by WL+FR light after 1 day at 15 ◦C (Figure2A). The decreased FR ratio has an effect on the expression ofMGD2andDGD1after 10 days at 15◦C and after 7 days at 5◦C, although only theDGD1gene expression was significantly greater (p<0.01) (Figure2). Interestingly, the MGDG and DGDG content did not correlate with the expression ofMGD2andDGD1.It was reported that red and FR light both induce an increase inMGD2mRNA and enzyme activity in etiolated cucumber cotyledons, suggesting a role for the photoreceptor PhyA . PhyA was also reported to regulate the FR-induced upregulation of the CBF regulon responsible for frost tolerance in bothA. thalianaand cereals [30,88,95].
It has been shown that low temperature activates phospholipase A and phospholipase D in A. thaliana[54]. It was also reported that short-term cold treatment activates phospholipase D and phospholipase A with galactolipid substrates [96,97]. This process can lead to the destabilization of membrane BLs, membrane fusion and cell death [54,98]. In our experiments, WL+FR illumination lowers the expression ofPLDα3after 1 day at 5◦C (Figure2C), suggesting that WL+FR illumination alleviates the effect of 5◦C. As a result, the amount of NBL lipids was greater by WL+FR illumination.
The relative expression ofLOC(Figure3A) was down-regulated by WL+FR illumination at 15 ◦C. In contrast, a greater relative expression of LOCwas found at 5◦C when illuminated by WL+FR (Figure3C). Similar changes occurred in the relative expression ofLLO2mRNA (Figure3C), which was more pronounced after 7 days at 5◦C. Lipoxygenase enzymes participate in oxylipin signaling. Fatty acid hydroperoxides produced by 9- or 13-lipoxygenases can be further converted enzymatically to various oxylipins including, most notably, JA. Thus, the activity of 13-lipoxygenases is linked to JA-mediated cold-stress tolerance [99].
The stronger response during 5◦C treatment is also supported by the up-regulated expression ofAD3(Figure3C). Accordingly, a similar trend could be observed in the relative expression ofGC, but only after 10 days at 15◦C (Figure3B) and after 1 day at 5◦C (Figure3C).
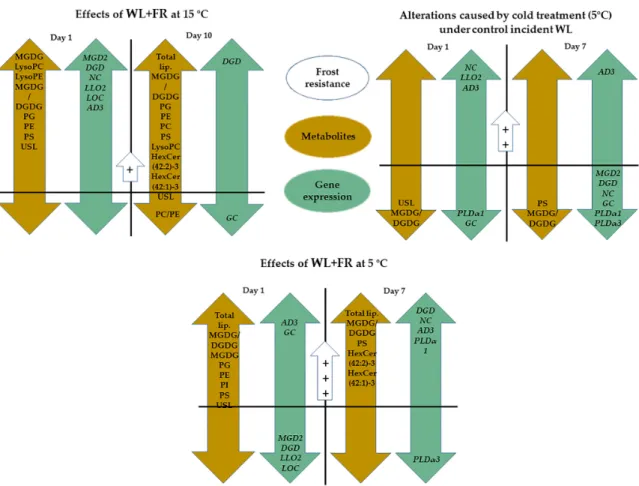
The present findings confirm that WL+FR affected both lipid content and quality in barley leaves (Figure7). Opposite to the expected effect of cold treatment, MGDG/DGDG was greater under WL+FR illumination in all cases. WL+FR illumination elevated the amount of PE and also significantly
increased the ratio of the molecular species with high DB content that belong to both the PC and PE lipid classes. Similarly to this phenomenon, the LysoPC content also changed in opposite directions during the two treatments. The expression ofMGD2, DGD1, NC, LLO2, LOC, andAD3genes was markedly up-regulated as a consequence of FR light enrichment at 15◦C after 1 day. We suggest that FR-induced freezing tolerance should be considered as an important part of the pre-hardening phase.
Figure 7.Our conclusion about the effect of WL-enriched FR and cold temperature on lipid content and quality of the expression of the related genes in barley leaves. Lipid composition changes under WL+FR:
LysoPC, LyoPE, PC, PG, PE, PS. Lipid composition changes elicited by cold temperature: Total lipid, PI.
The PC/PE lipid ratio decreased under WL+FR. Gene expression changes under WL+FR:NC, DGD1, GC.
Gene expression changes elicited by cold temperature:GC, NC, AD3, PLDα1, PLDα3. Gene expression changes elicited by both cold temperature and WL+FR:GC, NC. The decrease inLLO2andLOC gene expression positively influences membrane integrity after the cold acclimation period [71–74].
Symbols: Orange: Lipid metabolite changes; Green: Gene expression patterns; Blue: Frost resistance changes; The order of the induced frost tolerance:+ < ++ < +++. The significance level in figures is p<0.1.
4. Materials and Methods
4.1. Strains and Growth Conditions
AH. vulgaressp. vulgare winter barley genotype, cv. “Nure” with good cold tolerance was studied. Three days after seed germination, seedlings were planted into Jiffy-7 36 mm diameter feed disks (Jiffy Group, Oslo, Norway). Subsequently, plants were transferred to a PGV-36 (Conviron PGV36; Controlled Environments Ltd., Winnipeg, MB, Canada) growth chamber equipped with a modular LED light ceiling. The plants were grown at 15◦C day/night temperature, 12-h day length and illuminated by a continuous wide-spectrum LED (Philips Lumileds, San Jose, CA, USA, LXZ25790-y)
WL at 250 photosynthetically active radiation (PAR) intensity (µmol m−2s−1, (PPFD)) for 14 days.
The plants received 50% Hoagland medium 3 times a week.
4.2. Light and Temperature Treatments
Half of the two-week-old plantlets were transferred to another growth chamber equipped with the same type of modular LED light ceiling as described above. Both chambers were divided into 2 areas. In the control area, the light conditions remained the same as during pre-nursing (12-h day length and 250 PAR WL). In the other area, supplementary FR illumination was added to WL with a narrow 750 nm LED (Edison Edixeon, 2ER101FX00000001). The control WL did not contain any FR.
The R:FR reached 0.5 as a result of FR supplementation (Supplementary Figure S1). The total light intensity remained the same 250 PAR as in the control WL. The temperature was the only difference between the two chambers: 15◦C in the first chamber and 5◦C in the second one. Samples were taken on the 1st and 7th days from plants kept at 5◦C and on the 1st and 10th days from plants kept at 15◦C.
In both cases, lighting was switched on at 06:00 h, and the samples were collected between 12 and 14:00 (i.e., after 6–8 h illumination).
4.3. Freezing Test of Leaf Samples
To evaluate the frost tolerance of the plants, we measured the electrolyte leakage levels, as previously described [100], using small leaf samples frozen in a GP200-R4 liquid freezing system (Grant Instruments, Shepreth, UK) in five biological repetitions per treatment per freezing point.
For plants grown at 15◦C, the freezing temperatures were−5,−7, and−9◦C, whereas leaf samples of plants exposed to 5◦C were frozen at −8, −10, and −12◦C. The samples were shaken for 2 h in MQ water and then the determination of the electrolyte leakage level was carried out with a Conductometer (Mikro KKT, Budapest, Hungary). Data analysis was performed with Multi-Sample Conductometer version 1.0 (Intron Software, Biological Research Centre, Szeged, Hungary (Copyright©
L. Mencel 2002)).
4.4. qPCR Measurement
Total RNA was isolated from leaf samples with the Direct-zol™RNA MiniPrep kit (Zymo Research Corp., Irvine, CA, USA) according to the manufacturer’s instructions. Subsequently, cDNA libraries were made using Moloney Murine Leukemia Virus (M-MLV) Reverse Transcriptase and oligo (dT) 18 primers (Promega Corporation, Madison, WI, USA). Relative expression levels were determined using KAPA SYBR®FAST, Master Mix (2X), Universal qPCR kit (Kapa Biosystems, Inc., Wilmington, MA, USA) with CFX96 Touch™Real Time PCR Detection System (Bio-Rad Hungary Ltd., Budapest, Hungary). PCR primers were designed using the NCBI-Primer Design Tool (National Center for Biotechnology Information, Bethesda, MD, USA) software. Relative expression levels were calculated by the∆∆Ct method, where cyclophilin was used as the reference gene [101]. The primer sequences and references are available at Supplementary Table S1 [102]. The already known synthetic pathways were used for processing the results of the qPCR measurement. Before processing, we selected enzymes that may play a significant role in the regulation of the pathways we studied. The following databases were used to identify these genes and enzymes: Arabidopsis Acyl-Lipid Metabolism Pathways (http:
//aralip.plantbiology.msu.edu/pathways/phospholipid_signaling), Tair (https://www.arabidopsis.org/), ExPasy (https://enzyme.expasy.org/) The lipid results that we obtained in the ESI-MS/MS lipid profile measurement also helped us to select the appropriate gene.
4.5. Lipid Isolation and Lipidomics
Total lipids were extracted from intact barley leaves according to [54] with small modifications.
The fresh weight of each leaf sample was 0.2 g. For lipid extraction, we collected the leaves separately from three plants from each temperature regime on the 1st and 7th or 10th day of treatments.
At sampling, the middle third of flag leaves was cut and chopped and put instantly into a 10-mL glass
tube with a Teflon-lined screw-cap (Thermo Fisher Scientific, Inc., Waltham, MA, USA) containing 3 mL isopropanol/0.01% BHT mixture at 75◦C and were incubated for 30 min. Next, we added 1.5 mL chloroform and 0.6 mL water to the solvent and agitated the sample at room temperature for 1 h, then we added 4 mL chloroform/methanol (2:1)/0.01% BHT extraction solvent, followed by shaking for 30 min. We collected the extract into a clean glass tube. We washed the barley leaves with extraction solvent five times; the last wash was 12 h long. We added 1.0 mL 1 M KCl to the pooled extracts. After vortexing, the phases were separated by centrifugation and the upper phase was discarded. Then we added 2.0 mL of water to the extract and repeated the phase separation. At this stage, the solvent was evaporated from the extract in a nitrogen evaporator. Finally, the lipid extract was dissolved in 1 mL chloroform and stored at−80◦C. To determine the dry weight, the extracted leaf pieces were dried at 110◦C in an oven overnight, cooled, and weighed. Dry weights were determined using a balance (Mettler Toledo AX, Mettler Toledo International, Inc., Columbus, OH, USA), which had a detection limit of 2µg. The mass spectrometry analysis of the total lipid extracts was carried out by the MS-based method and performed at the Kansas Lipidomics Research Center Analytical Laboratory (https://www.k-state.edu/lipid/analytical_laboratory/lipid_profiling/index.html).
4.6. ESI-MS/MS Lipid Profiling
An automated electrospray ionization-tandem mass spectrometry approach was used, and data acquisition and analysis and acyl group identification were carried out as described [103].
Unfractionated lipid extracts were introduced by continuous infusion into the ESI source on a triple quadrupole MS/MS (API4000, ABSciex, Framingham, MA, USA). Data processing was described at the Kansas Lipidomics Research Center home page (https://www.k-state.edu/lipid/analytical_laboratory/
lipid_profiling/index.html). The molecular species were identified by the presence of a specific head group fragment and the mass. The mass generally allows us to assign a specific number of acyl carbons and the number of DB. After correction for isotopic overlap, the peaks on the spectra were quantified in comparison to a group of internal standards. Generally, two internal standards of each head group class were used. The amounts were normalized as nmol/mg dry weight. One signal unit equals 1 nmol of internal standard from the same lipid group (usually with an adjustment for variation in response with m/z) (https://www.k-state.edu/lipid/analytical_laboratory/lipid_profiling/index.html). The precursor and neutral loss methodologies that are routinely utilized contrast with the more typically used product ion scans. The first mass spec corresponding to a particular molecular ion mass is held at a constant electrical field, while scanning is performed with the second mass spec to detect the fragments made in the collision cell. Product ion scans can be used to determine the head group or other fragments that are produced, as well as to identify the fatty acyl groups, in particular polar lipid molecular species, when this additional analysis is required.
4.7. Double Bond Index
The DBI of each lipid molecular species was calculated as the product of the amount of lipid molecular species and the average number of DBs/acyl chain, where the average number of DBs/acyl chain was calculated by dividing the number of DBs in the lipid molecular species by the number of acyl chains. Finally, the DBI of a lipid head group class was calculated as the sum of the unsaturation indices of individual lipid molecular species in that class according to the following equation [Σ(% of normalized signal intensity/mg dry weight of lipid species×no. of DB)]/100, as described in [43].
4.8. Statistics and Reproducibility
Three independent biological replicates were used at each measurement. The significance of the difference between WL+FR samples grown at 5 or 15◦C and the corresponding WL control samples were determined by Student’st-tests using GraphPad Prism version 8.0.1 for Windows (GraphPad Software, San Diego, CA USA) software. Significance levels in figures are designated as *p<0.1,
**p<0.05, ***p<0.01.
Supplementary Materials:The following are available online athttp://www.mdpi.com/1422-0067/21/20/7557/s1, Figure S1: The light spectrum used for illumination. White light (W)spectrum (Panel A). White supplemented with decrease FR light (W+FR) (Panel B). Figure S2: Hierarchical clustering of gene expression levels detected in winter barley leaves grown at 15◦C for 1 day and for 10 days under W and W+FR.DGD, digalactosyldiacyl glycerol synthase; NC, neutral ceramidase; LLO2, linoleate 9S-lipoxygenase 2;PLDα1, phospholipase D alpha 1; GPAT, probable glycerol-3-phosphate acyltransferase 3; MGD2, monogalactosyl diacylglycerol synthase 2; PLDα1, phospholipase D alpha 1;
LOC, lipoxygenase 2.3, chloroplastic; MGD1, monogalactosyl diacylglycerol synthase 1; PPC, phosphatidylinositol phospholipase C; GC, non-lysosomal glucosylceramidase; ARL, NADPH-dependent aldehyde reductase-like protein, chloroplastic; KCES1 ; AD3, alcohol dehydrogenase 3. Three independent experiments, each with three parallel samples, were conducted, Figure S3: Hierarchical clustering of gene expression levels detected in winter barley leaves grown at 15◦C for 1 day and for 10 days under W and W+FR.DGD, digalactosyldiacyl glycerol synthase; NC, neutral ceramidase; LLO2, linoleate 9S-lipoxygenase 2; PLDα1, phospholipase D alpha 1; GPAT, probable glycerol-3-phosphate acyltransferase 3; MGD2, monogalactosyl diacylglycerol synthase 2; PLDα1, phospholipase D alpha 1;
LOC, lipoxygenase 2.3, chloroplastic; MGD1, monogalactosyl diacylglycerol synthase 1; PPC, phosphatidylinositol phospholipase C; GC, non-lysosomal glucosylceramidase; ARL, NADPH-dependent aldehyde reductase-like protein, chloroplastic; KCES1, ; AD3, alcohol dehydrogenase 3. Three independent experiments, each with three parallel samples, were conducted., Figure S4: Percentages of the most abundant MGDG and DGDG lipid species in winter barley „Nure” leaves grown at 15◦C for 1 day (Panel 4A and C) and for 10 days (Panel 4B and D) under WL and WL+FR. Lipid species are denoted as total carbon number: total double-bond. Significance levels in figures are designated as **p<0.05. Mean±SD values were calculated from three independent biological replicates.
Table S1: Primer sequences and references, Table S2: PC/PE ratio were calculated as described in the Materials and Methods. Significance levels in tables are designated as **p<0.05. Mean±SD values were calculated from three independent biological replicates.
Author Contributions:G.G., M.U., L.K. and C.C. contributed conception and design of the study, supervised the experimental work and corrected parts of the manuscript; M.A. raised barley and measured the freezing tests.
M.A. and T.P. carried out the qPCR measurements and performed qPCR; T.K. processed barley samples, analyzed the data and wrote the article. All authors contributed to manuscript revision. All authors have read and agreed to the published version of the manuscript.
Funding:This work was supported by the National Research, Development and Innovation Office of Hungary NKFIH [K124922, K128575 and PD128280], Hungarian Governmental Grant [GINOP-2.3.2-15-2016-00001] and by the EFOP-3.6.3-VEKOP-16-2017-00008 projects. The project was co-financed by the European Union and the European Social Fund. The described lipid analyses were performed at the Kansas Lipidomics Research Center Analytical Laboratory. Instrument acquisition and lipidomics method development were supported by the National Science Foundation (EPS 0236913, MCB 1413036, MCB 0920663, DBI 0521587, DBI1228622), Technology Enterprise Corporation, K-IDeA Networks of Biomedical Research Excellence (INBRE) of the National Institute of Health (P20GM103418) and Kansas State University.
Acknowledgments: The authors would like to acknowledge the help of Zoltan Gombos who initiated this project, but has sadly passed away during the completion of this work. The authors of the manuscript are indepted of his scientific wisdom, uniqueness and enthusiasm to discover the essential role of various lipids and membrane components for cyanobacterial photosynthetic processes. The authors are grateful to Fulvia Rizza (CREA,·Genomics Research Centre (CREA-GPG)), Franz-W. Badeck (CREA.·Genomics Research Centre (CREA-GPG)), Gullner Gábor (Agricultural Institute, Centre for Agricultural Research), Péter Zsámboki and Erzsebet Fejes for critical reading and correcting the manuscript.
Conflicts of Interest: The authors declare no conflict of interest. The funders had no role in the design of the study; in the collection, analyses, or interpretation of data; in the writing of the manuscript, or in the decision to publish the results.
Abbreviations
ACER1 alkaline ceramidase 1
AD3 alcohol dehydrogenase 3
ARL NADPH dependent aldehyde reductase-like protein, chloroplastic
BL bilayer-forming lipid
CAMTA calmodulin-binding transcriptional activator CAMTA 3 calmodulin-binding transcriptional activator 3
CBF C-repeat binding factor
CBF regulon CBF-regulated genes
CBF1 C-repeat binding factor 1
CBF2 C-repeat binding factor 2
CBF3 C-repeat binding factor 3
CBF14 C-repeat binding factor 14
CM2 conserved DNA motif 2
DB double-bond
DBI double-bond index
DGD1 digalactosyldiacyl glycerol synthase 1
DGDG digalactosyldiacylglycerol
FR far-red
GC non-lysosomal glucosylceramidase
HexCer ceramide
JA jasmonic acid
LLO 2 linoleate 9S-lipoxygenase 2 LOC lipoxygenase 2.3. chloroplastic
LysoPC lysophosphatidylcholine
LysoPE lysolphosphatidylethanolamine
LysoPG lysophosphatidylglycerol
MGD2 monogalactosyl diacylglycerol synthase 2
MGDG monogalactosyldiacylglycerol
MGDG/DGDG monogalactosyldiacylglycerol/digalactosyldiacylglycerol ratio
MS mass spectroscopy
NBL non-bilayer forming lipid
NC neutral ceramidase
NC1 neutral ceramidase 1
NC2 neutral ceramidase 2
NC3 neutral ceramidase 3
PA phosphatide acid
PC/PE phosphatidylcholine/phosphatidylethanolamine ratio
PE phosphatidylethanolamine
PG phosphatidylglycerol
PhyA phytochrome A
PhyB phytochrome B
PI phosphatidylinositol
PIF4 phytochrome-interacting factor 4
PIF7 phytochrome-interacting factor 7
PL phospholipid
PLDα1 phospholipase D alpha 1
PLDα2 phospholipase D alpha 2
PLDα3 phospholipase D alpha 3
PPC phosphatidylinositol phospholipase C
PS phosphatidylserine
R:FR red: far red ratio
WL white light
WL+FRWL+FR white light supplemented with far-red lightwhite light supplemented with far-red light
References
1. Shi, Y.; Yue, X.; An, L. Integrated regulation triggered by a cryophyte omega-3 desaturase gene confers multiple-stress tolerance in tobacco.J. Exp. Bot.2018,69, 2131–2148. [CrossRef] [PubMed]
2. Davy de Virville, J.; Brown, S.; Cochet, F.; Soler, M.N.; Hoffelt, M.; Ruelland, E.; Zachowski, A.; Collin, S.
Assessment of mitochondria as a compartment for phosphatidylinositol synthesis in Solanum tuberosum.
PPB2010,48, 952–960. [CrossRef] [PubMed]
3. Janda, T.; Gondor, O.K.; Yordanova, R.; Szalai, G.; Pál, M. Salicylic acid and photosynthesis: Signalling and effects.Physiol. Plant2014,36, 2537–2646. [CrossRef]
4. Zhu, J.Y.; Oh, E.; Wang, T.; Wang, Z.Y. TOC1-PIF4 interaction mediates the circadian gating of thermoresponsive growth in Arabidopsis.Nat. Commun.2016,7, 13692. [CrossRef] [PubMed]
5. Noren, L.; Kindgren, P.; Stachula, P.; Ruhl, M.; Eriksson, M.E.; Hurry, V.; Strand, A. Circadian and Plastid Signaling Pathways Are Integrated to Ensure Correct Expression of the CBF and COR Genes during Photoperiodic Growth.Plant Physiol.2016,171, 1392–1406. [PubMed]
6. Gierczik, K.; Novak, A.; Ahres, M.; Szekely, A.; Soltesz, A.; Boldizsar, A.; Gulyas, Z.; Kalapos, B.; Monostori, I.;
Kozma-Bognar, L.; et al. Circadian and Light Regulated Expression of CBFs and their Upstream Signalling Genes in Barley.Int. J. Mol. Sci.2017,18, 1828. [CrossRef]
7. Franklin, K.A.; Whitelam, G.C. Light-quality regulation of freezing tolerance in Arabidopsis thaliana.
Nat. Genet.2007,39, 1410–1413. [CrossRef]
8. Novak, A.; Boldizsar, A.; Adam, E.; Kozma-Bognar, L.; Majlath, I.; Baga, M.; Toth, B.; Chibbar, R.; Galiba, G.
Light-quality and temperature-dependent CBF14 gene expression modulates freezing tolerance in cereals.
J. Exp. Bot.2016,67, 1285–1295. [CrossRef]
9. Badawi, M.; Danyluk, J.; Boucho, B.; Houde, M.; Sarhan, F. The CBF gene family in hexaploid wheat and its relationship to the phylogenetic complexity of cereal CBFs.MGG2007,277, 533–554. [CrossRef]
10. Lee, C.M.; Thomashow, M.F. Photoperiodic regulation of the C-repeat binding factor (CBF) cold acclimation pathway and freezing tolerance in Arabidopsis thaliana.Proc. Natl. Acad. Sci. USA2012,109, 15054–15059.
[CrossRef]
11. Wang, F.; Guo, Z.; Li, H.; Wang, M.; Onac, E.; Zhou, J.; Xia, X.; Shi, K.; Yu, J.; Zhou, Y. Phytochrome A and B Function Antagonistically to Regulate Cold Tolerance via Abscisic Acid-Dependent Jasmonate Signaling.
Plant Phys.2016,170, 459–471. [CrossRef] [PubMed]
12. Shahid, M.; Cai, G.; Zu, F.; Zhao, Q.; Qasim, M.U.; Hong, Y.; Fan, C.; Zhou, Y. Comparative Transcriptome Analysis of Developing Seeds and Silique Wall Reveals Dynamic Transcription Networks for Effective Oil Production inBrassica napusL.Int. J. Mol. Sci.2019,20, 1982. [CrossRef] [PubMed]
13. He, M.; Qin, C.X.; Wang, X.; Ding, N.Z. Plant Unsaturated Fatty Acids: Biosynthesis and Regulation.
Front. Plant Sci.2020,11, 390. [CrossRef] [PubMed]
14. Francia, E.; Rizza, F.; Cattivelli, L.; Stanca, A.M.; Galiba, G.; Toth, B.; Hayes, P.M.; Skinner, J.S.; Pecchioni, N.
Two loci on chromosome 5H determine low-temperature tolerance in a ‘Nure’ (winter) x ‘Tremois’ (spring) barley map.TAG2004,108, 670–680. [CrossRef]
15. Miller, A.K.; Galiba, G.; Dubcovsky, J. A cluster of 11 CBF transcription factors is located at the frost tolerance locus Fr-Am2 in Triticum monococcum.MGG2006,275, 193–203.
16. Campoli, C.; Matus-Cadiz, M.A.; Pozniak, C.J.; Cattivelli, L.; Fowler, D.B. Comparative expression of Cbf genes in the Triticeae under different acclimation induction temperatures. MGG2009,282, 141–152.
[CrossRef]
17. Vagujfalvi, A.; Aprile, A.; Miller, A.; Dubcovsky, J.; Delugu, G.; Galiba, G.; Cattivelli, L. The expression of several Cbf genes at the Fr-A2 locus is linked to frost resistance in wheat.MGG2005,274, 506–514. [CrossRef]
18. Fricano, A.; Rizza, F.; Faccioli, P.; Pagani, D.; Pavan, P.; Stella, A.; Rossini, L.; Piffanelli, P.; Cattivelli, L. Genetic variants of HvCbf14 are statistically associated with frost tolerance in a European germplasm collection of Hordeum vulgare.TAG2009,119, 1335–1348. [CrossRef]
19. Soltesz, A.; Smedley, M.; Vashegyi, I.; Galiba, G.; Harwood, W.; Vagujfalvi, A. Transgenic barley lines prove the involvement of TaCBF14 and TaCBF15 in the cold acclimation process and in frost tolerance.J. Exp. Bot.
2013,64, 1849–1862. [CrossRef]
20. Dhillon, T.; Stockinger, E.J. Cbf14 copy number variation in the A, B, and D genomes of diploid and polyploid wheat.TAG2013,126, 2777–2789. [CrossRef]
21. Ahres, M.; Gierczik, K.; Boldizsar, A.; Vitamvas, P.; Galiba, G. Temperature and Light-Quality-Dependent Regulation of Freezing Tolerance in Barley.Plants2020,9, 83. [CrossRef] [PubMed]
22. Novak, A.; Boldizsar, A.; Gierczik, K.; Vagujfalvi, A.; Adam, E.; Kozma-Bognar, L.; Galiba, G. Light and Temperature Signalling at the Level of CBF14 Gene Expression in Wheat and Barley.Plant Mol. Biol. Rep.
2017,35, 399–408. [CrossRef] [PubMed]
23. Okazaki, Y.; Saito, K. Roles of lipids as signaling molecules and mitigators during stress response in plants.
Plant J. Cell Mol. Biol.2014,79, 584–596. [CrossRef] [PubMed]
24. Barrero-Sicilia, C.; Silvestre, S.; Haslam, R.P.; Michaelson, L.V. Lipid remodelling: Unravelling the response to cold stress in Arabidopsis and its extremophile relative Eutrema salsugineum.Plant Sci.2017,263, 194–200.
[CrossRef] [PubMed]
25. Xiong, L.; Schumaker, K.S.; Zhu, J.K. Cell signaling during cold, drought, and salt stress.Plant Cell2002,14, S165–S183. [CrossRef]
26. Di Paolo, G.; De Camilli, P. Phosphoinositides in cell regulation and membrane dynamics.Nature2006,443, 651–657. [CrossRef]
27. Doherty, C.J.; Van Buskirk, H.A.; Myers, S.J.; Thomashow, M.F. Roles for Arabidopsis CAMTA transcription factors in cold-regulated gene expression and freezing tolerance.Plant Cell2009,21, 972–984. [CrossRef]
28. Michaelson, L.V.; Napier, J.A.; Molino, D.; Faure, J.D. Plant sphingolipids: Their importance in cellular organization and adaption.Biochim. Biophys.2016,1861, 1329–1335. [CrossRef]
29. Markham, J.E. Detection and quantification of plant sphingolipids by LC-MS.Methods Mol. Biol.2013,1009, 93–101.
30. Blaas, N.; Humpf, H.U. Structural profiling and quantitation of glycosyl inositol phosphoceramides in plants with Fourier transform mass spectrometry.J. Agric. Food Chem.2013,61, 4257–4269. [CrossRef]
31. Bure, C.; Cacas, J.L.; Wang, F.; Gaudin, K.; Domergue, F.; Mongrand, S.; Schmitter, J.M. Fast screening of highly glycosylated plant sphingolipids by tandem mass spectrometry.Rapid Commun. MS RCM2011,25, 3131–3145. [CrossRef] [PubMed]
32. Berkey, R.; Bendigeri, D.; Xiao, S. Sphingolipids and plant defense/disease: The “death” connection and beyond.Front. Plant Sci.2012,3, 68. [CrossRef] [PubMed]
33. Markham, J.E.; Lynch, D.V.; Napier, J.A.; Dunn, T.M.; Cahoon, E.B. Plant sphingolipids: Function follows form.Curr. Opin. Plant Biol.2013,16, 350–357. [CrossRef] [PubMed]
34. Pata, M.O.; Hannun, Y.A.; Ng, C.K. Plant sphingolipids: Decoding the enigma of the Sphinx.New Phytol.
2010,185, 611–630. [CrossRef]
35. Sperling, P.; Heinz, E. Plant sphingolipids: Structural diversity, biosynthesis, first genes and functions.
Biochim. Biophys.2003,1632, 1–15. [CrossRef]
36. Dunn, T.M.; Lynch, D.V.; Michaelson, L.V.; Napier, J.A. A post-genomic approach to understanding sphingolipid metabolism in Arabidopsis thaliana.Ann. Bot.2004,93, 483–497. [CrossRef]
37. Chao, D.Y.; Gable, K.; Chen, M.; Baxter, I.; Dietrich, C.R.; Cahoon, E.B.; Guerinot, M.L.; Lahner, B.; Lu, S.;
Markham, J.E.; et al. Sphingolipids in the root play an important role in regulating the leaf ionome in Arabidopsis thaliana.Plant Cell2011,23, 1061–1081. [CrossRef]
38. Chen, M.; Markham, J.E.; Dietrich, C.R.; Jaworski, J.G.; Cahoon, E.B. Sphingolipid long-chain base hydroxylation is important for growth and regulation of sphingolipid content and composition in Arabidopsis.
Plant Cell2008,20, 1862–1878. [CrossRef]
39. Chen, M.; Markham, J.E.; Cahoon, E.B. Sphingolipid Delta8 unsaturation is important for glucosylceramide biosynthesis and low-temperature performance in Arabidopsis.Plant J.2012,69, 769–781. [CrossRef]
40. Markham, J.E.; Molino, D.; Gissot, L.; Bellec, Y.; Hematy, K.; Marion, J.; Belcram, K.; Palauqui, J.C.;
Satiat-Jeunemaitre, B.; Faure, J.D. Sphingolipids containing very-long-chain fatty acids define a secretory pathway for specific polar plasma membrane protein targeting in Arabidopsis.Plant Cell2011,23, 2362–2378.
[CrossRef]
41. Saucedo-Garcia, M.; Gonzalez-Solis, A.; Rodriguez-Mejia, P.; Olivera-Flores Tde, J.; Vazquez-Santana, S.;
Cahoon, E.B.; Gavilanes-Ruiz, M. Reactive oxygen species as transducers of sphinganine-mediated cell death pathway.Plant Signal. Behav.2011,6, 1616–1619. [CrossRef] [PubMed]
42. Wang, W.; Yang, X.; Tangchaiburana, S.; Ndeh, R.; Markham, J.E.; Tsegaye, Y.; Dunn, T.M.; Wang, G.L.;
Bellizzi, M.; Parsons, J.F.; et al. An inositolphosphorylceramide synthase is involved in regulation of plant programmed cell death associated with defense in Arabidopsis.Plant Cell2008,20, 3163–3179. [CrossRef]
[PubMed]
43. Falcone, D.L.; Ogas, J.P.; Somerville, C.R. Regulation of membrane fatty acid composition by temperature in mutants of Arabidopsis with alterations in membrane lipid composition.BMC2004,4, 17.
44. Wang, X.; Devaiah, S.P.; Zhang, W.; Welti, R. Signaling functions of phosphatidic acid.Prog. Lipid Res.2006, 45, 250–278. [CrossRef]
45. Li, H.X.; Xiao, Y.; Cao, L.L.; Yan, X.; Li, C.; Shi, H.Y.; Wang, J.W.; Ye, Y.H. Cerebroside C increases tolerance to chilling injury and alters lipid composition in wheat roots.PLoS ONE2013,8, e73380. [CrossRef] [PubMed]