Edited by:
Herman Waldmann, University of Oxford, United Kingdom
Reviewed by:
Phillip E. Melton, Curtin University, Australia Angelo A. Manfredi, Università Vita-Salute San Raffaele, Italy
*Correspondence:
Nandor Gabor Than than.gabor@ttk.mta.hu;
Roberto Romero prbchiefstaff@med.wayne.edu;
Zoltan Papp pzorvosihetilap@maternity.hu
Specialty section:
This article was submitted to Immunological Tolerance and Regulation, a section of the journal Frontiers in Immunology Received: 28 February 2018 Accepted: 04 July 2018 Published: 08 August 2018 Citation:
Than NG, Romero R, Tarca AL, Kekesi KA, Xu Y, Xu Z, Juhasz K, Bhatti G, Leavitt RJ, Gelencser Z, Palhalmi J, Chung TH, Gyorffy BA, Orosz L, Demeter A, Szecsi A, Hunyadi-Gulyas E, Darula Z, Simor A, Eder K, Szabo S, Topping V, El-Azzamy H, LaJeunesse C, Balogh A, Szalai G, Land S, Torok O, Dong Z, Kovalszky I, Falus A, Meiri H, Draghici S, Hassan SS, Chaiworapongsa T, Krispin M, Knöfler M, Erez O, Burton GJ, Kim CJ, Juhasz G and Papp Z (2018) Integrated Systems Biology Approach Identifies Novel Maternal and Placental Pathways of Preeclampsia.
Front. Immunol. 9:1661.
doi: 10.3389/fimmu.2018.01661
integrated systems Biology approach identifies novel
Maternal and Placental Pathways of Preeclampsia
Nandor Gabor Than1,2,3,4,5,6*, Roberto Romero1,2,7,8,9*, Adi Laurentiu Tarca1,2,3,10, Katalin Adrienna Kekesi11, Yi Xu1,2, Zhonghui Xu1,2,12, Kata Juhasz4, Gaurav Bhatti1,2, Ron Joshua Leavitt13, Zsolt Gelencser4, Janos Palhalmi4, Tzu Hung Chung13, Balazs Andras Gyorffy11, Laszlo Orosz14, Amanda Demeter4, Anett Szecsi4,
Eva Hunyadi-Gulyas15, Zsuzsanna Darula15, Attila Simor11, Katalin Eder16, Szilvia Szabo4,17, Vanessa Topping1,2, Haidy El-Azzamy1,2, Christopher LaJeunesse1,2, Andrea Balogh1,2,4, Gabor Szalai1,2,4, Susan Land9, Olga Torok14, Zhong Dong1,2, Ilona Kovalszky6,
Andras Falus16, Hamutal Meiri18, Sorin Draghici9,19, Sonia S. Hassan1,2,3,20,
Tinnakorn Chaiworapongsa1,2,3, Manuel Krispin13, Martin Knöfler21, Offer Erez1,2,3,22, Graham J. Burton23, Chong Jai Kim1,2,24,25, Gabor Juhasz11 and Zoltan Papp5*
1 Perinatology Research Branch, Eunice Kennedy Shriver National Institute of Child Health and Human Development, National Institutes of Health, United States Department of Health and Human Services, Bethesda, MD, United States, 2 Perinatology Research Branch, Eunice Kennedy Shriver National Institute of Child Health and Human Development, National Institutes of Health, United States Department of Health and Human Services, Detroit, MI, United States, 3 Department of Obstetrics and Gynecology, Wayne State University School of Medicine, Detroit, MI, United States, 4 Systems Biology of Reproduction Lendulet Research Group, Institute of Enzymology, Research Centre for Natural Sciences, Hungarian Academy of Sciences, Budapest, Hungary, 5 Maternity Private Department, Kutvolgyi Clinical Block, Semmelweis University, Budapest, Hungary,
6 First Department of Pathology and Experimental Cancer Research, Semmelweis University, Budapest, Hungary,
7 Department of Obstetrics and Gynecology, University of Michigan, Ann Arbor, MI, United States, 8 Department of Epidemiology and Biostatistics, Michigan State University, East Lansing, MI, United States, 9 Center for Molecular Medicine and Genetics, Wayne State University, Detroit, MI, United States, 10 Department of Computer Science, College of Engineering, Wayne State University, Detroit, MI, United States, 11 Laboratory of Proteomics, Department of Physiology and Neurobiology, ELTE Eotvos Lorand University, Budapest, Hungary, 12 Channing Division of Network Medicine, Brigham and Women’s Hospital, Harvard University, Boston, MA, United States, 13 Zymo Research Corporation, Irvine, CA, United States,
14 Department of Obstetrics and Gynaecology, University of Debrecen, Debrecen, Hungary, 15 Institute of Biochemistry, Biological Research Centre, Hungarian Academy of Sciences, Szeged, Hungary, 16 Department of Genetics, Cell and Immunobiology, Semmelweis University, Budapest, Hungary, 17 Department of Morphology and Physiology, Semmelweis University, Budapest, Hungary, 18 TeleMarpe Ltd, Tel Aviv, Israel, 19 Department of Clinical and Translational Science, Wayne State University, Detroit, MI, United States, 20 Department of Physiology, Wayne State University School of Medicine, Detroit, MI, United States, 21 Department of Obstetrics and Gynecology, Medical University of Vienna, Vienna, Austria, 22 Department of Obstetrics and Gynecology, Soroka University Medical Center School of Medicine, Faculty of Health Sciences, Ben-Gurion University of the Negev, Beer Sheva, Israel, 23 Centre for Trophoblast Research, Department of Physiology, Development and Neuroscience, University of Cambridge, Cambridge, United Kingdom, 24 Department of Pathology, Wayne State University School of Medicine, Detroit, MI, United States, 25 Department of Pathology, Asan Medical Center, University of Ulsan, Seoul, South Korea
Preeclampsia is a disease of the mother, fetus, and placenta, and the gaps in our under- standing of the complex interactions among their respective disease pathways preclude successful treatment and prevention. The placenta has a key role in the pathogenesis of the terminal pathway characterized by exaggerated maternal systemic inflammation, generalized endothelial damage, hypertension, and proteinuria. This sine qua non of pre- eclampsia may be triggered by distinct underlying mechanisms that occur at early stages of pregnancy and induce different phenotypes. To gain insights into these molecular
pathways, we employed a systems biology approach and integrated different “omics,”
clinical, placental, and functional data from patients with distinct phenotypes of pre- eclampsia. First trimester maternal blood proteomics uncovered an altered abundance of proteins of the renin-angiotensin and immune systems, complement, and coagulation cascades in patients with term or preterm preeclampsia. Moreover, first trimester mater- nal blood from preterm preeclamptic patients in vitro dysregulated trophoblastic gene expression. Placental transcriptomics of women with preterm preeclampsia identified distinct gene modules associated with maternal or fetal disease. Placental “virtual” liquid biopsy showed that the dysregulation of these disease gene modules originates during the first trimester. In vitro experiments on hub transcription factors of these gene mod- ules demonstrated that DNA hypermethylation in the regulatory region of ZNF554 leads to gene down-regulation and impaired trophoblast invasion, while BCL6 and ARNT2 up-regulation sensitizes the trophoblast to ischemia, hallmarks of preterm preeclampsia.
In summary, our data suggest that there are distinct maternal and placental disease pathways, and their interaction influences the clinical presentation of preeclampsia. The activation of maternal disease pathways can be detected in all phenotypes of preeclamp- sia earlier and upstream of placental dysfunction, not only downstream as described before, and distinct placental disease pathways are superimposed on these maternal pathways. This is a paradigm shift, which, in agreement with epidemiological studies, warrants for the central pathologic role of preexisting maternal diseases or perturbed maternal–fetal–placental immune interactions in preeclampsia. The description of these novel pathways in the “molecular phase” of preeclampsia and the identification of their hub molecules may enable timely molecular characterization of patients with distinct preeclampsia phenotypes.
Keywords: inflammation, ischemia, liquid biopsy, omics, placenta, pregnancy, systems biology, trophoblast invasion
inTrODUcTiOn
Preeclampsia, one of the most severe obstetrical complications affecting 5–8% of pregnant women (1–5), is a leading cause of maternal (4–15) and perinatal morbidity and mortality (6, 16–18). In addition, pathologic changes in the affected mothers and fetuses lead to a higher risk of subsequent metabolic and cardiovascular diseases later in life (8, 9, 11, 13, 19–23), further increasing healthcare costs. In spite of the severity of the problem, there is yet no early diagnosis of all forms of preeclampsia, and the current therapy is still based on the delivery of the placenta (2, 24), given the complexity of the disease and the lack of insight into the early perturbed molecular pathways.
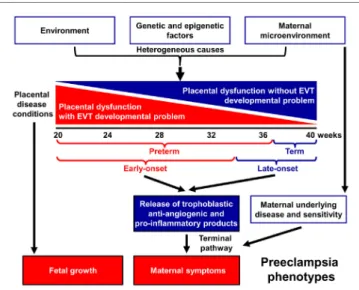
Indeed, preeclampsia is a syndrome with heterogeneous etiol- ogy and a spectrum of phenotypes (Figure 1). It may affect women at varying gestational ages with different degrees of severity and consequences for the fetus (2, 25–31). The current classifications of preeclampsia are based upon its severity and the timing of clinical presentation, mostly dividing preeclampsia into preterm (<37 weeks) or term (≥37 weeks) and early-onset (<34 weeks) or late-onset (≥34 weeks) phenotypes (24, 26, 32–36). Preterm preeclampsia has a more severe clinical presentation and is often accompanied by fetal growth restriction compared to term preec- lampsia (2, 25, 26, 29). However, severe maternal disease and fetal growth restriction may be observed in both term and preterm
preeclampsia, and their presentation may not be associated with each other, suggesting that the clinical phenotype is the result of an interplay between various factors and disease pathways, also supported by observations in animal models (37).
A growing body of evidence offers support for the conclusion that the maldevelopment and/or dysfunction of distinct trophoblast lineages of the placenta have a central role in the pathogenesis of preeclampsia, and that the severity of the placental disease is sub- sequently reflected in the clinical phenotype of this syndrome. In the preclinical stage, extravillous trophoblast (EVT) development may be impaired, leading to EVT dysfunction, shallow trophoblast invasion, failure of the physiological transformation of the maternal spiral arteries, abnormal blood-flow to the placenta, and histologi- cal changes consistent with maternal vascular malperfusion (28, 30, 38–43). The frequency and severity of these lesions decrease from the preterm toward the term phenotype of preeclampsia (28, 33, 44–46) (Figure 1), mirrored by the decreasing prevalence of fetal growth restriction or the delivery of small-for-gestational age (SGA) neonates (47–53). Thus, EVT development is less frequently and extensively affected in late-onset preeclampsia, which consti- tutes about 90% of all cases (50, 54, 55).
In preterm preeclampsia, failure of the remodeling of the spiral arteries may lead to abnormal blood flow to the placenta and subsequently to placental structural damage and ischemic stress, villous trophoblast (VT) dysfunction and the release of
FigUre 1 | Pathogenesis of preeclampsia. Preeclampsia is a syndrome with heterogeneous etiology and a spectrum of phenotypes. It may appear at varying gestational ages with different degrees of severity and involvement of the fetus. Preterm, especially early-onset preeclampsia generally has a more severe clinical presentation in the mother and is more often associated with the delivery of a growth-restricted neonate than term or late-onset preeclampsia. It is a multi-stage disease with the maldevelopment and/or dysfunction of distinct trophoblast lineages of the placenta at the center of the disease. Villous and extravillous trophoblast (EVT) development and/or function may be impaired in the preclinical stage, most extensively in preterm preeclampsia associated with fetal growth restriction. The resulting abnormal maternal spiral artery remodeling, fluctuating blood-flow, and ischemic stress lead to placental histological changes and the release of harmful substances from the placenta. As a consequence, the terminal pathway of preeclampsia, an exaggerated maternal systemic inflammatory and anti-angiogenic condition, occurs. The frequency and severity of placental developmental problems continuously decrease with advancing gestational age. In term forms, other stressors than maternal vascular malperfusion and placental ischemia may trigger placental stress, trophoblastic dysfunction, and the induction of the terminal pathway. Alternatively, the maternal endothelium may have an exaggerated sensitivity to factors released from a relatively normal placenta.
detrimental placental substances (e.g. anti-angiogenic factors, pro-inflammatory cytokines, and syncytiotrophoblast debris) into the maternal circulation (40, 41, 43, 56–66). As a conse- quence, the terminal pathway of preeclampsia, featuring an anti-angiogenic state and exaggerated maternal systemic inflam- mation, occurs in most cases, and its intensity correlates with the severity of preeclampsia, which may be coupled with damage to the maternal endothelium and to the kidneys, liver, and central nervous system during the clinical phase (21, 42, 43, 64, 67–72).
VT development can also be impaired in preeclampsia (73–75), especially in the preterm form associated with SGA, where VT turnover is affected together with morphometric features (73, 76).
Term preeclampsia is characterized by a lesser magnitude of maternal systemic inflammatory and anti-angiogenic states (30, 37, 55–57, 61, 62, 77–92). This phenotype may result from different stressors other than maternal vascular malperfusion and ischemia of the placenta, which include various preexisting maternal disorders, such as obesity, chronic hypertension, diabe- tes, and metabolic, kidney, and autoimmune diseases (25, 93, 94).
These stressors may still trigger placental stress and VT
dysfunction (31, 91) and induce a maternal pro-inflammatory milieu. Alternatively, maternal endothelial dysfunction may result from an exaggerated sensitivity to factors released from the placenta (21, 25, 31, 95), which increases the risk of preeclampsia upon maternal genetic predisposition for cardiovascular disease (96, 97). Indeed, preeclampsia has a genetic predisposition with high heritability of both phenotypes, and it shares common risk alleles with coronary artery disease (98–104).
In spite of extensive research efforts, our understanding of the early pathologic pathways of preeclampsia has been limited given several obstacles. First, the complexity of the disease pathways and the heterogeneity of the syndrome have not been investigated in an integrative manner in both maternal and placental com- partments throughout pregnancy. Second, it has been impossible to investigate the early placental disease pathways because of the invasive nature of placental biopsy and the limited information on placental functions obtained non-invasively. Consequently, an increasing number of high-dimensional studies aiming to detect molecular signatures of preeclampsia either in the placenta or in maternal blood have mostly targeted later stages of pregnancy, at a more advanced stage of placental development and pathology (105–143). Third, animal models of preeclampsia fail to mimic early placental pathways of preeclampsia due to the anatomical and physiological uniqueness of deep placentation in humans (144–147). Fourth, in vitro studies on human placental develop- ment and trophoblast functions are hindered by the lack of self- replicating trophoblast stem cells with the ability to differentiate into both VTs and EVTs (148–150).
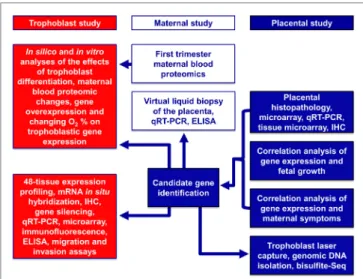
Here, we used a systems biology approach that integrated various omics and targeted methods to investigate both placental and maternal compartments and most aspects of preeclampsia, including placental disease; fetal and maternal outcomes; envi- ronmental, maternal, microenvironmental, and epigenetic fac- tors; and trophoblastic functions. In the first placental study, we performed extensive investigations of the placenta at histologic, transcriptomic, epigenetic, and protein levels to target molecular pathways at the center of the disease. Molecular changes were correlated with maternal and neonatal morbidities associated with preeclampsia to uncover placental pathways affecting either maternal or fetal wellbeing. In the second, maternal study, we employed maternal blood proteomics and “virtual” liquid biopsy of the placenta to reveal blood factors of maternal or placental origin that can reflect disease conditions in early pregnancy. In the third, trophoblast study, we utilized in vitro functional assays on the trophoblast to investigate hub transcription factors at the center of placental disease gene modules and to model their in vivo involvement in placental pathways associated with mater- nal or placental/fetal disease (Figure 2).
resUlTs
Placental study
Alterations in the Placental Transcriptome in Preterm Preeclampsia
Given that the pathogenesis of preeclampsia has been implicated to originate from the placenta, we first aimed to investigate pla- cental transcriptomic changes leading to placental dysfunction
TaBle 1 | Demographics of Hungarian women included in the placental microarray study.
groups controls for preterm Pe (n = 5)
Preterm Pe (n = 12) Maternal age (years)b 31.6 (31.5–34.3) 30.3 (26.1–35)
Primiparitya 40 66.7
Gestational age (weeks)b 31.0 (30.9–34.0) 31.2 (29.3–33.2) Racea
Caucasian 100 100
African-American 0 0
Other 0 0
Systolic BP (mmHg)b 120 (120–120) 163 (160–170)c
Diastolic BP (mmHg)b 80 (70–80) 100 (100–101)c
Proteinuriaa 0 100c
Birthweight (g)b 1,990 (1,640–2,210) 1,065 (990–1,420)
Cesarean deliverya 100 100
BP, blood pressure; PE, preeclampsia.
aPercentage.
bMedian (interquartile range).
cp < 0.01.
FigUre 2 | Flow-chart of experimental procedures. The placental study included extensive histologic, transcriptomic, epigenetic, and protein level investigations of the placenta to target the molecular pathways in the center of disease. Molecular changes were correlated with disease outcomes in both mothers and babies to uncover placental pathways affecting either maternal or fetal wellbeing. The maternal study included first trimester maternal blood proteomics and “virtual” liquid biopsy of the placenta to reveal blood factors of maternal or placental origin that can reflect disease conditions in early pregnancy. In the trophoblast study, hub transcription factors in placental gene modules separately associated with maternal or placental/fetal disease were investigated with various in vitro methods to model in vivo disease pathways.
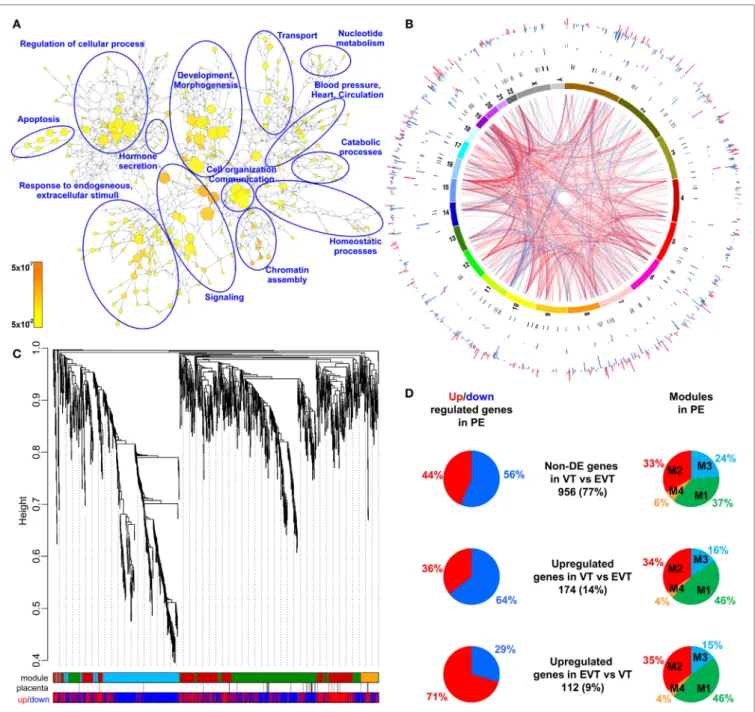
as well as regulatory networks involved in the pathologic pathways. The combined analysis of preterm preeclampsia cases and gestational age-matched controls (n = 17) in a Hungarian patient population (Table 1) in our placental microarray data (132) revealed 1,409 differentially expressed (DE) genes (Data S1 in Supplementary Material), which are involved in fundamental cellular processes, including blood pressure (BP) regulation, apoptosis, development, hormone secretion, metabolism, homeostasis, and signaling (Figure 3A). DE genes included 137 transcription regulatory genes and 38 predominantly placenta- expressed genes. This latter set of genes (n = 164, Data S2 in Supplementary Material), which was defined by BioGPS micro- array data (n = 153) or expression data from separate studies in the lack of BioGPS data (n = 11) (151–153), was enriched among DE genes in preeclampsia [odds ratio (OR) = 3.4, p = 6.9 × 10⁻⁹]. This suggests that genes predominantly expressed by the placenta have pathologic and diagnostic significance in preeclampsia, a phenomenon indicated earlier by our targeted studies (153–155).
Subsequently, we investigated the genomic links among DE genes by searching for genomic regions associated with the observed placental transcriptomic changes. We found that Chr6 (OR = 1.54, q = 1.6 × 10⁻³) and Chr7 (OR = 1.42, q = 0.02) were particularly affected by these gene expression changes (Data S3 in Supplementary Material), while Chr19 (OR = 2.6, q = 0.02) was enriched in dysregulated transcription regulatory genes (Data S4 in Supplementary Material). Of interest, predominantly placenta-expressed genes were also enriched on Chr19 (OR = 2.5,
q = 0.002) (Data S5 in Supplementary Material). Figure 3B shows the non-random genomic localization of DE genes in preterm preeclampsia and the pronounced gene dysregulation associated with Chr19. These results are consistent with the fact that Chr19 harbors large transcription regulatory gene families (156), and probably reflect its regulatory role in placental/trophoblastic gene expression and their dysregulation in preeclampsia.
Alterations in Biological Processes and Regulatory Networks in Preterm Preeclampsia
Next, we aimed to identify functional links among DE genes by identifying gene co-expression network modules and hub tran- scription regulatory genes driving differential expression in the modules. Weighted co-expression network analysis (WGCNA) was conducted among DE genes resulting in the assignment of these into four major modules, labeled as M1 (green, n = 506), M2 (red, n = 442), M3 (blue, n = 381), and M4 (orange, n = 74) (Figure 3C; Data S1 in Supplementary Material). Most predomi- nantly placenta-expressed genes belonged to modules M1 (n = 22 genes) and M2 (n = 12). Module M1 was enriched in down- regulated genes (OR = 1.88, p = 2.59 × 10⁻⁸), while module M2 was enriched in up-regulated genes (OR = 6.47, p = 2.2 × 10⁻¹⁶), suggesting the presence of distinct dysregulated gene-networks.
Genes with predominant VT expression (14%) were mainly down-regulated, while genes with predominant EVT expression (9%) were mainly up-regulated even though both sets had the most members in module M1 (Figure 3D). These data suggested that the functions of both VT and EVT are strongly impacted in preterm preeclampsia, albeit in different ways.
Predominantly placenta-expressed genes, down-regulated in module M1, are regulators of fetal growth (CSH1, HSD11B2) (157, 158), metabolism (ESRRG) (159), estrogen synthesis (HSD17B1) (160), and immune functions (LGALS14) (153), some of which were reported to be down-regulated in preeclampsia (30, 91, 130, 155, 161, 162). Within this module, ESRRG, POU5F1, and ZNF554 transcription regulatory genes had the highest number of signifi- cant correlations with predominantly placenta-expressed genes
FigUre 3 | Placental transcriptomic changes in preterm preeclampsia. (a) The network of biological processes enriched among differentially expressed (DE) genes.
Circle sizes relate to the number of genes involved in the biological processes; colors refer to p-values according to the color code. Groups of the most enriched biological processes were circled and labeled. (B) Circos visualization of DE genes in preterm preeclampsia (PE). The inner circle shows chromosomes; curved lines represent correlation (red: positive; blue: negative) between transcription regulatory genes and their targets; the second circle shows genomic location of predominantly placenta-expressed genes (black lines: non-DE; red or blue lines: up- or down-regulated); third and fourth circles show the locations of DE
transcription regulatory genes and their targets, respectively with blue (down-regulated) and red (up-regulated) bars. The height of the bars represents the magnitude of expression changes. (c) Dysregulated placental gene expression was characterized by four major disease gene modules within DE genes, marked with different colors. The height plotted on the y-axis represents distance metric. Of 38 predominantly placenta-expressed genes (black vertical lines), 33 belonged to the M1 (green, n = 22) and M2 (red, n = 11) modules. These modules were enriched in predominantly placenta-expressed genes and enriched in up-regulated (M2) or down-regulated (M1) genes marked under the modules with red or blue lines, respectively. (D) Pie charts depict the distribution of three gene sets among dysregulated genes or gene modules. Genes with similar expression in villous (VT) and extravillous trophoblast (EVT) had similar distribution among up- or down-regulated genes and in modules M1 and M2. Genes with up-regulation in VT compared to EVT were predominantly down-regulated in preeclampsia and positioned in module M1. Genes with up-regulation in EVT compared to VT were predominantly up-regulated in preeclampsia and positioned also in module M1.
and, hence, deemed as hub factors (Figure S1A in Supplementary Material). Of note, these transcription factors have been impli- cated in the regulation of stemness and differentiation (163, 164),
pointing to the possible involvement of module M1 in the dys- regulation of trophoblast differentiation in preterm preeclampsia.
We selected ZNF554 for functional studies, since it belongs to the
TaBle 2 | Demographics of American women included in the placental validation study.
groups controls for preterm Pe
(n = 20) Preterm Pe
(n = 20) Preterm Pe with sga (n = 20)
Maternal age (years)b 22 (20–28.5) 23.5 (21–27) 22.5 (19.5–30)
Primiparitya 20 40 25
Gestational age (weeks)b 32.3 (28.2–34.9) 31.4 (29.6–33.6) 31.8 (29.7–34.4)
Racea
Caucasian 5 10 10
African-American 95 90 90
Other 0 0 0
Systolic BP (mmHg)b 116 (110–125) 177 (166–187)c 171 (164–189)c
Diastolic BP (mmHg)b 65 (59–71) 105 (103–111)c 108 (94–118)c
Proteinuriab 0 3 (2–3)c 3 (3–3)c
Birthweight (g)b 1,635 (1,075–2,715) 1,488 (1,050–1,908) 1,173 (908-1,650)d
Birthweight percentileb 40.5 (31.9–53.4) 22.7 (18.3–32.9)d 6.7 (1–8.6)c
Cesarean deliverya 45 80d 75
groups controls for term
Pe (n = 20) Term Pe
(n = 10) Term Pe with sga
(n = 10)
Maternal age (years)b 22 (21–32) 19 (19–35) 26.5 (19–31)
Primiparitya 15 40 10
Gestational age (weeks)b 38.6 (38–39.1) 39.1 (38.6–39.6) 38.4 (37.3–38.9)
Racea
Caucasian 15 0 0
African-American 80 100 100
Other 5 0 0
Systolic BP (mmHg)b 121 (111–134) 173 (165–178)c 169 (164–190)c
Diastolic BP (mmHg)b 70 (64–73) 106 (102–110)c 102 (97–104)c
Proteinuriab 0 3 (1–3)c 3 (1–3)c
Birthweight (g)b 3,215 (3,110–3,335) 3,123 (2,990–3,200) 2,405 (2,205–2,555)c
Birthweight percentileb 46 (37.2–63) 37.1 (28.5–48.8) 1.1 (1–3.5)c
Cesarean deliverya 55 40 20
BP, blood pressure; PE, preeclampsia; SGA, small-for-gestational age.
aPercentage.
bMedian (interquartile range).
cp < 0.001.
dp < 0.05.
KRAB zinc finger family, crucial for early embryonic develop- ment and differentiation (165), and it may regulate genes in its co-expression network involved in biological processes affected by preeclampsia, such as development, chromatin assembly, signaling, adhesion, migration, and metabolism (Figure S1B in Supplementary Material).
In module M2, FLT1, which expresses sFlt-1, the main driver of BP elevation in the terminal pathway of preeclampsia (56, 90), was up-regulated. Moreover, module M2 genes were strongly overrepresented (OR = 29.9, p = 6.54 × 10−95) among genes that had correlated expression with mean arterial pressure (MAP) (Data S6 in Supplementary Material), suggesting a key role for this module in promoting hypertension. Within this module, BCL6, BHLHE40, and ARNT2 had the highest correlation in gene expression with predominantly placenta-expressed genes, including FLT1 (Figure S1A in Supplementary Material). Of note, these transcription regulatory hub genes are involved in hypoxia response. ARNT2 heterodimerizes with hypoxia-response regula- tor HIF-1α that is involved in trophoblast invasion and the patho- genesis of preeclampsia (166–169), and ARNT2 is a key regulator for adaption to hypoxic conditions at high altitudes, where the incidence of preeclampsia is much higher (16%) than at low alti- tude (170, 171). BHLHE40 links immune and hypoxia-induced pathways (172). BCL6, a gene previously found to be up-regulated
in the placenta in preterm preeclampsia, represses trophoblast differentiation and is regulated by stress-activated protein kinase signaling pathways (135, 173, 174). Our co-expression analysis revealed an enrichment of biological processes, such as dif- ferentiation, apoptosis, metabolism, signaling, and responses to stimuli including oxygen among genes co-expressed with BCL6 (Figure S1C in Supplementary Material). Since BCL6 is a key player in inflammation and oxygen-driven regulation of cell fate, we selected this gene for functional studies along with ARNT2.
The Association of Gene Modules With Clinical Parameters
Next, to validate the microarray results on a larger patient popula- tion (n = 100) comprised mostly of subjects of African-American origin presenting various phenotypes of preeclampsia (Table 2;
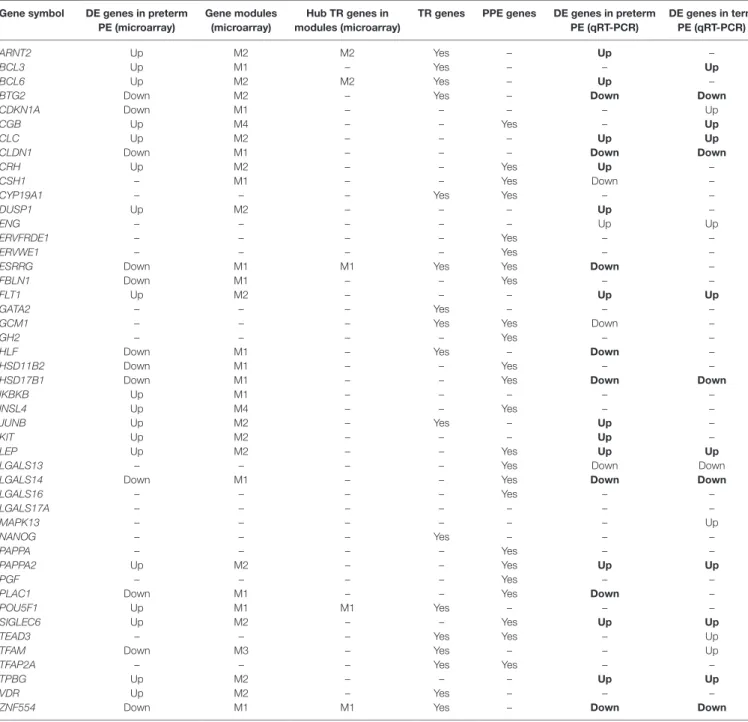
Figure S2 in Supplementary Material), we selected 47 genes for qRT-PCR profiling of 100 placentas (Table 3), provided these genes were: (1) dysregulated genes with predominant placental and syncytiotrophoblastic expression, potentially encoding biomark- ers; (2) dysregulated hub transcription regulatory genes that had a high co-expression with dysregulated, predominantly placenta- expressed genes in modules M1 and M2; and (3) non-dysregulated genes with roles in trophoblast differentiation, trophoblast-specific gene expression, or the pathogenesis of preeclampsia.
TaBle 3 | Genes included in the placental qRT-PCR validation study.
gene symbol De genes in preterm Pe (microarray)
gene modules (microarray)
hub Tr genes in modules (microarray)
Tr genes PPe genes De genes in preterm Pe (qrT-Pcr)
De genes in term Pe (qrT-Pcr)
ARNT2 Up M2 M2 Yes – Up –
BCL3 Up M1 – Yes – – Up
BCL6 Up M2 M2 Yes – Up –
BTG2 Down M2 – Yes – Down Down
CDKN1A Down M1 – – – – Up
CGB Up M4 – – Yes – Up
CLC Up M2 – – – Up Up
CLDN1 Down M1 – – – Down Down
CRH Up M2 – – Yes Up –
CSH1 – M1 – – Yes Down –
CYP19A1 – – – Yes Yes – –
DUSP1 Up M2 – – – Up –
ENG – – – – – Up Up
ERVFRDE1 – – – – Yes – –
ERVWE1 – – – – Yes – –
ESRRG Down M1 M1 Yes Yes Down –
FBLN1 Down M1 – – Yes – –
FLT1 Up M2 – – – Up Up
GATA2 – – – Yes – – –
GCM1 – – – Yes Yes Down –
GH2 – – – – Yes – –
HLF Down M1 – Yes – Down –
HSD11B2 Down M1 – – Yes – –
HSD17B1 Down M1 – – Yes Down Down
IKBKB Up M1 – – – – –
INSL4 Up M4 – – Yes – –
JUNB Up M2 – Yes – Up –
KIT Up M2 – – – Up –
LEP Up M2 – – Yes Up Up
LGALS13 – – – – Yes Down Down
LGALS14 Down M1 – – Yes Down Down
LGALS16 – – – – Yes – –
LGALS17A – – – – – – –
MAPK13 – – – – – – Up
NANOG – – – Yes – – –
PAPPA – – – – Yes – –
PAPPA2 Up M2 – – Yes Up Up
PGF – – – – Yes – –
PLAC1 Down M1 – – Yes Down –
POU5F1 Up M1 M1 Yes – – –
SIGLEC6 Up M2 – – Yes Up Up
TEAD3 – – – Yes Yes – Up
TFAM Down M3 – Yes – – Up
TFAP2A – – – Yes Yes – –
TPBG Up M2 – – – Up Up
VDR Up M2 – Yes – – –
ZNF554 Down M1 M1 Yes – Down Down
PE, preeclampsia; DE, differentially expressed; TR, transcription regulatory; PPE, predominantly placenta-expressed.
Identical dysregulation in the validation cohort as in the microarray cohort is depicted in bold font.
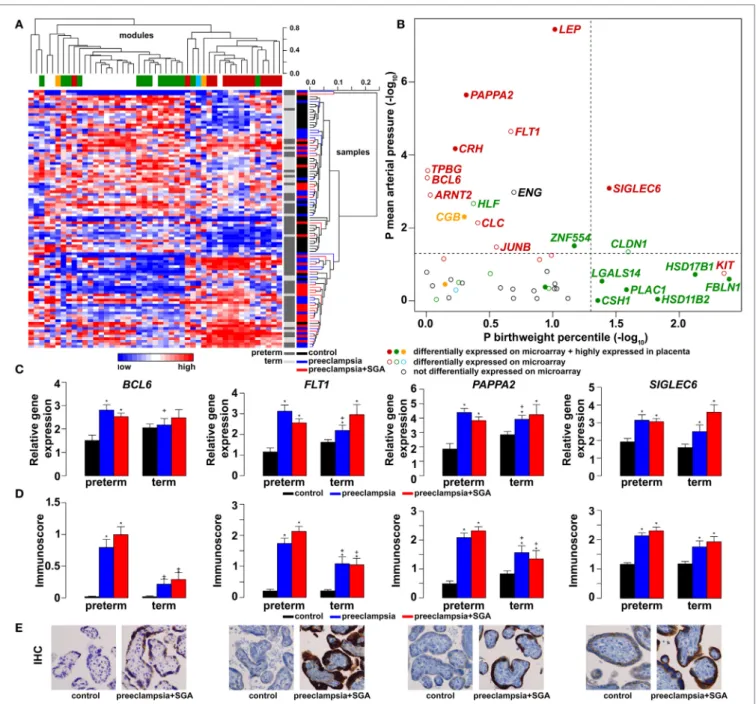
As depicted in the heatmap representing qRT-PCR data for the 100 placentas and 47 genes (Figure 4A), validation data supported microarray experiments in terms of (1) differential expression of selected genes, (2) high correlation of genes within modules M1 and M2, and (3) separate dysregulation of modules M1 and M2 from each other. Comparison between preterm preeclampsia and gestational age-matched controls revealed that qRT-PCR data validated microarray results (differential or non-differential gene expression) for 33 of 47 genes (70%), and further confirmed the differential expression of four genes that were non-dysregulated in the microarray cohort (Table 3).
As expected, the extent of changes in gene expression was less pronounced in term preeclampsia (Table 3; Figure 4C; Figure S3 in Supplementary Material). As a further confirmation, there was a strong correlation between qRT-PCR data as well as tissue microarray (TMA) and immunostaining results for selected proteins in module M2 (Figures 4C–E). The extent of dysregulation was larger in preterm phenotypes of preeclampsia than in term phenotypes, in agreement with the more severe placental pathology (44). Among transcription regulatory genes of module M1, HLF had strong down-regulation only in preterm preeclampsia while ZNF554 was expressed at a lower
FigUre 4 | Gene modules associated with blood pressure (BP) and birthweight (BW). (a) Hierarchical clustering of qRT-PCR data obtained with 100 samples and 47 genes. Pearson correlation was used for similarity analysis and average method for linkage calculation. Samples were colored according to patient groups and maturity status. M1 (green) and M2 (red) module genes and 34 of 60 samples from women with preeclampsia clustered together. (B) Association of gene expression with BP and BW. The significance p-values for these coefficients were plotted for all genes, colored according to module classification (black: not changed on the microarray). Filled circles represent predominantly placenta-expressed genes and dashed lines the significance threshold at p = 0.05. Seven of 9 genes related to BW belong to module M1, while 10 of 15 genes related to BP are from module M2. Gene expression (c) and protein immunostaining (D) of selected four genes in module M2 show similar patterns in the sub-groups of preeclampsia, and semi-quantitative immunoscorings validate gene expression data. Significant differences in preterm or term preeclampsia samples compared to gestational-age matched controls are shown with “*”. When the change with preeclampsia in preterm samples was different from that in term samples, a “+” marks such an interaction. Comparisons for all genes are available in Figure S3 in Supplementary Material. (e) Representative images of the same placenta from a preterm control (left, 29 weeks) and a patient with preterm preeclampsia associated with SGA (right, 31 weeks) are shown for the immunostainings (hematoxylin counterstaining, 40× magnification).
level in all preeclampsia phenotypes (Figure S3 in Supplementary Material). Among the transcription regulatory genes in module M2, ARNT2, BCL6, and JUNB were highly expressed in preterm but not in term preeclampsia, suggesting that these might play a
role only in the pathology of preterm cases (Figure 4C; Figure S3 in Supplementary Material). Overall, these data reflect the het- erogeneous placental pathology and the more severely affected pathways in preterm preeclampsia.
FigUre 5 | The timing of gene module dysregulation in preterm preeclampsia. (a) A database of 80,170 measurements published in 61 reports (35, 61, 82, 88, 126, 178–233) was built for “virtual” liquid biopsy of the placenta in preterm preeclampsia with maternal blood levels of proteins with the highest expression in the placenta among all tissues [i.e. hCG, human placental lactogen (hPL), sEng, sFlt-1, and leptin]. Levels of these biomarkers in preterm preeclampsia were expressed as the percentage of control levels (dashed line) and were represented in scatter plots by different colors reflecting gene module classification. Based on qRT-PCR data, sEng belongs to module M2 (red). hPL (M1, green module) levels in preeclampsia were constantly below control levels during gestation, while the levels of module M2 biomarkers in preeclampsia had continuous elevation compared to control levels as a function of gestational age. (B) Analysis of first trimester data revealed the lower expression of all biomarkers in preeclampsia than in controls before the onset of maternal circulation, and the increasing expression of module M2 biomarkers in preeclampsia compared to controls after 12 weeks of gestation.
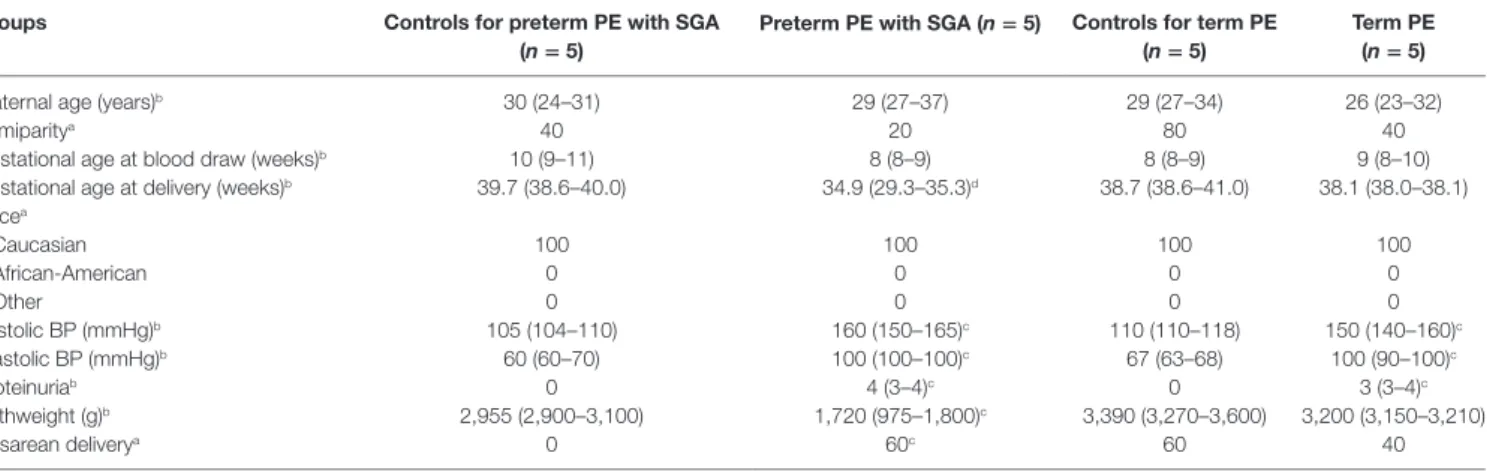
TaBle 4 | Demographics of Israeli women included in the maternal blood two-dimensional differential in-gel electrophoresis proteomics study.
groups controls for preterm Pe with sga
(n = 5) Preterm Pe with sga (n = 5) controls for term Pe
(n = 5) Term Pe
(n = 5)
Maternal age (years)b 30 (24–31) 29 (27–37) 29 (27–34) 26 (23–32)
Primiparitya 40 20 80 40
Gestational age at blood draw (weeks)b 10 (9–11) 8 (8–9) 8 (8–9) 9 (8–10)
Gestational age at delivery (weeks)b 39.7 (38.6–40.0) 34.9 (29.3–35.3)d 38.7 (38.6–41.0) 38.1 (38.0–38.1) Racea
Caucasian 100 100 100 100
African-American 0 0 0 0
Other 0 0 0 0
Systolic BP (mmHg)b 105 (104–110) 160 (150–165)c 110 (110–118) 150 (140–160)c
Diastolic BP (mmHg)b 60 (60–70) 100 (100–100)c 67 (63–68) 100 (90–100)c
Proteinuriab 0 4 (3–4)c 0 3 (3–4)c
Birthweight (g)b 2,955 (2,900–3,100) 1,720 (975–1,800)c 3,390 (3,270–3,600) 3,200 (3,150–3,210)
Cesarean deliverya 0 60c 60 40
BP, blood pressure; PE, preeclampsia; SGA, small-for-gestational age.
aPercentage.
bMedian (interquartile range).
cp < 0.05 when compared to corresponding controls.
dp < 0.001 when compared to corresponding controls.
Because of the possible involvement of these two gene mod- ules in distinct pathologic pathways, we correlated qRT-PCR data with maternal and fetal clinico-pathological indicators to further investigate their association (Figure 4B). This analysis showed that 7 of 9 genes related to the birthweight (BW) percentile were from module M1, while 10 of 15 genes related to BP were from module M2, confirming our observations with microarray data.
Therefore, we decided to also refer to these as “M1-BW” and
“M2-BP” modules. Of interest, the expression of most (9/14) M1 genes was negatively associated with the “maternal vascular malperfusion” score of the placenta, while the expression of most
(10/14) M2 genes was positively correlated with this parameter (Data S7 in Supplementary Material). This observation fits well with the accepted concept that maternal vascular malperfusion of the placenta leads to oxidative stress (40, 41, 63, 175) and the increased placental expression of FLT1 (63).
Maternal study
Maternal Blood Reflects Gene Module Dysregulation in Preeclampsia
Next, we investigated whether placental gene module dysregula- tion can be detected in maternal blood and whether liquid biopsy
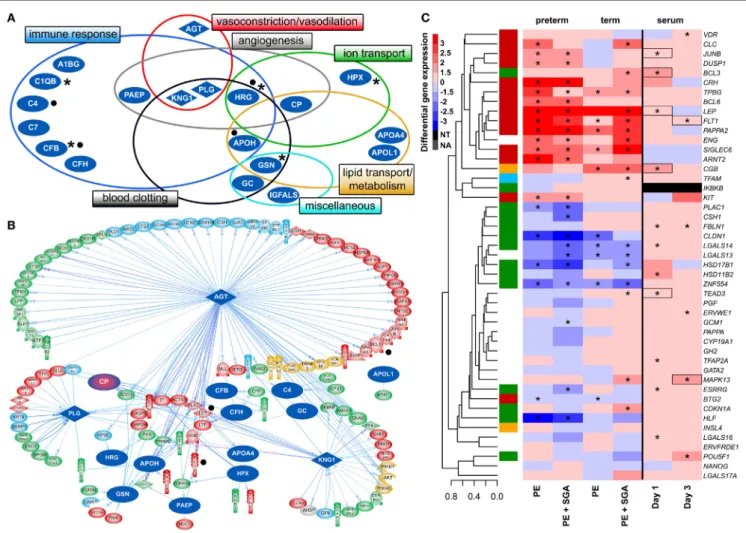
FigUre 6 | Maternal blood proteomic changes and their effect on differentially expressed (DE) genes in preterm preeclampsia. (a) The 19 DE maternal serum proteins in preterm preeclampsia identified by two-dimensional differential in-gel electrophoresis could be classified into functional groups relevant for preeclampsia pathophysiology. Asterisks denote proteins reported by others to have the same direction differential abundance in the first trimester in patients developing preterm preeclampsia (126, 143, 239–241). Dots denote immune proteins that multiple reaction monitoring assays identified to have differential abundance in preterm preeclampsia in the same direction. (B) The 19 DE serum proteins have connections to 121 DE placental genes, among which 48 belong to module M2.
Angiotensinogen has more connections than other proteins (OR = 1.9, p = 4.9 × 10⁻⁵), and the most connections to module M2 genes (n = 35); 77 of 86 connections of angiotensinogen have a directional effect toward the gene. Dots denote genes in connection to angiotensinogen found up-regulated in villous trophoblast (VT) upon treatment with first trimester serum from preeclamptic women. (c) Hierarchical clustering tree and heatmap representing differential placental gene expression in preeclampsia as in Figure 4a. The expression of the same genes (except IKBKB) was determined in primary VTs upon treatment with first trimester maternal serum. Serum from preeclamptic compared to control women induced the up-regulation of seven placental dysregulated genes (depicted with boxes) on the first and third days of VT differentiation, among which six were up-regulated in term and three in preterm preeclampsia. Stars depict significant changes, color bar encodes signed (up or down)-fold changes. Abbreviations: NA, not expressed; NT, not examined.
can be used to determine when the module dysregulation occurs.
To study the relationship between placental gene expression and maternal biomarker concentrations, we selected predominantly placenta-expressed genes with the most differential expression in modules M1 (CSH1) or M2 (LEP), and correlated their placental expression levels with concentrations of their secreted protein products (hPL and leptin) in maternal blood collected in both first (n = 12) and third trimesters (n = 19) in a Hungarian patient population. Positive correlations were found between placental gene expression and maternal blood protein concentrations for both biomarkers in both trimesters (Figure S4 in Supplementary Material), suggesting that certain proteins in the maternal
circulation reflect the placental expression of their encoding genes throughout pregnancy.
To detect disease-associated protein signatures of placental dysfunction in maternal blood, similar to plasma DNA tissue mapping for noninvasive prenatal assessments (176, 177), we performed “virtual” liquid biopsy of the placenta in preterm preeclampsia (Figure S5 in Supplementary Material; Figure 5).
We identified five genes with predominant placental expression, which have products extensively investigated in maternal blood in preterm preeclampsia or in all cases of preeclampsia dur- ing all trimesters. From data of 61 reports (35, 61, 82, 88, 126, 178–233), we built a database of 80,170 measurements in which
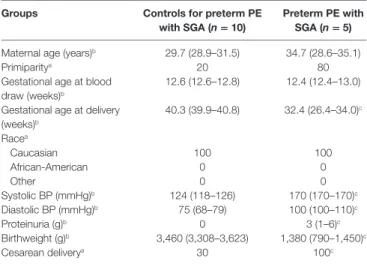
TaBle 5 | Demographics of Hungarian women included in the maternal blood multiple reaction monitoring proteomics study.
groups controls for preterm Pe
with sga (n = 10) Preterm Pe with sga (n = 5) Maternal age (years)b 29.7 (28.9–31.5) 34.7 (28.6–35.1)
Primiparitya 20 80
Gestational age at blood draw (weeks)b
12.6 (12.6–12.8) 12.4 (12.4–13.0) Gestational age at delivery
(weeks)b
40.3 (39.9–40.8) 32.4 (26.4–34.0)c Racea
Caucasian 100 100
African-American 0 0
Other 0 0
Systolic BP (mmHg)b 124 (118–126) 170 (170–170)c
Diastolic BP (mmHg)b 75 (68–79) 100 (100–110)c
Proteinuria (g)b 0 3 (1–6)c
Birthweight (g)b 3,460 (3,308–3,623) 1,380 (790–1,450)c
Cesarean deliverya 30 100c
BP, blood pressure; PE, preeclampsia; SGA, small-for-gestational age.
aPercentage.
bMedian (interquartile range).
cp < 0.05.
preeclampsia data were expressed as a percentage of average levels in controls. Regarding biomarkers in module M1, we found hPL levels in preterm preeclampsia to be consistently below control levels throughout pregnancy. This is substantiated by the down- regulation of another M1 biomarker, HSD17B1, in first trimester maternal blood (160), confirming a generalized down-regulation of M1 biomarkers in early pregnancy. By contrast, the levels of biomarkers in module M2 had constant elevation in preterm preeclampsia compared to controls during gestation. When analyzing only data collected in the first trimester, prior to the onset of maternal circulation to the placenta, levels of M1 and M2 biomarkers were lower in women with preeclampsia compared to controls, while after 12 weeks of gestation, following the opening of the intervillous spaces to maternal blood flow, patients had increasing levels of M2 biomarkers in maternal blood compared to controls. These findings offer support for the conclusion that placental transcriptomic changes typical for preeclampsia in the third trimester are rooted in the first trimester.
Altered Maternal Serum Proteome in Preeclampsia Next, we investigated the maternal serum proteome in early preg- nancy in distinct phenotypes of preeclampsia and the potential effects of proteomic changes on the placental transcriptome.
Comparing samples from women with preterm preeclampsia associated with SGA and their respective controls from an Israeli patient population (n = 10, Table 4), 19 DE protein spots were identified and investigated by mass spectrometry. According to public data, many of these proteins have a role in immune response, complement and coagulation cascades, lipid transport and metab- olism, angiogenesis, BP regulation, and ion transport (Figure 6A, Data S8 in Supplementary Material). Comparing samples from women with term preeclampsia and their respective controls from this Israeli patient population (n = 10, Table 4), 14 DE protein spots could be identified (Figure S6A; Data S8 in Supplementary Material). Many of the proteins found in these spots are the
same as those found in preterm preeclampsia or function in the same pathways. Of note, these pathways and the 26 differentially abundant proteins identified in term and preterm preeclampsia had mostly been implicated in a later stage of preeclampsia (43, 101, 120, 234–238). We concluded that there is a common dysregulation of the maternal serum proteome in term and preterm preeclampsia; however, the extent of changes is larger in the latter, in agreement with the more fulminant and early pathogenesis.
Supporting our findings, five studies (126, 143, 239–241) found proteins with differential abundance in preterm preec- lampsia in the same direction as our two-dimensional differ- ential in-gel electrophoresis (2D-DIGE) study (Figure 6A). We also collected maternal blood specimens in the first trimester from a Hungarian patient population (n = 15, Table 5), and measured the concentrations of 10 immune proteins in patients with preterm preeclampsia associated with SGA and matched controls using liquid chromatography–mass spectrometry multiple reaction monitoring (MRM). In spite of the difference between the methods and ethnic background, MRM identi- fied 4 of these 10 proteins as having differential abundance in the same direction as in the 2D-DIGE study, supporting the early pro-inflammatory changes in the maternal proteome in preterm preeclampsia (Figure 6A; Data S9 in Supplementary Material). MRM and proteomic evidence published to date supported 37% (7/19) of the proteomic changes detected by 2D-DIGE.
The In Silico Effects of Altered Maternal Serum Proteome on the Placenta
To reveal whether early proteomic changes in maternal blood may affect the placental transcriptome, placental DE genes with documented connections to DE proteins in maternal serum were identified by Pathway Studio. The 121 DE placental genes with connections to DE serum proteins in preterm preeclampsia were marginally over-represented by those from module M2 (48/121, OR = 1.4, p = 0.057). Angiotensinogen had the largest number of connections to DE genes including FLT1 and LEP (n = 86, OR = 1.9, p = 4.9 × 10⁻⁵). This protein also had the largest number of connections to module M2 genes (n = 35), followed by plasminogen (n = 11) and kininogen-1 (n = 9), all involved in BP regulation (Figure 6B). These data were supported by the “renin-angiotensin signaling” as being a top pathway (p = 1.28 × 10⁻⁴) among the 35 angiotensinogen-connected DE genes (Data S10 in Supplementary Material). Similar results were obtained when analyzing connections between 116 DE placental genes and DE serum proteins in term preeclampsia (Figure S6B in Supplementary Material).
Trophoblast study
The In Vitro Effects of an Altered Maternal Serum Proteome on the Trophoblast
Next, we aimed to study various factors implicated in the patho- genesis of preeclampsia in trophoblast models to determine whether these may drive the observed placental transcriptomic changes. Since the results noted above suggested that maternal serum proteins can influence the placental transcriptome, we
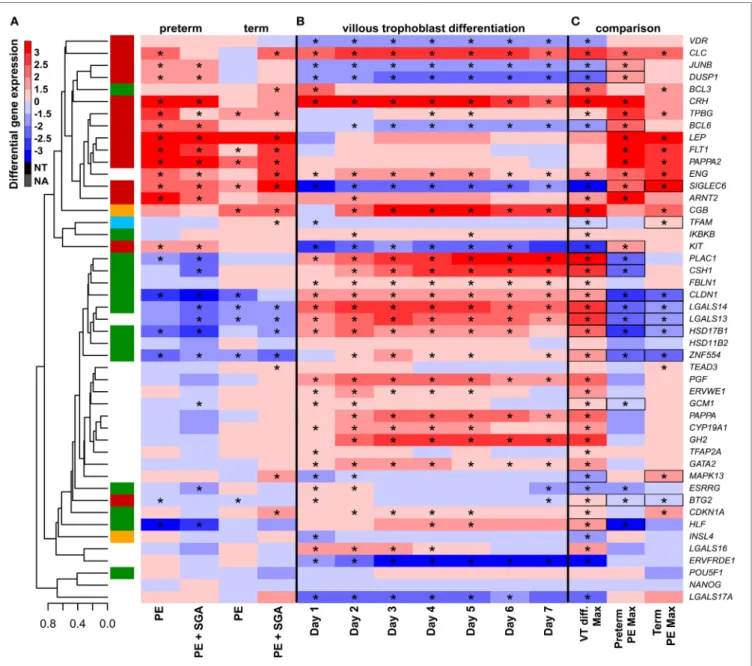
FigUre 7 | The effect of trophoblast differentiation on differentially expressed genes in preeclampsia. (a) Hierarchical clustering tree of expression data for 47 genes in 100 placental specimens was augmented with a heatmap representing differential gene expression in term or preterm subgroups of preeclampsia. (B) Primary villous trophoblast (VT) differentiation time series expression data for 47 genes were depicted with a heatmap representing differential gene expression in each time point (days 1–7) compared to day 0. (c) Maximum expression values in the VT differentiation time series were presented alongside with maximum expression values in the placenta in preterm or term preeclampsia. Comparative visualization revealed the opposite-direction differential regulation of 17 genes in preeclampsia compared to VT differentiation as depicted with black boxes. Among these genes, 15 had this behavior in preterm preeclampsia and 9 in term preeclampsia (p = 0.057). In (a–c), stars depict significant changes, color bar encodes signed (up or down)-fold changes. Abbreviations: NA, not expressed; NT, not examined.
first measured the effects of maternal blood from early preg- nancy on trophoblastic gene expression. We treated primary VTs during differentiation with first trimester sera from women with preterm preeclampsia or normal pregnancy, and analyzed the expression of genes included in the placental validation study. Serum from preeclamptic women compared to controls induced up-regulation of seven placental DE genes on the first and third days of trophoblast differentiation, including FLT1 and LEP (Figure 6C). Among these, six genes were up-regulated in
the placenta in term and three in preterm preeclampsia. These results support in silico findings and suggest that maternal serum factors can up-regulate FLT1 and may induce the terminal pathway.
The Effects of Altered VT Differentiation
Next, we examined whether disturbance in VT differentiation may be reflected in the placental gene expression signature in women with different preeclampsia phenotypes. Since there
FigUre 8 | The effect of O2 levels, BCL6 and ARNT2 overexpression on differentially expressed genes in preeclampsia. (a) Hierarchical clustering tree and heatmap representing differential placental gene expression in preeclampsia. (B) The overexpression of ARNT2 or BCL6 in normoxic BeWo cells induced the dysregulation of three or five genes dysregulated in preeclampsia, respectively (boxed). (c) Hypoxia induced the dysregulation of five genes in BeWo cells also altered in
preeclampsia. Hypoxia combined with ARNT2 or BCL6 overexpression led to the dysregulation of a large number of genes. (D) Ischemia induced the dysregulation of three genes in BeWo cells similar to preeclampsia. Ischemia combined with ARNT2 or BCL6 overexpression led to the dysregulation of 11 genes similar to preeclampsia. (c,D) Represents comparisons of gene expressions between hypoxia/ischemia vs. normoxia. In (a–D), stars depict significant changes, “O” depicts
“overexpressed,” color bar encodes signed (up or down)-fold changes. Black boxes depict genes with similar expression changes in vitro as in the placenta in preeclampsia. Abbreviations: NA, not expressed; NT, not examined.
were no (n = 46) or subtle (n = 2) gestational age-dependent differences in the expression of selected target or housekeeping genes in third trimester control placentas in our microarray study (132), the comparison of placentas and trophoblasts from various gestational ages was deemed to be valid. Thus, we performed qRT-PCR profiling of primary VTs during 7 days of differentiation to reveal the dynamics in the expression of
genes (Figure 7B), which we similarly profiled in the placenta (Figure 7A). We determined whether maximum expression change of selected genes during VT differentiation compared to day 0 inversely correlated with their maximum expression change in different preeclampsia phenotypes. We found that this was the case for 17 genes (Figure 7C), suggesting the delay or inhibition of VT differentiation-related expression change of these genes in