R E S E A R C H A R T I C L E
Data-driven integration of hippocampal CA1 synaptic physiology in silico
András Ecker
1| Armando Romani
1| Sára Sáray
2,3| Szabolcs Káli
2,3| Michele Migliore
4| Joanne Falck
5| Sigrun Lange
5,6| Audrey Mercer
5| Alex M. Thomson
5| Eilif Muller
1| Michael W. Reimann
1| Srikanth Ramaswamy
11Blue Brain Project, École Polytechnique Fédérale de Lausanne, Campus Biotech, Geneva, Switzerland
2Institute of Experimental Medicine, Budapest, Hungary
3Faculty of Information Technology and Bionics, Pázmány Péter Catholic University, Budapest, Hungary
4Institute of Biophysics, National Research Council, Palermo, Italy
5UCL School of Pharmacy, University College London, London, UK
6School of Life Sciences, University of Westminster, London, UK
Correspondence
András Ecker and Srikanth Ramaswamy, Blue Brain Project, École Polytechnique Fédérale de Lausanne, Campus Biotech, Geneva, Switzerland.
Email: andras.ecker@epfl.ch; srikanth.
ramaswamy@epfl.ch
Funding information
École Polytechnique Fédérale de Lausanne;
ETH Board Funding; European Union Seventh Framework Program, Grant/Award Numbers:
604102, FP7/2007-2013; European Union's Horizon 2020 Framework Programme for Research and Innovation, Grant/Award Numbers: 785907, 720270; ÚNKP-19-3-III New National Excellence Program; European Social Fund, Grant/Award Number: EFOP- 3.6.3-VEKOP-16-2017-00002
Abstract
The anatomy and physiology of monosynaptic connections in rodent hippocampal CA1 have been extensively studied in recent decades. Yet, the resulting knowledge remains disparate and difficult to reconcile. Here, we present a data-driven approach to inte- grate the current state-of-the-art knowledge on the synaptic anatomy and physiology of rodent hippocampal CA1, including axo-dendritic innervation patterns, number of synapses per connection, quantal conductances, neurotransmitter release probability, and short-term plasticity into a single coherent resource. First, we undertook an exten- sive literature review of paired recordings of hippocampal neurons and compiled experimental data on their synaptic anatomy and physiology. The data collected in this manner is sparse and inhomogeneous due to the diversity of experimental techniques used by different groups, which necessitates the need for an integrative framework to unify these data. To this end, we extended a previously developed workflow for the neocortex to constrain a unifying
in silicoreconstruction of the synaptic physiology of CA1 connections. Our work identifies gaps in the existing knowledge and provides a complementary resource toward a more complete quantification of synaptic anatomy and physiology in the rodent hippocampal CA1 region.
K E Y W O R D S
CA1, data integration, hippocampus,in silicomodeling, synapse
1 | I N T R O D U C T I O N
The hippocampal formation, notably the CA1 region, is one of the most exhaustively studied regions in the mammalian brain and is thought to play a role, for example, in the acquisition of memory, recognition of
place and language (Bliss & Collingridge, 2013; Buzsáki, 1989). Neuronal microcircuits in the hippocampal CA1 region process and store informa- tion through a myriad of cell-type-specific monosynaptic connections.
Previous studies have shown that hippocampal cell types are con- nected through multiple synaptic contacts, which are positioned This is an open access article under the terms of the Creative Commons Attribution-NonCommercial License, which permits use, distribution and reproduction in any medium, provided the original work is properly cited and is not used for commercial purposes.
© 2020 The Authors.Hippocampuspublished by Wiley Periodicals LLC.
Hippocampus.2020;30:1129–1145. wileyonlinelibrary.com/journal/hipo 1129
across distinct axo-dendritic domains with a wide diversity in their physiology. Despite the wealth of data, we lack an integrative frame- work to reconcile the diversity of synaptic physiology, and therefore, identify knowledge gaps. There have been several noteworthy attempts to integrate knowledge on the cellular and synaptic compo- nents of hippocampal CA1 microcircuitry, which have provided a solid foundation to bring together anatomical properties and kinetic param- eters of cell-type-specific connections—including the number of syn- apses per connection, connection probabilities, neurotransmitter release probabilities, and amplitudes of synaptic responses (Bezaire &
Soltesz, 2013; Moradi & Ascoli, 2020; Wheeler et al., 2015). As a com- plementary endeavor, we extended a previously developed framework to reconstruct neocortical microcircuitry at the cellular and synaptic levels of detail (Markram et al., 2015), by integrating disparate data on the physiology of short-term dynamics of depression and facilitation of cell-type-specific synaptic transmission in hippocampal CA1. Using this framework, we identified and extrapolated organizing principles to pre- dict missing knowledge for a repertoire of connection types, for exam- ple, the short-term dynamics and peak conductance of synaptic connections between inhibitory interneurons (Klausberger &
Somogyi, 2008; Pelkey et al., 2017), which remain largely uncharacterized, and could, therefore, require high-throughput strate- gies that employ multiple whole-cell patch-clamp recordings to surmount the relatively low yield obtained through conventional paired recordings (Espinoza, Guzman, Zhang, & Jonas, 2018; Jiang et al., 2015;
Perin, Berger, & Markram, 2011).
We accounted for the dynamic and probabilistic nature of synaptic transmission by fitting experimental traces using a stochastic generali- zation of the Tsodyks–Markram (TM) short-term plasticity (STP) model (Fuhrmann, Segev, Markram, & Tsodyks, 2002; Markram, Wang, &
Tsodyks, 1998; Tsodyks & Markram, 1997), and also considered tem- perature and extracellular calcium concentration ([Ca2+]o) differences, which were adjusted using Q10 and Hill scaling factors, respectively.
Measuring peak quantal conductances directly at individual syn- aptic contacts remains very difficult, if not impossible with current experimental techniques. While theoretically, the peak synaptic con- ductance can be calculated from voltage-clamp recordings by simply dividing the peak postsynaptic current (PSC) by the liquid junction potential (LJP)-corrected driving force, this approach does not take into account the space-clamp artifact (Gulyás, Freund, & Káli, 2016;
Spruston, Jaffe, Williams, & Johnston, 1993; Williams &
Mitchell, 2008). We have recently demonstrated that space-clamp corrected peak synaptic conductances in neocortical connections are at least twofold to threefold higher than estimated previously (Markram et al., 2015). As a connection is formed by several synaptic contacts, each subject to a different space-clamp effect, a purely the- oretical correction is challenging. We, therefore, used an alternative approach, where we calibrated peak synaptic conductances in thein silicomodel of connected pairs such that the resulting postsynaptic potential (PSP) amplitudes matchin vitrorecordings. This yielded an estimate of peak synaptic conductance since other factors affecting the PSP amplitude—such as number and location of synapses, release probability and reversal potential, depression, facilitation, and synaptic
conductance rise and decay time constant—were independently vali- dated beforehand.
The resulting models for a subset of hippocampal connection types were applied predictively to the remaining uncharacterized con- nection types by clustering them into nine groups based on synapse types and neuronal biomarkers and applying the estimated parameters within each group. Curated and predicted parameters presented here should serve as a resource to researchers aiming to model hippocam- pal synapses at any level, while the detailed methodology intends to give a guideline to utilize such a framework to integrate data from other brain regions or species.
2 | M E T H O D S
2.1 | Circuit building and synapse anatomy
A detailed model of the rat hippocampal CA1 area was built by adapting a previously described pipeline for reconstructing neocortical microcircuitry (Markram et al., 2015). In brief, detailed axo-dendritic morphological reconstructions and electrophysiological traces obtained from the dorsal part of hippocampal CA1 were used to build single cell-type-specific computational models (Migliore et al., 2018) (see Supplementary Methods). The resulting single-cell models were assembled in an atlas-based volume corresponding to the dimensions of the hippocampal CA1 region (Ropireddy, Bachus, & Ascoli, 2012), cell-densities and proportions, which yielded a tissue model consisting about 400,000 cells,90% pyramidal cells (PCs), and10% interneu- rons comprising 11 distinct morphology types (m-types; see Supple- mentary Methods and Supplementary Figure S1) (Bezaire &
Soltesz, 2013). Structural appositions between axons and dendrites were detected based on touch distance criteria and subsequently pruned to yield a functional connectome through an algorithmic pro- cess, which was constrained with experimentally reported bouton density, number of synapses per connections, and connection proba- bility (Reimann, King, Muller, Ramaswamy, & Markram, 2015). A previ- ous study suggests targeted innervation of interneurons from PCs (Takács, Klausberger, Somogyi, Freund, & Gulyás, 2012). Therefore, to recreate this tendency, touch distances from PCs to interneurons were set to 6μm as against 1μm for connections between PCs. Furthermore, touch distances of 6μm for connections between all interneurons and 1μm for connections between interneurons and PCs were assumed. In this manner, the number and location of synapses for each cell-types spe- cific connection were derived in a data-driven manner. When rep- roducing paired recordings in silico (see below), monosynaptically connected pairs of neurons were sampled from this reconstructed circuit based on their intersomatic distance as sampling criterion.
2.2 | Dendritic features of single cell models
Detailed, multicompartmental morphoelectrical models with 3D reconstructed dendrites from Migliore et al. (2018) were used in the
present study (see Supplementary Methods and Supplementary Figure S1). The attenuation of synaptic responses along the dendrites with varying diameters was validated against experimental data from Magee and Cook (2000) using the HippoUnit framework (see Supple- mentary Methods). To this end, excitatory PSC (EPSC) like currents were injected into the apical trunk of PCs with varying distance from the soma and PSPs were simultaneously measured at the local site of the injection and in the soma.
2.3 | Model of postsynaptic conductance and current
Synaptic conductances were modeled with biexponential kinetics:
g tð Þ=bgA e −t=τdecay−e−t=τrise
ð1Þ
wherebg(nS) is the peak synaptic conductance andτriseandτdecay(ms) are PSC rise and decay time constants, respectively. The A=e−tp=τdecay−e−tp=τrise normalization constant ensures that synapses reach their peak conductance at tp = (τdecayτrise)/((τdecay−τrise)log (τdecay/τrise)) (ms). (Equation (1) is modified below to take stochastic release of multiple vesicles into account.) AMPAR and GABAR synap- tic currents are then computed as:
I tð Þ=g tð ÞðVmð Þt −ErevÞ ð2Þ
whereVm(mV) is the membrane potential andErev(mV) is the reversal potential of the given synapse. NMDAR currents depend also onMg2+
block:
INMDAð Þt =g tð Þmg Vð mð ÞtÞðVmð Þt −ErevÞ ð3Þ
where mg(Vm) is the LJP-corrected (see below) Jahr–Stevens non- linearity (Jahr & Stevens, 1990):
mg Vð Þm = 1 1 +e−c1Vm CMg2 +=c2
ð4Þ
whereCMg2 + (mM) is the extracellular magnesium concentration and c1= 0.062 (1/mV) andc2= 2.62 (mM) are constants (the difference from the original Jahr and Stevens (1990) constant is because the authors did not correct for the LJP offset of 5 mV). PC-to-PC NMDAR rise and decay time constants are Q10 corrected (see below) (Q10 = 2.2 ms for rise and 1.7 ms for decay time constants (Hestrin, Sah, & Nicoll, 1990; Korinek, Sedlacek, Cais, Dittert, &
Vyklicky, 2010)) values from Andrasfalvy and Magee (2001):
τrise = 3.9 ms andτdecay= 148.5 ms. All, but the CCK+ interneuron excitatory afferents have the same NMDAR time constants as the PC- to-PC ones, while the PC to CCK+ interneuron NMDAR conductance decays with a slower time constant:τdecay= 298.75 ms (Cornford et al., 2019; Le Roux, Cabezas, Böhm, & Poncer, 2013; Matta et
al., 2013). Peak NMDAR conductancebgNMDA (nS) is calculated from the AMPAR one by multiplying it with NMDAR/AMPAR peak conduc- tance ratio. PC-to-PC NMDAR/AMPAR peak conductance ratio = 1.22 was taken from Groc, Gustafsson, and Hanse (2002) and Myme, Sugino, Turrigiano, and Nelson (2003).
PC to CCK+ interneuron NMDAR/AMPAR bg ratio was set to 0.86, as against 0.28 for PC to other interneurons (Le Roux et al., 2013; Matta et al., 2013). Synaptic currents are individually del- ayed based on axonal path length and conduction velocity of 300μm/
ms (Stuart, Schiller, & Sakmann, 1997) and an additional 0.1 ms delay of neurotransmitter release (Ramaswamy et al., 2012).
2.4 | STP parameter fitting
STP of synapse dynamics was fit by the TM model (Markram et al., 1998; Tsodyks & Markram, 1997). The model assumes that each synapse has a pool of available neurotransmitter resources (R) that is utilized by a presynaptic action potential (AP) with a release probability (U). The utilization of resources leads to postsynaptic conductance that is proportional to the amount utilized.Rdecreases andUincreases after an AP and bothRandUrecover between spikes to a steady-state (SS) value. The speed of recovery is parameterized by time constantsDand F(ms) that together determine the short-term dynamics of the synapse.
This is described by the following differential equations:
dR tð Þ
dt =1−R tð Þ
D −U tð ÞR tð Þδ t−tspike
ð5Þ
dU tð Þ
dt =USE−U tð Þ
F +USEð1−U tð ÞÞδt−tspike
ð6Þ
whereUSEis the utilization of synaptic efficacy or absolute release probability (also known as the release probability in the absence of facilitation), δ(t) is the Dirac delta function and tspike indicates the timing of a presynaptic spike. Each AP in a train elicits anASEU(tspike)R (tspike) amplitude PSC, whereASEis the absolute synaptic efficacy. R
= 1 andU=USEare assumed before the first spike.
TheUSE,D,F, andASEfree parameters of the model were fit to amplitudes of experimentally recorded trains of PSCs. In the case of Losonczy, Zhang, Shigemoto, Somogyi, and Nusser (2002), amplitudes were already extracted by the authors, while in the case of Kohus et al. (2016) custom-written Python routines were used to extract them from the averaged postsynaptic traces. Fitting the 10 + 1 recovery spikes was done by using a multiobjective genetic algorithm from BluePyOpt (Van Geit et al., 2016). For Kohus et al. (2016), differ- ent frequency stimulations (10, 20, and 40 Hz) were fit together for better generalization. Thus, the optimized error function con- tained 3 (frequencies)×11 (peak amplitudes) points. For the event-based version of the equations above, see Maass and Mark- ram (2002) and Supplementary Methods. The Python source code fitting amplitudes from multiple frequencies is available on GitHub under /BluePyOpt/examples.
2.5 | Stochastic TM model with multivesicular release
For the simulation of synapses, the canonical TM model (intro- duced above and used for fitting experimental traces) was modi- fied to include stochastic release of multiple vesicles, and connected to the model of postsynaptic conductance described above. To take multivesicular release (MVR) into account in the postsynaptic conductance model, the classical“quantal model”of Del Castillo and Katz (1954) was used. In this model, synapses are assumed to be composed ofNRRP(size of the readily releasable pool) release sites, each of which has a probability of releaseU (see deterministic TM model above) and contributes a 1/NRRP
quanta to the postsynaptic response (Barros-Zulaica et al., 2019;
Loebel et al., 2009; Markram et al., 2015; Ramaswamy et al., 2012, 2015). Unlike in the deterministic TM model above, individual quanta were assumed to be released in an all-or-none fashion with probabilityU(t) (Fuhrmann et al., 2002). Vesicle avail- ability is also an all-or-none process where only available vesicles can be released. To this end, synaptic vesicles were implemented as two-state (available: 1 and unavailable: 0) Markov processes.
After release, the state is set to unavailable and the probability of staying in the unavailable state at timetwas described as a sur- vival process, with the time constantD. The state transitions are described by the following set of equations:
P1!0=U tð Þðsee Eequation 6ð ÞÞ ð7Þ P1!1= 1−P1!0
P0!0=e−ðt−tspikeÞ=D P0!1= 1−P0!0
The above-described model converges to the canonical TM model in the limit (number of trials!∞). In this formalism, a presynaptic AP releases only a fractionNr≤NRRPfraction of vesicles, which follows a Bernoulli distribution. Equation (1) is thus updated as follows:
g tð Þ=bg d tð ð Þ−r tð ÞÞ ð8Þ
dd tð Þ dt =− d tð Þ
τdecay
+A Nr
NRRPδt−tspike
ð9Þ
dr tð Þ dt =−r tð Þ
τrise
+A Nr
NRRPδ t−tspike
ð10Þ
whereranddare the rising and decaying components of the postsyn- aptic conductance, respectively. The implementation of the above described stochastic synapse model is available at the open-access NMC portal (Ramaswamy et al., 2015).
These changes to the canonical TM model introduce variability of the postsynaptic traces, where the magnitude of the variability depends on the additionalNRRPparameter (Barros-Zulaica et al., 2019;
Loebel et al., 2009).In vitrothis variability is typically assessed by the coefficient of variation (CV,SD/mean) of the peak PSC (or PSP) ampli- tudes. Therefore, theNRRPwas calibrated to match the CVs of the first PSCs extracted from the raw traces of Kohus et al. (2016). For a better comparison, artificial membrane noise was added to the simulated traces (see Barros-Zulaica et al. (2019) and Supplementary Methods).
2.6 | Calibrating peak synaptic conductances through in silico paired recordings
Paired recordings were replicatedin silicoas follows: First, pairs were selected from the circuit based on pathway specific distance criteria used by experimentalist (100μm3 for cells in the same layer and 200μm3 for cell pairs from different layers). Second, postsynaptic cells were current clamped to match the LJP-corrected (see below) SS potential specified in the experiments. It is important to note, that in the case of PCs sodium channels were blocked (in silicoTTX applica- tion) when clamping above−58 mV to avoid spontaneous firing of the cell models (see Migliore et al. (2018), figure 5), whereas sodium channels were not blocked inin vitroexperiments. Next, the presynap- tic cell was stimulated by somatic current injection, which resulted in a PSP recorded in the soma of the postsynaptic neuron. This protocol was repeated for 50 monosynaptic connections of the same pre-post combination with 35 repetitions for each neuron pair. Finally, the mean PSP amplitude was compared against experimentally data and the peak conductance value was calibrated using the formula:
b
g=bgPSPexpð1−PSPmodel=dfÞ
PSPmodelð1−PSPexp=dfÞ ð11Þ
where PSPexp (mV) and PSPmodel (mV) are the experimental and modeled PSPs amplitudes respectively anddf= jErev−VSSj(mV) is the driving force. For all the experiments we aimed to reproduce, Erev = −8.5 mV was calculated for excitatory connections, while Erev= −73 mV for inhibitory connections (Moradi & Ascoli, 2020). All simulations were run using the NEURON simulator as a core engine (Hines & Carnevale, 1997) with the Blue Brain Project's collection of hoc and NMODL (Hines & Carnevale, 2000) templates for parallel exe- cution on supercomputers (Hines, Eichner, & Schürmann, 2008; Hines, Markram, & Schürmann, 2008). The default temperature in all simula- tions was set to 34C and the integration time step to 0.025 ms.
2.7 | Correcting for calcium ion concentration, temperature, and LJP
Before integrating published parameters from different sources into thein silico synapse model, they were corrected for differences in experimental protocols. This included scalings for [Ca2+]olevels differ- ent from 2 mM, temperatures different from 34C and the correction of holding and SS potentials by the theoretical LJP.
Levels of [Ca2+]oimpact the neurotransmitter release probability.
The correspondingin silicocorrection was applied by scaling the abso- lute release probabilityUSEparameter (see above) of the synapses, using the Hill isotherm withn= 4 (Hill, 1910). The Hill equation below describes the nonlinear increase in release probability as a function of increasing [Ca2+]o:
USE=USEmax Ca2 + h i4
0
K41=2+hCa2 +i4 0
ð12Þ
whereUSEmaxis the maximum value of the release probability (≤1) at high [Ca2+]oandK1/2is the [Ca2+]oat whichUSEis one-half ofUSEmax. USEmaxandK1/2parameters can be fit to data points (e.g., an indicator of release probability—the ratio between PSP amplitudes) measured at different [Ca2+]os.K1/2values were taken from Rozov, Burnashev, Sakmann, and Neher (2001), 2.79 (mM) for steep and 1.09 (mM) for shallow calcium dependence and were shown to generalize well for other characterized pathways of the neocortex (see Markram et al. (2015), supplementary figure S11). In the absence of hippocampus specific data, we followed the approach of Markram et al. (2015) and assumed a steep dependence in PC to PC and PC to distal dendrite targeting inhibitory (O-LM) cells, and a shallow dependence between PC to proximal targeting cells (PVBC (PV+ basket cell), CCKBC (CCK+
basket cell), and axo-axonic cell). For experimentally uncharacterized pathways, an intermediate calcium dependence was used, as the aver- age of the steep and shallow ones. This intermediate curve was in agreement with the few relevant data points for specific hippocampal synaptic connections (Price, Scott, Rusakov, & Capogna, 2008; Tyan et al., 2014). The temperature dependence of kinetic parameters such as rise and decay time constants was corrected by dividing them with Q10 scaling factors:
τsim=τexp=Q10ðTsim−TexpÞ=10 ð13Þ
where τ is the time constant, Q10 is an empirically determined, receptor-specific parameter,Tsim= 34C is the temperature used in the simulations, whileTexp<Tsimis the temperature of the experiment.
The Q10 correction was only needed for the NMDA current between connected PCs (see above) because all other kinetic values that we used were recorded at near physiological temperature (34C).
Holding and SS potentials were corrected by the theoretical LJP (Neher, 1992). These potentials arise from the differences in solutions in the pipette and bath and are in 2–12 mV range for the standard solutions. Theoretical LJPs, calculated from the reported pipette and bath solutions were obtained from Moradi and Ascoli (2020).
2.8 | Statistical analysis
Rvalues for validating matching experimental and model values are Pearson correlations. Data are presented as mean ±SD to yield
comparable values to the experimental ones. USE,D,Fdistributions from two different sources (e.g., found in the literature vs. fitted here) are said to be comparable if the mean of the second distributions is not further away than one-half of theSDof the first distribution.
3 | R E S U L T S
3.1 | Literature curation
First, we undertook an extensive literature review of paired recording experiments, and compiled data on the various parameters (Figure 1, Step 1; Tables 1 and 2 for the data inclusion and exclusion criteria, and a list of data and modeling assumptions, respectively; see also Supple- mentary Table S1 for voltage-clamp data from rat hippocampal CA1, and S2 for current-clamp recordings). The data collected in this manner is sparse and inhomogeneous, due to the disparate experimental condi- tions used by different groups and were, therefore, corrected for vari- ous aspects (Figure 1, Step 2). For example, [Ca2+]ois known to affect release probability and, therefore, an additional Hill scaling had to be considered while parameterizing STP models (see Section 2.7). Rise and decay time constants of synaptic currents are influenced by tempera- ture differences but can be corrected with Q10 factors (see Section 2.7).
For electrophysiological recordings, patch pipettes have become the method of choice over sharp electrodes, which necessitates applying an LJP correction for voltage traces (see Section 2.7).
3.2 | Synaptic model parameters
We integrated the collected and corrected data into a model of synap- tic transmission that includes STP and stochastic neurotransmitter release. We found that for some connection types the parameters of this model could be fully determined by employing in silico paired recordings (Figure 1, Step 3). Yet, for the majority of connection types parameters had to be extrapolated (Figure 1, Step 4). We use“syn- apse”to refer to a single anatomical synaptic contact and“connec- tion” to indicate the collection of all synaptic contacts between a given presynaptic and postsynaptic neuron, comprising one or more synapses.
The underlying synapse model consisted of several parts, each with their associated parameters, which we determined in a six-step procedure: We modeled synaptic connections with biexponential con- ductances requiring 8 parameters. Three parameters (Erev,τrise,τdecay) were directly obtained from the literature (see Supplementary Table S1 for AMPAR and GABAR rise and decay time constants, methods for NMDAR time constants, and Supplementary Table S2 for reversal potentials (Moradi & Ascoli, 2020)). In particular, for theτdecay (Supplementary Table S1) with the exception of Maccaferri, Roberts, Szucs, Cottingham, and Somogyi (2000) who used either single or weighted biexponential fits, none of the other studies we considered explicitly reported howτdecaywas extracted. Therefore, we extrapo- lated single exponential fits τdecay of all pathways, which were
measured through somatic voltage-clamp recordings. We used these measurements directly as dendritic PSC time constants without any correction for attenuation (Table 2). STP was modeled with the TM model, which added three parametersUSE,D,F) to a synaptic connec- tion type. They were fit in conjunction to the experimentally observed STP behavior (Figure 2, Step 4; see Section 2.4). Stochastic synaptic transmission was modeled by extending the TM model to include quantal release from multiple sites. This added another parameter (NRRP) that was fit to the observed variability of PSC amplitudes of experimental traces in terms of their CV (SD/mean; Figure 2, Step 5;
see Section 2.5). Finally, the mean amplitude of PSPs depended on three of the parameters and thus could be fit to the peak synaptic conductance (bg) only after the other two parameters had been deter- mined (Figure 2, Step 6).
In addition to the parameters of synaptic models, the physiology of PSPs is also dependent on several anatomical parameters, which result from the single-cell and tissue modeling workflow (see Sec- tion 2.2; Supplementary Figure S1). To ensure the accuracy of the fitted synaptic parameters we independently validated aspects of the modeled anatomy (Figure 2, Steps 1 and 2). In the following sections, we present the results of the anatomical validations, followed by the results of the various fits of synaptic parameters.
3.3 | Validation of synaptic anatomy and dendritic attenuation
The anatomical properties of synaptic connections such as number of synapses per connection and axo-dendritic innervation patterns, along with the dendritic properties of single cell models were validated against experimental data (Figure 3). Pairs of synaptically connected neurons were sampled from a dense tissue-level reconstruction of the rat hippocampal CA1 region (see Section 2.1, Supplementary Figure S1, Figures 3a and 4a). The number of synapses per connection for the handful of experimentally characterized pathways (Ali, 2011; Biró,
Holderith, & Nusser, 2005; Buhl, Halasy, & Somogyi, 1994; Buhl, Han, et al., 1994; Deuchars & Thomson, 1996; Földy, Lee, Morgan, &
Soltesz, 2010; Maccaferri et al., 2000; Sik, Penttonen, Ylinen, &
Buzsáki, 1995; Vida, Halasy, Szinyei, Somogyi, & Buhl, 1998) was con- sistent with biological data (r= 0.98; Figure 3b and Supplementary Table S3). The mean number of synapses per connection for thein silico pathways that have been experimentally characterized are as follows:
Excitatory to excitatory (E-E): 1.26 ± 0.6; inhibitory to excitatory (I-E):
8.2 ± 2.1; excitatory to inhibitory (E-I); only connections between PC to O-LM cells): 2.8 ± 1.2; inhibitory-inhibitory (I-I): 2.8 ± 0.2 (Supplementary Table S3). A systematic, quantitative characterization of axo-dendritic innervation profiles for hippocampal CA1 synaptic con- nections is largely lacking. Therefore, although we derived many predic- tions of axo-dendritic innervation profiles from in silico synaptic pathways, these could, however, only be validated based on anecdotal evidence (Figures 3a and 4a). In addition, we sampled neuron pairs at intersomatic distances of 0–200μm to predict their connection proba- bility and number of synapses per connection (Figure 3c,d). The upper bound of 200 μm ensured that we obtained a sufficient number (100≤n≤5, 000) of pairs for all connections, even where the pre–post neurons were in different layers, for example, Schaffer collateral- associated and OLM cells to PC connections. Although the perforant path-associated cell to PC connections occur in our model, they were excluded in these analyses since their somata are farther apart than the general 200μm distance criteria chosen for these predictions.
Finally, we also validated the dendritic attenuation profile of PSPs in single neuron models of PCs, which were also found to be consis- tent with experimental data (Magee & Cook, 2000) (τmodel= 235.2, τexp= 155.6, Supplementary Figure S2).
3.4 | STP of synapses
The synaptic physiology of hippocampal CA1 connections expresses a rich diversity of STP profiles in response to presynaptic AP trains at
F I G U R E 1 In silicodata integration pipeline. (1) 51 peer-reviewed papers, spanning 21 years were used to compile data on various parameters of connected neurons in rat CA1 including connection probability, number of synapses per connections, axo-dendritic innervation profile, kinetics, STP profiles, calcium and temperature sensitivity. (2) Parameters were integrated into a common framework and experimental paradigm, including temperature, [Ca2+]oand liquid junction potential (LJP) corrections. TM models of STP were fit to publicly available raw traces. (3)In silicopaired recordings were run to correctly adjust the unitary peak conductance of connections with experimentally characterized postsynaptic potential (PSP) amplitudes. (4) The resulting parameters were averaged within each of the nine classes of synapses and used predictively to describe experimentally uncharacterized pathways [Color figure can be viewed at wileyonlinelibrary.com]
different stimulus frequencies (Ali, Bannister, & Thomson, 1999; Ali, Deuchars, Pawelzik, & Thomson, 1998; Ali & Thomson, 1998; Éltes, Kirizs, Nusser, & Holderith, 2017; Kohus et al., 2016; Losonczy et al., 2002; Pouille & Scanziani, 2004). However, to the best of our knowledge, only Losonczy et al. (2002) reported TM model parame- ters for CA1 pathways and used an additional recovery spike elicited about 500–100 ms after the last spike in the train, which is crucial to characterize frequency-dependent STP profiles of depression and facilitation (Gupta, Wang, & Markram, 2000). Published STP parame- ters from Losonczy et al. (2002) were used for PC to BC pathways, after refitting a subset of their data, and ensuring their consistency with our resultingUSE,D,Fvalues (see Section 2). The dataset from Kohus et al. (2016) were obtained in the mouse CA3 region at 1.6 mM [Ca2+]o, which differs from the rest of the datasets we considered, we never- theless made use of this resource due to the availability of their raw data, which was subsequently used in our procedure of fitting TM model parameters (see Section 2.4; Table 1 for data inclusion and exclu- sion criteria; Table 2 for a list of data and modeling assumptions). The resulting TM model parameters following the fitting procedure were consistent with those in the source dataset (Kohus et al., 2016). In addi- tion, we were able to match the CVs of the first PSC amplitudes (r= 0.8; Figure 4b, Supplementary Table S4), by calibratingNRRP(see Loebel et al. (2009); Barros-Zulaica et al. (2019) and Section 2.5) with the resulting values ofNRRPin a biologically plausible range. An elegant study demonstrated that under experimental conditions to induce high neurotransmitter release probability (high Mg/Ca) CCKBC to PC con- nections in CA3 are characterized by MVR (withNRRP= 5−7 vesicles)
(Biró, Holderith, & Nusser, 2006). However, univesicular release (UVR, NRRP = 1) is more prevalent under physiological conditions (Biró et al., 2006). Thein silicoCV of CCKBC to PC PSCs withNRRP= 1 com- pared well against experimental data obtained under physiological con- ditions. In the cases of synaptic connections from PVBC to PC and PVBC, a value larger than 1 (NRRP= 6) vesicles were required (see Sec- tion 2.5; Figure 4b). For pathways not present in the Kohus et al.'s (2016) dataset, theNRRPcould not be calibrated and was thus assumed. The assumption of MVR with NRRP= 2 vesicles at each excitatory to excitatory connections was used in this study (Barros- Zulaica et al., 2019; Christie & Jahr, 2006; Conti & Lisman, 2003; Tong
& Jahr, 1994), while UVR was assumed at all other noncalibrated pathways (see Gulyás et al. (1993); Biró et al. (2005) suggesting UVR for certain PC to interneuron connections).
Based on the literature and our model fitting, we identified sev- eral rules to group STP profiles. The mapping of STP profiles for all pathways is as follows: PC to O-LM cells (Ali & Thomson, 1998; Biró et al., 2005; Losonczy et al., 2002; Pouille & Scanziani, 2004) and other interneurons in stratum oriens (Éltes et al., 2017) E1 (excitatory facilitating). PC to PC (Deuchars & Thomson, 1996), PC to all SOM interneurons (Ali et al., 1998; Losonczy et al., 2002; Pouille &
Scanziani, 2004) E2 (excitatory depressing). CCK+ interneurons to CCK + interneurons (Ali, 2007, 2011; Kohus et al., 2016) I1 (inhibitory facilitat- ing), PV+ and SOM+ interneurons to PC (Ali et al., 1998, 1999; Bartos et al., 2002; Buhl, Cobb, Halasy, & Somogyi, 1995; Daw, Tricoire, Erdelyi, Szabo, & McBain, 2009; Kohus et al., 2016; Maccaferri et al., 2000;
Pawelzik et al., 2002) as well as interneurons to interneurons (except the T A B L E 1 Data inclusion and exclusion criteria
Data inclusion criteria
1 For the characterization of number of the synapses per connections, we used published values from anatomical studies employing electron and light microscopy; in rat CA1 slices.
2 For the validation of our axo-dendritic innervation patterns, we used figures from published studies with biocytin-filled pairs; under light microscopy; in rat CA1 slices.
3 For the characterization of synaptic physiology, we prioritized data from: Paired recordings from identified m-types; in rat CA1 slices; at 2 mM [Ca2+]o; and 34C; with reported holding/SS potential; and reported LJP or recording solutions.
4 For the parametrization the decay time constant of single PSCs, we used published decay time constant fits (independent of the model, e.g., single vs. biexponential fit).
5 For fitting the TM model, we used average raw PSC traces as well as published peak PSC amplitudes; with 10 spikes at different frequencies plus a recovery spike.
6 For the validation of the TM model, we used published fits from the neocortex (Markram et al., 2015) in order to compareUSE,D,Fvalues of the corresponding pathways.
7 For the estimation of theNRRP, we used raw PSC traces (all trials) to estimate the CV of the first peak PSC amplitude as well as publishedNRRP
estimates.
8 For the calibration of peak synaptic conductance amplitudes, we used published peak PSP amplitudes (see Supplementary Table S2).
9 For the validation of the peak synaptic conductances, we used single-receptor conductance and receptor number estimates.
Data exclusion criteria
10 In the case of multiple reports of a single parameter or reference data, we prioritized publications which were already used for other parameters and excluded the others (see, e.g., (Pawelzik, Hughes, & Thomson, 2002) in Supplementary Table S2).
11 When we had access to individual PSP amplitudes beyond the usually reported mean ±SD, we excluded outliers and used the updated mean ±SDas target PSP amplitude (see Supplementary Table S5).
CCK+ ones) (Bartos et al., 2002; Daw et al., 2009; Elfant, Pal, Emptage, &
Capogna, 2008; Karayannis et al., 2010; Kohus et al., 2016; Price et al., 2005) I2 (inhibitory depressing). CCK+ and NOS+ (only Ivy cells, since we lack NGF morphologies) to PC (Fuentealba et al., 2008; Kohus et al., 2016; Price et al., 2008) I3 (inhibitory pseudo linear). The parameters of the groups and the resulting dynamics are summarized in Table 3 and Figure 5.
Neurotransmitter release probability and the STP profile are not only sensitive to the recording temperature and the developmental age but also [Ca2+]o (Guzman, Schlögl, Frotscher, & Jonas, 2016;
Rozov et al., 2001; Williams & Atkinson, 2007). Therefore, we modeled [Ca2+]o sensitivity with a highly nonlinear scaling of USE
(absolute release probability) values (see Section 2.7). As an exemplar result of this additional modeling detail, the PC-to-PC pathway exhibits an E3 (excitatory pseudolinear) STP profile characterized by low PSP amplitudes with high trial-by-trial variability and failures at in vivo like [Ca2+]olevels (1.1–1.3 mM) compared to thein vitrolevels (2–2.5 mM) E2 (excitatory depressing) profile (Supplementary
Figure S2b). USEvalues are scaled by a Hill isotherm (see Section 2.7) parameterized with data from PSP amplitudes in neocortex (Markram et al. (2015), supplementary figure S11), which is an indirect measure of the release probability. Here, we have shown that applying this Hill iso- therm directly to theUSEvalues indeed results in the same scaling pro- file of PSP amplitudes in the case of PC-to-PC connection (Supplementary Figure S3a).
3.5 | Calibration of peak synaptic conductances to match PSP amplitudes
There is a dearth of studies characterizing both the PSC and PSP amplitudes for the same connections in rat hippocampal CA1 (com- pare Supplementary Tables S1 and S2). Therefore, we only used PSP amplitudes that were measured experimentally to calibrate thein silico peak synaptic conductances in order to match thein vitroPSPs (Ali et al., 1998; Ali & Thomson, 1998; Cobb et al., 1997; Deuchars &
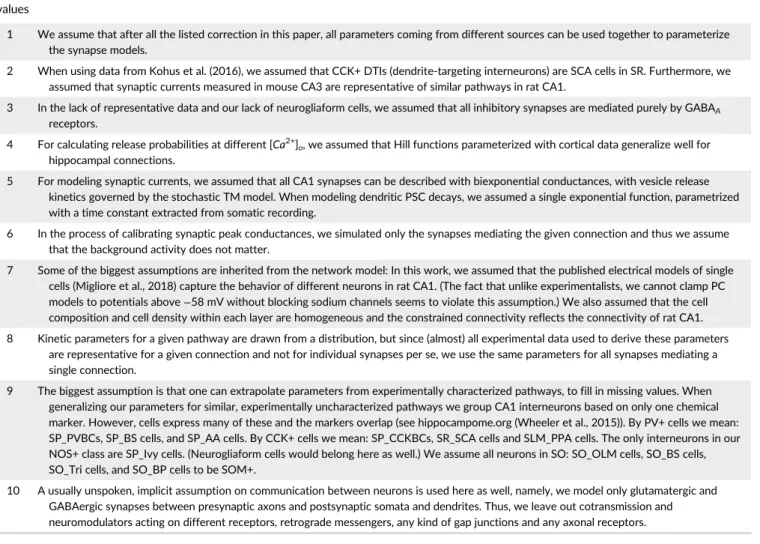
T A B L E 2 List of assumptions. All the assumptions that were made to arrive at model parameters from a sparse set of raw data and published values
1 We assume that after all the listed correction in this paper, all parameters coming from different sources can be used together to parameterize the synapse models.
2 When using data from Kohus et al. (2016), we assumed that CCK+ DTIs (dendrite-targeting interneurons) are SCA cells in SR. Furthermore, we assumed that synaptic currents measured in mouse CA3 are representative of similar pathways in rat CA1.
3 In the lack of representative data and our lack of neurogliaform cells, we assumed that all inhibitory synapses are mediated purely by GABAA receptors.
4 For calculating release probabilities at different [Ca2+]o, we assumed that Hill functions parameterized with cortical data generalize well for hippocampal connections.
5 For modeling synaptic currents, we assumed that all CA1 synapses can be described with biexponential conductances, with vesicle release kinetics governed by the stochastic TM model. When modeling dendritic PSC decays, we assumed a single exponential function, parametrized with a time constant extracted from somatic recording.
6 In the process of calibrating synaptic peak conductances, we simulated only the synapses mediating the given connection and thus we assume that the background activity does not matter.
7 Some of the biggest assumptions are inherited from the network model: In this work, we assumed that the published electrical models of single cells (Migliore et al., 2018) capture the behavior of different neurons in rat CA1. (The fact that unlike experimentalists, we cannot clamp PC models to potentials above−58 mV without blocking sodium channels seems to violate this assumption.) We also assumed that the cell composition and cell density within each layer are homogeneous and the constrained connectivity reflects the connectivity of rat CA1.
8 Kinetic parameters for a given pathway are drawn from a distribution, but since (almost) all experimental data used to derive these parameters are representative for a given connection and not for individual synapses per se, we use the same parameters for all synapses mediating a single connection.
9 The biggest assumption is that one can extrapolate parameters from experimentally characterized pathways, to fill in missing values. When generalizing our parameters for similar, experimentally uncharacterized pathways we group CA1 interneurons based on only one chemical marker. However, cells express many of these and the markers overlap (see hippocampome.org (Wheeler et al., 2015)). By PV+ cells we mean:
SP_PVBCs, SP_BS cells, and SP_AA cells. By CCK+ cells we mean: SP_CCKBCs, SR_SCA cells and SLM_PPA cells. The only interneurons in our NOS+ class are SP_Ivy cells. (Neurogliaform cells would belong here as well.) We assume all neurons in SO: SO_OLM cells, SO_BS cells, SO_Tri cells, and SO_BP cells to be SOM+.
10 A usually unspoken, implicit assumption on communication between neurons is used here as well, namely, we model only glutamatergic and GABAergic synapses between presynaptic axons and postsynaptic somata and dendrites. Thus, we leave out cotransmission and neuromodulators acting on different receptors, retrograde messengers, any kind of gap junctions and any axonal receptors.
Thomson, 1996; Fuentealba et al., 2008; Pawelzik et al., 2002;
Pawelzik, Bannister, Deuchars, Ilia, & Thomson, 1999) (see Figure 3d and Table 3). Having parameterized all relevant anatomical and physi- ological synaptic properties including the number of synapses per con- nections, axo-dendritic innervation patterns, PSC rise and decay time constants, STP parameters, NRRP, NMDA/AMPA peak conductance ratio, and reversal potential, we undertookin silicopaired recordings by following a sequence of steps. A connected pair of neurons within a pathway specific intersomatic distance (usually100μm) for a given pathway was sampled from the hippocampal CA1 model, the postsyn- aptic neuron was current clamped to a pathway-specific SS potential (see Supplementary Table S2), an AP was elicited in the presynaptic neuron, which caused a postsynaptic response, measured in the soma.
After repeating this sequence for multiple pairs of the same pathway (n= 50) with many trials (n= 35), we derived the peak synaptic con- ductance value that yielded the reference mean experimental PSP amplitude (see Section 2.6). Next, we repeated the same protocol on a set of 50 randomly selected pairs with the calibrated peak conduc- tance values as a validation of our approach (r= 0.99; Figure 4c and Supplementary Table S5).
As an independent external validation of the peak conductances, we compared them against sparse published data estimating single- receptor conductance and receptor numbers in excitatory synapses on PCs. Hippocampal CA1 PCs receive most of their inputs from CA3 PCs through the Schaffer collaterals (Megías, Emri, Freund, &
Gulyás, 2001; Takács et al., 2012), whereas in this study we only con- sidered intrinsic connections—for example, excitatory connections between local CA1 PCs—and not long-range extrinsic projections.
Thus, single-receptor conductances and receptor number estimates from the Schaffer collateral synapses were assumed to generalize for the intrinsic PC-to-PC connections. Using nonstationary fluctuation analysis on EPSCs recorded in outside-out dendritic membrane pat- ches, (Spruston, Jonas, & Sakmann, 1995) estimated peak single- receptor conductances of 10.2 pS and 43.5 pS for AMPARs and NMDARs, respectively. Based on these numbers, our calibrated values resulting in a peak AMPAR conductance of 0.6 ± 0.1 nS is the net result of59 AMPARs per synaptic contact. Based on an experimen- tally measured NMDAR/AMPAR peak conductance ratio of 1.22 (Myme et al., 2003), we predict that there are about18 NMDARs constituting a single synaptic contact between CA1 PCs. Ourin silico predictions are consistent with experimental studies that estimate 58–70 AMPA and 5–30 NMDA receptors (Jonas, Major, &
Sakmann, 1993; Matsuzaki et al., 2001; Nusser et al., 1998; Spruston et al., 1995). Taken together, these experimental datasets enable an independent validation of the calibrated peak conductance of PC-to- PC connections in CA1. In addition, we also predict an average GABA peak conductance of 2 ± 1 nS at a single inhibitory synaptic contact comprising100 GABAergic receptors, which is also in good agree- ment with previous estimates (Mody & Pearce, 2004).
3.6 | Parameter extrapolation
By integrating all the synaptic parameters and performing paired recordingsin silico, we procured a dataset of 16 pathways (Table 3).
The number of theoretically possible pathways (based on 12 m-types) in our CA1 circuit model is 144; however, only 102 of these are bio- logically viable based on the extent of axo-dendritic overlap (Figure 3c,d). Therefore, the parameters of the remaining 90% of the pathways had to be extrapolated. We generalized the anatomical properties of synapses (number of synapses per connection, connec- tion probability, bouton density, innervation profile) obtained from the fraction of characterized to the remainder of uncharacterized pathways as shown previously (Markram et al., 2015; Reimann et al., 2015). However, for STP profiles of hippocampal connections obtained from studies that reported measurements of paired-pulse F I G U R E 2 In silicosynapse model and parameter fitting:
Properties of the network (left) and the parameters synapse model (right) determine certain features of the emergent postsynaptic potentials (PSPs) (middle). (These PSP features are schematized at the bottom of the figure. Individual trials are shown in gray and their average postsynaptic voltage trace in black.) These dependencies between properties/parameters and PSP features (indicated by arrows, and dots where they join and continue as a single arrow) were used to fit the synapse model parameters to data in six steps. Left:
Parts of the network model that affect these features such as biophysical and anatomical neuron models via dendritic attenuation (1) as well as dendritic innervation and the number of synapses per connection (2) are independently validated. Top right: Parameters of the model of postsynaptic conductance are taken from averaged experimental PSC traces (3). Middle right: The TM model of STP adds three parameters that are fit to observed STP behavior (4). Bottom right: The model of stochastic quantal release adds another parameter fit to the observed CV of PSP amplitudes (5). In the last step, peak synaptic conductances are calibrated to match PSP amplitudes from data (6). Numbers on arrows indicate that the given parameter was validated against—or fitted to data, while numbers on boxes indicate that the parameters were taken from literature and directly plugged in into the model [Color figure can be viewed at wileyonlinelibrary.com]
(a)
(a1)
(a2) (a4)
(b) (c) (d)
F I G U R E 3 In silicosynapse anatomy. (a) A representativein silicoO-LM (purple) to PC (blue) pair, with synapses visualized in red. 3D morphologies were reconstructed with the Neurolucida software by the members of the Thomson/Mercer lab (Migliore et al., 2018). (a1) Branch order distribution (n= 5, 000 connections) of the presynaptic (O-LM) axons. (a2) Branch order distribution of the postsynaptic (PC) tuft dendrites.
(a3) Distribution of the number of synapses per connection of thein silicoO-LM to PC pathway.In vitroexperimental data is indicated in red. (a4) Distance-dependent connection probability of thein silicoO-LM to PC pathway. (b) Validation of the number of synapses per connection against experimental data. (E: excitatory, I: inhibitory, e.g.,: I-E: inhibitory to excitatory pathways.) Dashed gray line represents perfect correlation between experimental and model values. (c) Predicted mean number of synapses per connections for all pathways in the full-scale CA1 network model. Only connections with≤200μm intersomatic distance were used to calculate the average. Averages were calculated from 100≤n≤5, 000 pairs. White boxes represent connections that are not present in the circuit model due to the lack of axo-dendritic overlap (given the
≤200μm intersomatic distance sampling criteria). Experimentally measured values (same as on its left) are highlighted with black rectangles. Layer abbreviations: SR, stratum radiatum; SP, stratum pyramidale; SO, stratum oriens. M-type abbreviations: AA, axo-axonic cell; BP, back-projecting cell; BS, bistratified cell; CCKBC, CCK+ basket cell; Ivy, ivy cell; OLM, oriens-lacunosum moleculare cell; PC, pyramidal cell; PVBC, PV+ basket cell; PPA, performant path-associated cell; SCA, Schaffer collateral-associated cell; Tri, trilaminar cell (see Supplementary Methods). (d) Predicted mean connection probability (within 200μm intersomatic distance) for all pathways in the CA1 network model. M-type abbreviations, white boxes, black rectangles, and number of pairs are as in (c) [Color figure can be viewed at wileyonlinelibrary.com]
(a) (b)
(c)
(d)
(e)
(f1) (f2) (f3)
(f4) (f5) (f6)
In silicoIn silico
F I G U R E 4 In silicosynapse physiology. (a)In silicopaired recording experiment with the STP protocol used in Kohus et al. (2016). Presynaptic (PVBC) voltage trace is shown on top.In silicoPVBC (green) to PC (blue) pair, with synapses visualized in red in the middle. 3D morphologies were reconstructed with the Neurolucida software by the members of the Thomson/Mercer lab (Migliore et al., 2018). Postsynaptic (PC) experimental traces recordedin vitro(in gray) and their mean in red, as well as model traces recordedin silico(in gray) and their mean in blue, are presented at the bottom panel. Insets show the variance of the first IPSCs. (b) Validation of the CV of the first PSC amplitudes (excluding failures) against experimental data. (E: excitatory, I: inhibitory, e.g.,: I-E: inhibitory to excitatory pathways.) Dashed gray line represents perfect correlation between experimental and model values. (c) Validation of the postsynaptic potential (PSP) amplitudes against experimental data. (d) Predicted CVs of first PSC amplitudes (excluding failures) for all pathways in the CA1 network model after synapse parameter generalization. As in Figure 3c, only connections with≤200μm intersomatic distance were used to calculate the average postsynaptic response fromn= 20 pairs with 35 repetitions for each pair. Postsynaptic cells were held at−65 mV inin silicovoltage-clamp mode. M-type abbreviations, white boxes, and black rectangles are as in Figure 3c. (e) Predicted PSP amplitudes for all pathways in the CA1 network model after synapse parameter generalization.
Then, 20 pairs with 35 repetitions for every possible connection. Postsynaptic cells were held at−65 mV steady-state potential inin silico current-clamp mode. Consistent with Gulyás et al. (1993), PC to interneurons are the strongest. M-type abbreviations, white boxes, black rectangles and number of pairs are as in (d). (f) Properties of postsynaptic (PC) IPSPs from 100 PVBC to PC pairs with 35 repetitions each. (f1) Distribution ofin silicoPSP amplitudes.In vitroexperimental data from Pawelzik et al. (2002) is indicated in red. (f2) Distribution ofin silicoPSP 10–90% rise times. (10–90% rise time constants of PSCs are fixed to 0.2 ms in the model, but the PSP rise times wary.) (f3) Distribution ofin silico PSP decay time constants (single exponential fit). (f4) Distribution ofin silicoPSP latencies. (f5) Distribution of the CVs of the firstin silicoPSP amplitudes (excluding failures). (f6) Distributionin silicofailures (0 measurable PSP amplitude from 35 repetitions) [Color figure can be viewed at wileyonlinelibrary.com]
ratios, but did not provide the raw experimental traces with≥2 pre- synaptic spikes (Ali & Thomson, 1998; Deuchars & Thomson, 1996;
Fuentealba et al., 2008), we applied analogous parameters from the somatosensory cortex (Markram et al., 2015). We performed a prior consistency check of the parameter ranges for similar connection types—perisomatic inhibitory (BCs) to PC, and inhibitory to inhibitory—that have been experimentally characterized in both somatosensory cortex and hippocampus and found them to be com- parable. Therefore, our rationale to generalize four sets ofUSE,D,F
values from the somatosensory cortex to the hippocampus (Table 3) could be justified. Thereafter, we approximated the missing parame- ters with averaged values across specific connection types that were grouped according to neurochemical markers that appear to have sim- ilar STP parameters and peak conductances (Table 3). For example, it is known that excitatory synapses on distal dendrite targeting inter- neurons, which predominantly express SOM—such as PC to O-LM connections—are mostly facilitating, and on the contrary inhibitory synapses from SOM+ neurons to PCs are strongly depressing (Ali &
T A B L E 3 Parameters and generalization to nine classes
Pre Post bg τdecay USE D F NRRP
PC to PC (E2)
PC PC 0.6 ± 0.1 3 ± 0.2 0.5 ± 0.02a 671 ± 17a 17 ± 5a 2
PC to SOM+ (E1)
PC OLM 0.8 ± 0.05 1.7±0.14a 0.09±0.12a 138±211a 670±830a 1
PC SOM+ 0.8±0.05 1.7±0.14a 0.09±0.12a 138±211a 670±830a 1
PC to SOM−(E2)
PC PVBC 2 ± 0.05 4.12 ± 0.5 0.23 ± 0.09 410 ± 190 10 ± 11 1
PC CCKBC 3.5 ± 0.4 4.12±0.5 0.23 ± 0.09 410 ± 190 10 ± 11 1
PC BS 1.65 ± 0.1 4.12±0.5 0.23±0.09 410±190 10±11 1
PC Ivy 2.3 ± 0.4 4.12±0.5 0.5 ± 0.02a 671 ± 17a 17 ± 5a 1
PC SOM− 2.35 ± 0.7 4.12±0.5 0.23±0.09 410±190 10±11 1
PV+ to PC (I2)
PVBC PC 2.15 ± 0.2 5.94 ± 0.5 0.16 ± 0.02 965 ± 185 8.6 ± 4.3 6
AA PC 2.4 ± 0.1 11.2 ± 0.9 0.1 ± 0.01 1,278 ± 760 10 ± 6.7 1
BS PC 1.6 ± 0.1 16.1 ± 1.1 0.13±0.03 1,122±156 9.3±0.7 1
PV+ PC 2±0.35 11.1±4.1 0.13±0.03 1,122±156 9.3±0.7 1
CCK+ to PC (I3)
CCKBC PC 1.8 ± 0.3 9.35 ± 1 0.16 ± 0.04 153 ± 120 12 ± 3.5 1
SCA PC 2.15 ± 0.3 8.3 ± 0.44 0.15 ± 0.03 185 ± 32 14 ± 5.8 1
CCK+ PC 2±0.15 8.8±0.25 0.16±0.01 168±15 13±0.5 1
SOM+ to PC (I2)
Tri PC 1.4 ± 0.3 7.75 ± 0.9 0.3±0.08a 1,250±520a 2±4a 1
SOM+ PC 1.4±0.3 8.3±2.2a 0.3±0.08a 1,250±520a 2±4a 1
NOS+ to PC (I3)
Ivy PC 0.48 ± 0.05 16± 2.5 0.32 ± 0.14a 144 ± 80a 62 ± 31a 1
CCK−to CCK−(I2)
PVBC PVBC 4.5 ± 0.3 2.67 ± 0.13 0.26 ± 0.05 930 ± 360 1.6 ± 0.6 6
PVBC AA 4.5±0.3 2.67±0.13 0.24 ± 0.15 1,730 ± 530 3.5 ± 1.5 1
CCK− CCK− 4.5±0.3 2.67±0.13 0.26±0.05 930±360 1.6±0.6 1
CCK+ to CCK+ (I1)
CCKBC CCKBC 4.5±0.3 4.5 ± 0.55 0.11 ± 0.03 115 ± 110 1,542 ± 700 1
CCK+ CCK+ 4.5±0.3 4.5±0.55 0.11±0.03 115±110 1,542±700 1
Note:Synapse parameters either taken from the literature (τdecay(ms)), fitted directly to data (USE,D(ms),F(ms)), calibratedin silico(bg(nS),NRRP) or taken from the somatosensory cortex ((Markram et al., 2015) marked with superscript“a”). Values in theτdecaycolumn which neither appear in Supplementary Table S1 (summarizing rat PSCs) nor are taken from the somatosensory cortex, are from mouse recordings (Daw et al., 2009; Lee et al., 2014). Average class parameters are marked in bold and are used predictively for the remaining pathways belonging to the same class. For cells belonging into the same class, see Table 2, Assumption 9. M-type abbreviations are as in Figure 3c. [Correction added on 12 October 2020, after first online publication: Values in the PC to Ivy row of the above table were updated.]
Thomson, 1998). This exercise resulted in nine synaptic classes, cover- ing all connection types in the CA1 region (Table 3 and Figure 5).
Most of these classes contain few experimentally characterized exam- ples, especially between inhibitory interneurons (Table 3). We have previously shown that averaging STP parameters and peak conduc- tances within synaptic classes is a valid method to extrapolate miss- ing values (Markram et al., 2015; Ramaswamy et al., 2015).
With the integrated and calibrated, but mostly generalized set of parameters (bg,τdecay,USE,D,Fparameters of STP andNRRP; Figure 2) for all pathways in the CA1 model we predicted the CVs of the first PSCs (Figure 4d) and the first PSP amplitudes (Figure 4e), based on previously published cell models (Migliore et al., 2018) and statistically derived connectivity. In addition, we performedin silicopaired record- ings in all possible pre-post combination of m-type-specific pathways (n= 102 biologically viable pathways) to generate detailed predictions of the physiological properties of synaptic transmission including PSP amplitudes, 10–90% rise times, decay time constants, latencies, CV of first PSP amplitude, and percentage of failures (Figure 4f). Although these predictions could provide preliminary insights into the organiz- ing principles of synaptic transmission in hippocampal CA1—in partic- ular, inhibitory pathways, which remain mostly uncharacterized—they require further validation through targeted experiments, for example, employing state-of-the-art multiple whole-cell patch-clamp recordings (Espinoza et al., 2018; Guzman et al., 2016; Perin et al., 2011).
4 | D I S C U S S I O N
Recent advances in high-performance computing have enabled biologically detailed, data-driven reconstructions and large-scale simulations of brain regions (Bezaire, Raikov, Burk, Vyas, &
Soltesz, 2016; Bezaire & Soltesz, 2013; Markram et al., 2015;
Wheeler et al., 2015). Here, we demonstrate that a data-driven workflow grounded in biological first-principles, which was used to reconstruct a biologically detailed model of rat neocortical tissue digitally, can be extended to model other brain regions such as the hippocampal CA1, to reconcile disparate cellular and synaptic data, and to extrapolate from the sparse set of experimentally obtained parameters to predict those of synaptic connections not yet char- acterized experimentally. In this study, we chose a previous imple- mentation of the phenomenological TM model of STP, which is based on the quantal model of neurotransmitter release. The approach was able not only to extract relevant parameters from raw experimental traces, but scaled well to simulate dynamic trans- mission (Markram et al., 2015; Ramaswamy et al., 2012, 2015). In addition, this version of the TM model also enabled us to simulate trial- to-trial fluctuations to recreate, validate, and predict a broad spectrum of synaptic properties for cell-type-specific hippocampal connections including amplitudes, rise and decay times, latency, variability, and response failures (Figure 4f). It is known that [Ca2+]oregulates the neu- rotransmitter release probability, and therefore, the amplitudes of PSPs.
In this study, we adapted the existing data-driven digital reconstruction workflow to reconcile differences in synaptic dynamics that were
characterized at different [Ca2+]olevels. Therefore, we scaled the neu- rotransmitter release probabilities for all pathways that were character- ized at 1.6–2 mM [Ca2+]o(Kohus et al., 2016; Losonczy et al., 2002;
Markram et al., 2015) before calibrating peak conductances to match PSP amplitudes that were measured at 2.5 mM [Ca2+]o, which is more representative of baseline values for hippocampal slice experiments (Ali et al., 1998; Ali & Thomson, 1998; Deuchars & Thomson, 1996;
Fuentealba et al., 2008; Pawelzik et al., 1999, 2002).
In the continuing spirit of bringing together, hippocampal synaptic electrophysiology from published literature a recent complementary study leveraged text-mining techniques to extract the properties of synaptic connections in hippocampal CA1, including PSP amplitudes and peak conductances (Moradi & Ascoli, 2020). The authors have also open-sourced their collection of papers and parameters alongside useful cloud-based tools to calculate reversal potentials and LJPs, of which we took advantage for this paper. However, our approach to data integration from literature demonstrates that synaptic properties reported in the literature such as peak conductances should not be interpreted at face value but require further corrections to account for inadequate space-clamp errors, which could severely underesti- mate their value by twofold to threefold (Markram et al., 2015). Fur- thermore, when integrating data from whole-cell patch-clamp recordings, the interaction between the extracellular bath and intracel- lular pipette solutions, and their influence on the kinetics of ion chan- nel mechanisms used in the in silico single-cell models becomes paramount.
The results we report, to the best of our knowledge, constitute a comprehensive resource, not only for the anatomy but also for the physiology of synaptic connections in the rat hippocampal CA1 region. Consolidation of the state of the literature not only facilitates building detailed models but also highlights knowledge gaps and could help in prioritizing the identification of missing data on CA1 connec- tions, such as PC to interneurons, and between interneurons, which could form diverse presynaptic–postsynaptic combinations of poten- tial CA1 connection types that are crucial in regulating hippocampal oscillations (Klausberger & Somogyi, 2008; Pelkey et al., 2017). Our modeling approach predicts relatively high connection probabilities for interneuron to interneuron connections, and low IPSP amplitudes (see Figures 3d and 4e). However, these predictions need further experimental validation, probably through multiple patch-clamp recordings, which have enabled high-throughput mapping of inhibi- tory circuits not only in the neocortex (Jiang et al., 2015), but also in the dentate gyrus of the hippocampal formation (Espinoza et al., 2018). Indeed, the parameter set presented here should be consid- ered a first draft, with many assumptions and limitations. For example, we assume somatically measured PSC decay time constants for den- dritic synapses without any correction for attenuation, useUSE,D,F values obtained in CA3, generalize NMDA/AMPA peak ratios charac- terized between PCs to all other excitatory pathways, and do not model GABABreceptors. We plan to refine these assumptions system- atically in future versions of our model and overcome limitations by integrating new experimental data when available (see Table 1 for all data inclusion criteria and Table 2 for all explicit limitations). The
presence of blockers such as TTX, QX314, cesium, and gluconate among many others, alter the kinetics of dendritic ion channels, which are active in the subthreshold regime, and thus, are key factors in governing the attenuation of PSPs in active dendrites. However, in our study, the core experimental dataset that was used to calibrate the peak synaptic conductances (Supplementary Tables S2 and S5) were derived exclusively from sharp-electrode recordings where the intracellular medium is devoid of any of the above blockers, and there- fore, the subthreshold regime of the single-cell models are not unduly influenced. Indeed, the effects of blockers on the subthreshold regime will not only become important for future refinements of single-cell
models but also when more experimental data from whole-cell patch clamp recordings are available.
By detailing all the integration steps in this study, we had two main objectives. First, we aimed to demonstrate that published parameters should not be taken at face value without rigorously checking their con- sistency within any modeling framework and the necessity of being abreast of the state-of-the-art experimental techniques. Second, we attempted to emphasize the fact that a growing diversity of experimen- tal standards combined with published literature that provides access to only processed data sets but not raw experimental traces could lead to an inconsistent picture of a fundamental mechanism such as synaptic (c)
(d)
(e)
(f)
(g)
(h)
(i)
(j) (a)
(b)
F I G U R E 5 Summary of synapse diversity in the CA1 network model. Panels represent exemplarin silicopairs from the nine generalized pathways (two for PC to SOM−interneurons). Presynaptic voltage traces are shown in the upper traces of each panel (a–j), while the postsynaptic potentials elicited in 35 trials (in gray) and the average of these trials are superimposed in the lower traces of each panel.
Postsynaptic cells were held at−65 mV steady-state potential inin silicocurrent-clamp mode. Physical dimensions are as follows: decay time constantτdandD,Fdepression and facilitation time constants: ms, peak synaptic conductancebg: nS, while the absolute release probability USEand NMDA/AMPA conductance ratios are dimensionless. (a) PC to PC (E2). (b) PC to O-LM cell (E1). (c) PC to (SP) bistratified cell (E2). (d) PC to CCKBC (E2). (e) O-LM cell to PC (I2). (f) CCKBC to CCKBC (I1). (g) Ivy cell to PC (I3). (h) CCKBC to PC (I3). (i) PVBC to PC (I2). (j) PVBC to PVBC (I2). Vertical scale bars on each panel represent 0.25 mV. Connectivity in the schematic CA1 microcircuit in the middle is simplified for clarity (e.g., most of the interneuron to interneuron connections are missing). Simplified synapses of the pathways shown in the panels around are indicated with gray circles. M-type abbreviations are as in Figure 3c [Color figure can be viewed at wileyonlinelibrary.com]