Pharmaceutics 2020, 12, x; doi: FOR PEER REVIEW www.mdpi.com/journal/pharmaceutics Article
1
Formulation, in vitro and in silico characterization of
2
“nano-in-micro” dry powder inhalers containing
3
meloxicam
4
Petra Party 1, Csilla Bartos 1, Árpád Farkas 2, Piroska Szabó-Révész 1 and Rita Ambrus 1*
5
1 Institute of Pharmaceutical Technology and Regulatory Affairs, Interdisciplinary Excellence Centre, Eötvös
6
street 6, University of Szeged, 6720 Szeged, Hungary; party.petra@szte.hu (P.P.), bartos.csilla@szte.hu
7
(B.CS.), revesz@pharm.u-szeged.hu (P.S.-R.); ambrus.rita@szte.hu (R.A.)
8
2 Centre for Energy Research, Hungarian Academy of Sciences, Konkoly-Thege Miklós street 29-33, 1121
9
Budapest, Hungary; farkas.arpad@energia.mta.hu (Á.F.)
10
* Correspondence: ambrus.rita@szte.hu; Tel.: +36-62-545-572
11
Received: date; Accepted: date; Published: date
12
Abstract:
13
Pulmonary delivery has high bioavailability, a large surface area for absorption and limited
14
drug degradation. Particle engineering is important to develop inhalable formulations to improve
15
the therapeutic effect. In our work, the poorly water-soluble meloxicam (MX) was used as an
16
active ingredient, which could be useful for the treatment of non-small cell lung cancer, cystic
17
fibrosis and chronic obstructive pulmonary disease. We aimed to produce inhalable
18
“nano-in-micro” dry powder inhalers (DPI) containing MX and additives (poly-vinyl-alcohol,
19
leucine). We targeted the respiratory zone with the microcomposites and reached a higher drug
20
concentration with the nanonized active ingredient. We did the following investigations: particle
21
size analysis, morphology, density, interparticular interactions, crystallinity, in vitro dissolution, in
22
vitro permeability, in vitro aerodynamics (Andersen Cascade Impactor), in silico aerodynamics
23
(stochastic lung model). We worked out a preparation method, by combining wet milling and
24
spray-drying. We produced spherical, 3-4 µm-sized particles built up by MX nanoparticles. The
25
increased surface area and amorphization improved the dissolution and diffusion of the MX. The
26
formulations showed appropriate aerodynamical properties: 1.5-2.4 µm MMAD, 72-76% FPF
27
values. The in silico measurements proved the deposition in the deeper airways. The samples were
28
suitable for the treatment of local lung diseases.
29
Keywords: dry powder inhaler, nano, meloxicam, wet milling, spray-drying, Andersen Cascade
30
Impactor, in silico assessment
31 32
1. Introduction
33
The main advantages of pulmonary delivery are the result of the huge surface area of the lung
34
(100 m2) with a thin absorption layer (0.1-0.2 µm), and low metabolic activity. Targeted delivery of
35
the drug could provide benefits such as achieving a greater local concentration at the target site
36
with a reduced dose, resulting in reduced systemic side effects and adverse events [1]. Local
37
delivery is especially effective in patients with serious pulmonary diseases such as asthma, cystic
38
fibrosis (CF), chronic obstructive pulmonary (COPD) disease and lung cancer [2].
39
For the application of inhaled medications, dry powder inhalers (DPI) are more widely used,
40
compared to nebulizers or metered-dosed inhalers (MDI). DPI products are solid-state, therefore
41
they have long term stability. The delivery is driven by the inhalation flow, thus DPI-s are
42
environmentally friendly, they do not require a compressor or propellant. The administration time
43
is very short, the devices are cheap and portable [3]. Unfortunately, drug deposition in the
44
pulmonary region is not sufficient with the traditional carrier-based DPI inhalers. In these systems,
45
the active ingredient is attached to the surface of a carrier, which is usually lactose, but it could be
46
mannitol or glucose too. The potentiality of the powders is proper dispersion in the respiratory
47
system, so the aerosolization of the products should be optimized. Hence new carrier-free DPI
48
systems have been developed to enhance the therapeutic effect. To reach efficient deposition, DPI
49
should contain a powder made of the active pharmaceutical ingredient (API) co-formulated with
50
appropriate excipients, which are chosen based on their functions in the powder, leading to optimal
51
aerodynamic properties [4]. Excipients approved for DPI formulations are for example hydrophobic
52
additives (Mg-stearate) for protection against moisture, lipids (cholesterol) for coating, amino acids
53
(leucine) for improved aerosol efficiency, absorption enhancers (cyclodextrins, chitosan) and
54
biodegradable polymers (PLGA) for stability and released formulations [2].
55
Besides the components, the particle size and dispersibility of DPI-s have a key role in the
56
deposition pattern. There are three principal mechanisms of particle deposition in the lung. Inertial
57
impaction affects particles that are larger than 5 µm. These particles are not able to follow the
58
changes of gas flow direction in the upper airway and at the airway bifurcations. Therefore, the
59
particles impact on upper airways walls, limiting the amount of API that can be delivered into the
60
lung. Gravitational sedimentation is based on the settling of particles under the action of gravity
61
and occurs in the smaller airways and where the distance is covered by the particles before they hit
62
the wall of the airways. This deposition mechanism is the most effective for particles in the size of
63
1–8 µm. DPIs in this size range are best suited to treat central and small airways. Random motions
64
of the particles caused by their collisions with gas molecules result in deposition by Brownian
65
diffusion. Unlike deposition by impaction and sedimentation, which increase with increasing
66
particle size, deposition by Brownian diffusion rises with decreasing particle size and becomes the
67
dominant mechanism of deposition for particles less than 1 µm in diameter. These particles are
68
effective in the alveolar region of the lung, where air velocities are low [5]. Particles under usually 1
69
µm get exhaled. In conclusion, the requested particle size range in pulmonary therapy is a particle
70
diameter of 1-5 µm.
71
Nanoparticles are a beneficial formulation for Class II drugs of the Biopharmaceutics
72
Classification System (BCS), where the dissolution rate is the rate-limiting step for absorption. The
73
reduction of particle size can increase the dissolution rate since the amount of API dissolving over
74
time is inversely correlated with the particle diameter. For this reason, nanoparticle formulations of
75
API are being assessed for their potential to increase the drug dissolution rate as a result of higher
76
specific surface area. If we formulate the nanosized API into micrometric particles, we can target
77
the proper parts of the airways and when the powders contact with the lung lining fluid, the
78
particles can disintegrate into their nano subunits and spread on the surface of the epithelium,
79
resulting in a large surface area for drug dissolution, and therefore increased absorption and more
80
homogenous distribution [6]. A prosperous formulation for nanoparticle agglomerates is the
81
preparation of nanosuspensions by wet milling followed by solidification, using spray-drying. They
82
are reproducible, scalable, cost and time-effective preparation methods. We can combine the
83
advantages of nanonized particles by preparing a nanosuspension (i.e. enhanced dissolution and
84
solubility) with the benefits of solid formulations (i.e. stability, easier handling, enhanced patient
85
compliance) by producing microsized nanoparticle agglomerates suitable for pulmonary delivery
86
[7].
87
Our research group had experiences with meloxicam (MX) as an API and different additives,
88
such as polymers and amino acids. In this work, we used MX, which is a poorly water-soluble (in
89
water, 7.15 mg/L at 25 °C), non-steroidal anti-inflammatory agent [8]. In pulmonary therapy it
90
could be useful to treat CF, COPD and non-small-cell lung cancer [9], [10], [11], [12]. Previous
91
studies were about particle size reduction of meloxicam with wet milling using poly-vinyl-alcohol
92
(PVA) solution as a dispersant [13]. In the presence of PVA, the particle size of the drug could be
93
reduced to the nanometre range. In the case of co-spray-dried DPI formulations, PVA exerted an
94
aggregation inhibitor effect, thereby providing individual particles [14]. L-leucine (LEU) was
95
applied to enhance the dispersity of the particles and thereby improve the aerosolization and the
96
flowability of the powders [15], [16]. Our works correlated with the positive effect of LEU on the
97
aerodynamic properties, due to LEU decreases the deposition in the upper airways and increased
98
the emitted fraction during inhalation [17], [18].
99
In the following work, we formulated micrometer-sized carrier-free DPI-s using spray-drying,
100
containing previously nanonized active ingredient by wet milling. The novelty of the present work
101
is the “nano-in-micro” structure of the DPI. We did the morphology, rheology, structure,
102
dissolution, diffusion and aerodynamic characterization of the samples. We wanted to target the
103
respiratory zone with the micrometric particles. Thanks to the particle size reduction of the poorly
104
water-soluble MX and therefore the increase of the specific surface area, we could improve the local
105
dissolution in the lung fluid and permeability to the epithelium. Our product could provide an
106
effective treatment for serious local pulmonary diseases.
107
2. Materials and Methods
108
2.1. Materials
109
Meloxicam (MX) (Egis Pharmaceuticals PLC., Budapest, Hungary) was used as an active
110
ingredient. As additives poly-vinyl-alcohol 3-88 (PVA), (ISP Customer Service GmBH, Cologne,
111
Germany) and L-leucine (LEU), (AppliChem GmbH, Darmstadt, Germany) were applied.
112
2.2. Preparation method
113
We used a two-step preparation protocol. First, the pre-nanosuspension was prepared by wet
114
milling technology, using PVA and MX. The final microsized powders were obtained with co-spray
115
drying of the diluted suspension and LEU (Fig. 1.).
116
117
Figure 1. Two-step preparation method of the samples.
118
2.2.1. Wet milling
119
We applied a combined wet milling technique, which was optimized by our research group’s
120
previous work [13]. We dissolved 2.5 g of PVA in purified water and the volume of the final
121
solution was 100 mL. 2.00 g of MX was suspended in 18.0 g of 2.5% (mass/volume) PVA solution.
122
20.0 g of ZrO2 beads were the milling medium in a planetary ball mill (Retsch Planetary Ball Mill PM
123
100 MA, Retsch GmbH, Haan, Germany). The milling parameters were the following: 60 min, 500
124
rpm. As the result of the wet milling, we got a nanosized pre-suspension containing MX and PVA.
125
The nanosuspension was diluted with purified water to 500 ml. The final concentration of the MX
126
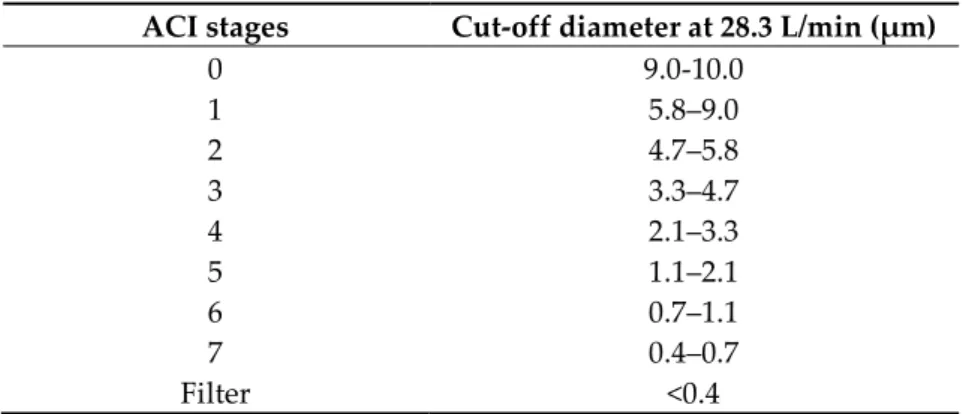
suspension was 4 g/L.
127
2.2.2. Co-spray drying
128
We prepared different compositions by adding a various amount of LEU as shown in Table 1.
129
A magnetic stirrer was used for sample homogenization (AREC.X heating magnetic stirrer, Velp
130
Scientifica Srl, Italy). The inhalable microparticles were produced by spray-drying using a
131
spray-dryer equipped with a two-fluid nozzle of 0.7 mm (Büchi Mini Spray Dryer B-191, Büchi,
132
Flawil, Switzerland). Based on the preliminary experiments spray drying properties were the
133
following: inlet temperature: 165 °C, outlet temperature: 100 °C, aspirator capacity: 85 %, airflow
134
rate: 500 L/h, feed pump rate: 10 %. The yield was calculated as the ratio of the mass of the particles
135
collected after spray-drying to the mass of the solid content of the initial nanosuspension. We
136
managed to increase the yield of spray-drying with the addition of LEU. Low spray-drying yields
137
are indicative of cohesive powders. LEU reduced the cohesion between the particle, therefore the
138
improvement of the spray-drying yield [19].
139
Table 1. Composition of the samples and the yield of spray-drying.
140
Samples MX (g/L) PVA (g/L) LEU (g/L) Yield* (%)
nanoMX1_LEU0 4.00 0.90 0.00 45.41 ± 5.10
nanoMX1_LEU0.5 4.00 0.90 2.00 57.56 ± 1.36
nanoMX1_LEU1 4.00 0.90 4.00 58.43 ± 6.36
*Data are means ± SD (n = 3 independent measurements).
2.2.3. Physical mixtures
141
We prepared physical mixtures of the raw materials. The compositions were the same as for
142
the spray-dried samples (Table 2.). During our measurements, we compared the properties of the
143
spray-dried samples to the physical mixtures.
144
Table 2. Composition of the physical mixtures.
145
Samples MX (g) PVA (g) LEU (g)
pmMX1_LEU0 4.00 0.90 0.00
pmMX1_LEU0.5 4.00 0.90 2.00
pmMX1_LEU1 4.00 0.90 4.00
2.3. Determination of particle size and distribution
146
Laser diffraction was used to determine the particle size and the particle size distribution of
147
our samples (Malvern Mastersizer Scirocco 2000, Malvern Instruments Ltd., Worcestershire, United
148
Kingdom). The wet dispersion unit was used to measure the particle size of the nanosuspension. We
149
set the refractive index of MX (1.720) and measured it in purified water with 2000 rpm stirring. The
150
dry dispersion unit was used to observe the spray-dried microcomposites. Approximately 0.5-1.0 g
151
of product was loaded into the feeding tray. The dispersion air pressure was adjusted to 3.0 bar and
152
75 % vibration feed was used. Each sample was measured in triplicate. The particle size distribution
153
was characterized by the D[0.1] (10% of the volume distribution is below this value), D[0.5] (the
154
volume median diameter is the diameter where 50% of the distribution is above and 50% is below)
155
and D[0.9] (90% of the volume distribution is below this value) values. The size distribution Span
156
was calculated according to (Eq. 1). A high Span value denotes a broad particle size distribution.
157
The higher the Span value, the broader the particle size distribution [20]. We obtained the specific
158
surface area (SSA) data, which predicts the dissolution and permeability properties of the samples.
159
Span = D[0.9]-D[0.1]
D[0.5] (1) 2.4. Investigation of morphology
160
Scanning electron microscopy (SEM), (Hitachi S4700, Hitachi Scientific Ltd., Tokyo, Japan) was
161
used to characterize the morphology of the spray-dried formulation. We applied a high voltage of
162
10 kV, an amperage of 10 mA and an air pressure of 1.3-13.1 mPa. A high vacuum evaporator and
163
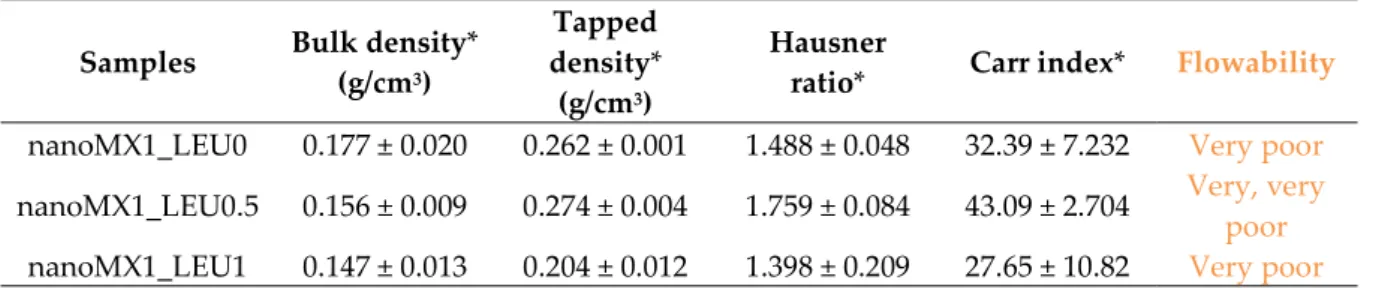
argon atmosphere were used to make the sputter-coated samples conductive with gold-palladium
164
(Bio-Rad SC 502, VG Microtech, Uckfield, United Kingdom). The thickness of the gold-palladium
165
coating was approximately 10 nm. For the particle size analysis of the active ingredient a public
166
domain image analyzer software, ImageJ was used (https://imagej.nih.gov/ij/index.html).
167
2.5. Density measurement
168
The bulk and tapped densities of the formulations were measured by using an Engelsmann
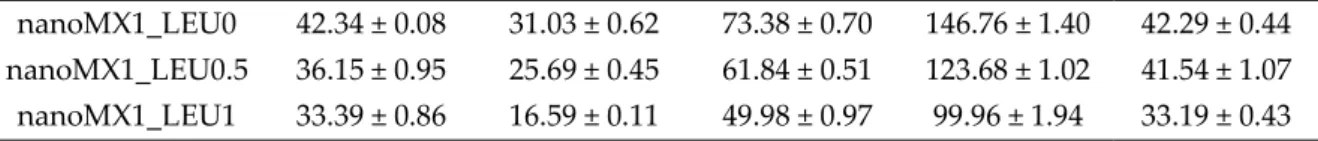
169
Stampfvolumeter (Ludwigshafen, Germany) [21]. A 10 cm3 cylinder was filled with 1.5-2.0 cm3 of
170
powder to calculate bulk density. Then it was tapped 1000 times. The tapped density of the samples
171
was calculated compared to the volume before and after the taps. We calculated the flow characters
172
(Eq. 2, 3) of the samples from the bulk (ρb) and tapped (ρt) density. All samples were measured in
173
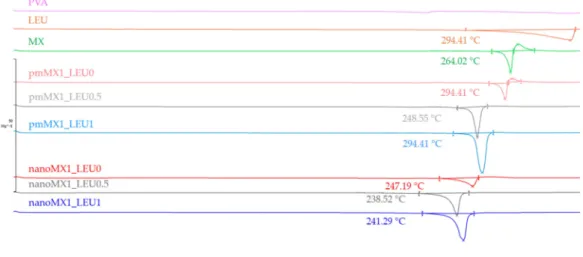
triplicate.
174
Hausner ratio = ρt ρb (2) Carr index = (ρt-ρb)
ρt *100 (3) 2.6. Determination of the interparticle interactions
175
Around 0.10 g of the samples were pressed on a 1 ton hydraulic press (Perkin Elmer hydraulic
176
press, Specac Inc., Waltham, USA). Six pastilles were obtained from each sample. We did three
177
parallel measurements with each composition. Three pastilles per sample were dripped with polar
178
liquid (4.8 µl of purified water) and the other three pastilles were dripped with non-polar solvent
179
(2.0 µl of diiodomethane). Contact angle was detected in an interval of 1 to 25 s with a Dataphysics
180
OCA 20 apparatus (Dataphysics Instrument GmbH, Filderstadt, Germany) [22]. We obtained the contact
181
angles of the two applied fluids. The surface free energy (γs) of the composites, which consists of
182
the polar part (γsp) and the disperse part (γsd), so (γs= γsp+γsd), was calculated based on the
183
Wu-equation. The surface tension of the used liquids is known in the literature: distilled water
184
γp=50.2 mN/m, γd=22.6 mN/m and diiodomethane γp=1.8 mN/m, γd=49 mN/m. We can express the
185
Wu equation (Eq. 4), where θ=contact angle, γ=surface free energy, s=solid phase, l=liquid phase,
186
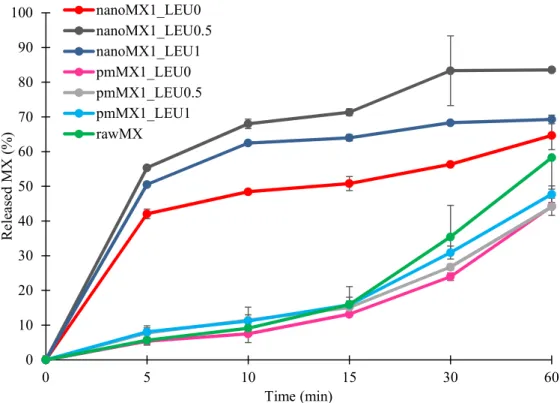
d=dispersion component, p=polar component.
187
(1+cosθ)γl =4(γsdγld)
γsd+γld +4(γspγlp)
γsp+γlp (4)
Polarity (Pol) was calculated as the ratio of the surface free energy of the polar component and
188
surface free energy multiplied by 100. (Eq. 5).
189
Pol=γp
γs*100 (5)
Cohesion work (Wc) was determined as twice the surface free energy (Eq. 6).
190
Wc=2*γs (6)
191
2.7. Structural analysis
192
To establish the crystalline character of the spray-dried samples X-ray powder diffraction
193
(XRPD) spectra were recorded with a BRUKER D8 Advance X-ray diffractometer (Bruker AXS
194
GmbH, Karlsruhe, Germany). The radiation source was Cu Kλ1 radiation (λ=1.5406 Å). Measurement
195
conditions were the following: Cu target, Ni filter, 40 kV voltage, 40 mA current, time constant
196
0.1°/min, angular step 0.010° over the interval 3-40°. We used the DIFFRACT plus EVA 28 software
197
for the evaluation.
198
2.8. Thermoanalitycal analysis
199
The differential scanning calorimetry measurements were made with a Mettler Toledo DSC
200
821e thermal analysis system with the STARe thermal analysis program V9.1 (Mettler Inc.,
201
Schwerzenbach, Switzerland). Approximately 2-5 mg of the samples were examined in the
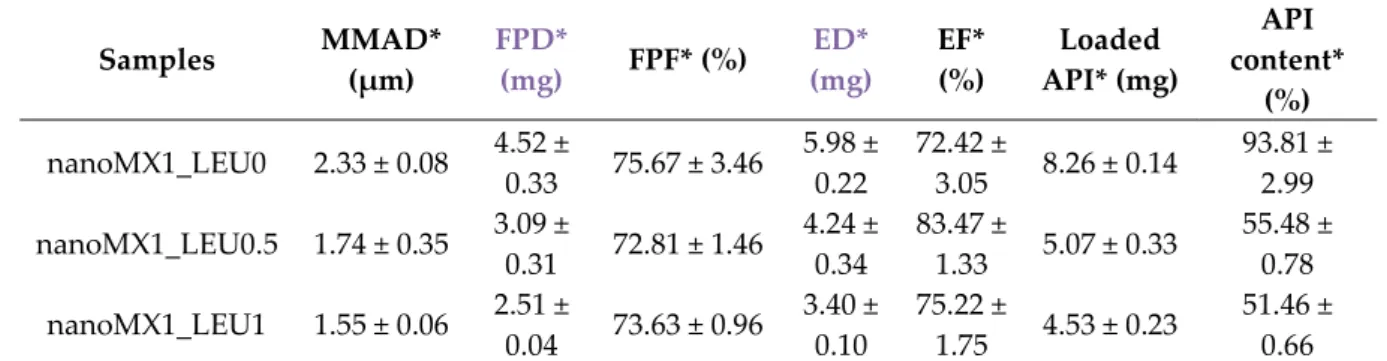
202
temperature range between 25 °C and 300 °C. The heating rate was 5 °C/min. Argon was the carrier
203
gas at a flow rate of 10 L/h during the investigation.
204
2.9. In vitro dissolution test
205
No in vitro dissolution test for powders for inhalation exists in the current Pharmacopeia. We
206
applied a modified paddle method (Hanson SR8 Plus, Teledyne Hanson Research, Chatsworth, Caz,
207
USA) from the European Pharmacopeia [23] to examine the release of MX from the samples. The
208
capacity of the vessel was 100 mL instead of 1000 mL and the size of the stirrer was smaller. We
209
designed the parameters of our measurement based on the circumstances of the human airways
210
[24]. The medium was a simulated lung medium, which contained NaCl, NaHCO3, CaCl2,
211
NaH2PO4, H2SO4, and glycine [25]. The volume of the medium was 50 mL based on the estimated
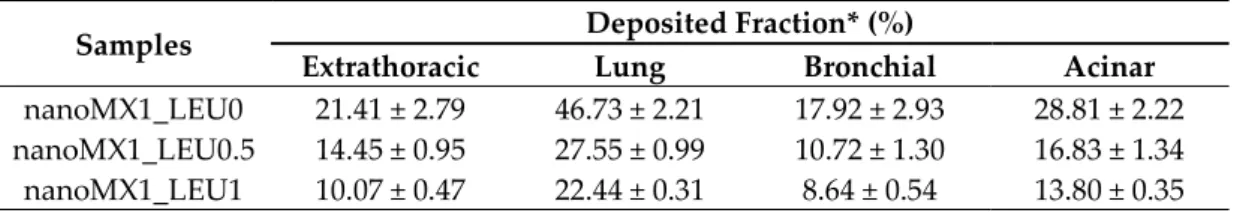
212
volume of the lung fluid [26]. The pH of the medium was 7.4 ± 0.1. The temperature was set at 37
213
°C. The samples contained 1.5 mg of MX, which is one-tenth of the oral dose of the API. During
214
pulmonary delivery we can reduce, the amount of API, compared to the oral dose. We chose this
215
amount of API, based on a salbutamol dosage recommendation [27]. Applying these doses of our
216
products were safe to use. Previous investigations proved that the API and the excipients had no
217
cytotoxic effect in that concentration on the cells [28]. The paddle was rotated at 100 rpm and the
218
sampling was performed up to 60 min. The total fraction of the samples was dispersed in the
219
medium. We took 5 mL of the dissolution medium after 5, 10, 15, 30, and 60 min. The medium was
220
replenished every time the sample was withdrawn. After filtration, (pore size: 0.45 µm, Millex-HV
221
syringe-driven filter unit, Millipore Corporation, Bedford, USA) and dilution, the MX contents of the
222
samples were determined by spectrophotometry at λ=362 nm (ATI-UNICAM UV/VIS
223
Spectrophotometer, Cambridge, United Kingdom). Three parallel measurements took place with the
224
formulations.
225
2.10. In vitro diffusion test
226
We would like to demonstrate the permeability from the lung fluid to the epithelial cells of the
227
lung. A modified horizontal diffusion cell was used to investigate the in vitro permeability of the
228
samples [26]. The donor phase (9 mL) was simulated lung medium (pH = 7.4). Phosphate buffer
229
(pH = 7.4) was used as the acceptor phase (9 mL) modelling the circumstances of the epithelial cell.
230
Between the two phases, there was a cellulose membrane (RC 55 WhatmanTM GE Healthcare Life
231
Sciences, Buckinghamshire, United Kingdom) impregnated with isopropyl myristate. The actual
232
diffusion surface was 0.785 cm2. The rotation of the stirring bar was set to 300 rpm. The temperature
233
was 37 °C. We measured 1.5 mg MX contents of the samples. First, the API released in the
234
simulated lung fluid, then diffused through the membrane to the phosphate buffer. The amount of
235
diffused MX was determined real-time at λ=362 nm until 60 minutes with sonda
236
(FDP-7UV200-VAR, Avantes, Apeldoorn, The Netherlands) spectrophotometer
237
(Avaspec-ULS2048-USB2, Avantes, Apeldoorn, The Netherlands) in the acceptor phase [29]. The
238
samples were measured three times.
239
The flux (J) [µg/cm2/h] of the active ingredient was calculated from the quantity of MX which
240
permeated through the membrane, divided by the surface of the membrane insert and the duration
241
using the following equation (Eq. 7):
242
J = m A*t (7)
The permeability coefficient (Kp) [cm/h] was determined from the flux and the MX
243
concentration in the donor phase [µg/cm3], (Eq. 8.):
244
Kp = J Cd (8) 2.11. In vitro aerodynamic measurements
245
The aerosolization efficacy of the spray-dried formulations was assessed in vitro, using an
246
Andersen Cascade Impactor (ACI), (Apparatus D, Copley Scientific Ltd., Nottingham United Kingdom)
247
[30]. The inhalation flow rate was set to 28.3±1 L/min (High-capacity Pump Model HCP5, Critical Flow
248
Controller Model TPK, Copley Scientific Ltd., Nottingham, UK). Table 3. Shows the cut-off aerodynamic
249
diameter for stages of ACI at a flow rate of 28.3 L/min [31]. The actual flow rate through the
250
impactor was measured by a mass flow meter (Flow Meter Model DFM 2000, Copley Scientific Ltd.,
251
Nottingham, UK). The inhalation time was 4 s for one inhalation. These parameters were lead to an
252
inhalation volume of 1.89 L, which was similar to the inhalation volume of COPD patients [32].
253
Breezhaler® single dose devices (Novartis International AG, Basel, Switzerland) were used, with
254
transparent, size 3 gelatine capsules (Capsugel, Bornem, Belgium) filled with 2.0–2.5 mg of powder,
255
which contained 1-2 mg of MX. Four capsules were inhaled during one measurement. The inhaler
256
was actuated twice for each capsule. Each sample was measured in triplicate.
257
To provide the pulmonary adhesive circumstances, the plates on the stages were coated with
258
Span 85 and cyclohexane (1+99 w/w%) mixture. After inhalation, the device, the capsules, the
259
induction port, the collection plates and the filter were washed with methanol and pH 7.4
260
phosphate buffer (60+40 v/v%) to collect the deposited MX. The collected and dissolved MX was
261
quantified by UV/Vis spectrophotometry (ATI-UNICAM UV/VIS Spectrophotometer, Cambridge,
262
United Kingdom.) at a wavelength of λ=362 nm.
263
The actual API content (%) of the spray-dried particles was measured by dissolving 1.0–1.1 mg
264
of product in 25 mL of methanol:phosphate buffer (60:40 w/w%), which solution was used for the
265
aerodynamic measurement too. The solutions were mixed for 10 min, 600 rpm and the API content
266
was quantified by UV/Vis spectrophotometry (ATI-Unicam UV/VIS Spectrophotometer, Cambridge
267
United Kingdom) at a wavelength of 362 nm.
268
The aerodynamic properties were calculated from a plot of the cumulative percentage
269
undersize of the API on log probability scale against the effective cut-off diameter using the
270
KaleidaGraph program [31][33]. The mass of drug particles with a size under 5 µm was defined as
271
a fine particle dose (FPD). The amount of drug leaving the device and reaching the impactor was
272
considered as the emitted dose (ED). The fine particle fraction (FPF) was calculated as the
273
percentage ratio between FPD and ED. Emitted fraction (EF) was expressed as a percentage of the
274
ED divided by the initial amount of API. The aerodynamic diameter is influenced by the inhalation
275
flow rate, density, size and shape of the particle. The real size of the particle during inhalation is
276
expressed with the MMAD. The MMAD of the particles was determined from the same plot as the
277
particle size corresponding to the 50% point of the cumulative distribution. For an inhalable and
278
well-deposited powder, the MMAD should be in the 1–5 µm size range [34].
279
Table 3. Cut-off aerodynamic diameter for stages of ACI at a flow rate of 28.3 L/min.
280
ACI stages Cut-off diameter at 28.3 L/min (μm)
0 9.0-10.0
1 5.8–9.0
2 4.7–5.8
3 3.3–4.7
4 2.1–3.3
5 1.1–2.1
6 0.7–1.1
7 0.4–0.7
Filter <0.4
281
2.12. In silico characterization
282
The in silico simulations were performed by the Stochastic Lung Deposition Model, which
283
tracks the inhaled particles until their deposition or exhalation and computes the fraction of the
284
particles deposited in each anatomical part of the respiratory system, that is, extrathoracic,
285
bronchial and acinar regions [35]. The particle trajectories were simulated in an asymmetrical
286
branching airway structure mimicking the realistic airways by selecting morphometrical
287
parameters from the database of Raabe et al. [36]. The inputs of the computational model are
288
different parameters characterizing the aerosol particles like density, shape or size, and the
289
breathing parameters of the patient, such as inhaled volume, inhalation time, breath-hold time,
290
exhalation time and breathing mode (nasal or oral). A more detailed description of the numerical
291
model can be found in Koblinger and Hofmann [37]. In our work, aerodynamic particle size
292
distributions of the samples measured by the Andersen Cascade Impactor technique served as the
293
inputs for the numerical airway deposition model. The inhalation parameters corresponded to a
294
COPD patient inhaling through Breezhaler®, whose inhaled volume and inhalation time values
295
(IV=1.7 L, tin=3.2 s) matched the best the flow rate of the current impactor measurements. The
296
computational deposition model was validated for the case of aerosol drugs in our earlier works
297
[38] [39].
298
3. Results
299
3.1. Particle size distribution
300
We managed to prepare a nanosuspension using raw MX and 2.5% PVA dilution during the
301
milling procedure. In the diluted suspension, the particle size of MX was 137.70 nm ± 4.965 nm, the
302
SSA was 43.65 ± 5.318 m2/g. After spray-drying the size of the particles was applicable for
303
pulmonary delivery since the D [0.5] values were in the 1-5 µm range and the distribution was
304
monodisperse (Table 4.). The geometric diameter of spray-dried nanoMX1_LEU0 was around 3.2
305
µm. Incorporating LEU in the formulations increased the geometric size of the spray-dried particles
306
[40]. The distribution was monodisperse in all cases (Span < 2.0), which is essential for accurate
307
dosing. The specific surface area (SSA) values increased compared to the raw materials, which
308
predicted an improved dissolution profile.
309
Table 4. Particle size of the initial API, the nanosuspension, the physical mixtures and the final
310
samples.
311
Samples D [0.1]* (μm) D [0.5]* (μm) D [0.9]* (μm) Span* SSA* (m2/g) raw MX 2.719 ± 0.057 9.913 ± 0.371 29.49 ± 0.630 2.70 ± 0.043 1.09 ± 0.028 MX suspension 0.067 ± 0.001 0.138 ± 0.005 0.555 ± 0.310 3.584 ± 2.056 43.65 ± 5.318
pmMX1_LEU0 3.073 ± 0.030 13.10 ± 0.500 349.92 ± 34.86 26.47 ± 1.649 0.88 ± 0.025 pmMX1_LEU0.5 5.426 ± 0.631 91.22 ± 17.90 357.57 ± 168.2 3.86 ± 1.101 0.40 ± 0.066 pmMX1_LEU1 7.983 ± 0.092 110.67 ± 0.261 353.25 ± 47.24 3.12 ± 0.433 0.27 ± 0.002 nanoMX1_LEU0 1.497 ± 0.046 3.186 ± 0.019 6.481 ± 0.193 1.56 ± 0.068 2.22 ± 0.031 nanoMX1_LEU0.5 1.834 ± 0.007 3.800 ± 0.014 7.389 ± 0.030 1.46 ± 0.004 1.88 ± 0.024 nanoMX1_LEU1 1.977 ± 0.093 4.396 ± 0.032 8.903 ± 0.186 1.58 ± 0.075 1.71 ± 0.051
*Data are means ± SD (n = 3 independent measurements).
3.2. Particle morphology
312
The SEM pictures showed particles with a nearly spheroidal shape, which was the result of the
313
optimized parameters of the co-spray-drying. The particles were produced from the droplets
314
during the method, and the most stable shape for a droplet is the spherical form [41]. According to
315
the SEM pictures, we observed that the presence of PVA prevented the aggregation. Particles were
316
individually separated and displayed a regular size, which met the requirements for the
317
formulation of a DPI [14]. Peclet number of LEU is greater than 1, which led to wrinkled particle
318
morphology after spray-drying. This rough surface improved the dispersion of the particles, which
319
reflecting low density and resulting in higher drug delivery into the low regions of the airways [18],
320
[40], [42]. We could observe the nanosized active ingredient particles on the SEM pictures. We
321
measured the diameter of the API with Image-J program. The size range of these was between
322
120-140 nm (Table 4.). The diameter of the MX was correlated with the results of the
323
nanosuspension. The images proved the “nano-in-micro” structure of the final powders.
324
Table 5. Diameter of the API in the products determined by Image-J analyzes and the SEM images
325
of the spray-dried samples.
326
Samples D* (nm) SEM pictures
nanoMX1_LEU0 134.30
± 23.07
nanoMX1_LEU0.5 126.57
± 27.26
nanoMX1_LEU1
138.27
± 42.57
*Data are means ± SD (n = 100 independent measurements).
3.3. Powder rheology
327
The lower density of DPI particles could offer better flowability and improved deposition
328
within the deeper airways. Thanks to the additives, density was reduced to under 0.3 g/cm3. The
329
usual density of DPIs is about 1 g/cm3, so our samples can be considered as low-density
330
formulation. The lower the tap density (0.04–0.25 g/cm3) is, the greater the respirable fraction [43].
331
The higher amount of LEU included in the sample nanoMX1_LEU1 was found to further reduce
332
density as demonstrated by the more wrinkled appearance of the particles [17]. The Hausner ratio
333
(HR) was between 1.4 and 1.8. The Carr index (CI) results were in the range of 27 and 43 (Table 6.).
334
The result indicates poor flowability, but it is similar to other carrier-free formulations in the
335
literature [44]. HR and CI values are also responsible for the aerosolization performance [45].
336
Table 6. Rheology properties of the samples.
337
Samples Bulk density*
(g/cm3)
Tapped density*
(g/cm3)
Hausner
ratio* Carr index* Flowability nanoMX1_LEU0 0.177 ± 0.020 0.262 ± 0.001 1.488 ± 0.048 32.39 ± 7.232 Very poor nanoMX1_LEU0.5 0.156 ± 0.009 0.274 ± 0.004 1.759 ± 0.084 43.09 ± 2.704 Very, very
poor nanoMX1_LEU1 0.147 ± 0.013 0.204 ± 0.012 1.398 ± 0.209 27.65 ± 10.82 Very poor
*Data are means ± SD (n = 3 independent measurements).
3.4. Interparticular interactions
338
Contact angle measurements were performed to calculate the polarity and the cohesive work
339
(Wc) characteristic of the materials. The wettability study revealed that the microcomposites had a
340
more hydrophilic character as compared with hydrophobic MX. With the use of PVA polarity
341
increased, which predicted better dissolution results in simulated lung medium compared to raw
342
MX. The highest polarity values were obtained with nanoMX1_LEU0. The lipophilic component
343
LEU decreased the polarity of the samples. In the case of samples containing LEU, cohesivity
344
decreased between the spherical, rough particles, so the presence of LEU caused the decrease in Wc
345
(Table 7.). The lower cohesivity of particles could result in more effective deposition properties.
346
Table 7. Surface free energy, cohesion work and polarity values of the samples and their components.
347
Samples γd
[mN/m] γp [mN/m] γ [mN/m] Wc [mN/m] Pol [%]
MX 45.49 ± 0.09 13.89 ± 0.13 59.83 ± 0.22 118.76 ± 0.44 23.39 ± 0.15 PVA 45.65 ± 0.10 36.89 ± 0.20 82.54 ± 0.30 165.08 ± 0.60 44.69 ± 0.11 LEU 30.00 ± 0.07 0.50 ± 0.17 30.50 ± 0.24 61.00 ± 0.48 1.639 ± 0.20 pmMX1_LEU0 42.62 ± 0.12 30.65 ± 0.48 73.27 ± 0.60 146.54 ± 1.20 41.83 ± 0.56 pmMX1_LEU0.5 36.57 ± 0.34 25.63 ± 0.27 62.20 ± 0.61 124.40 ± 1.22 41.21 ± 0.84 pmMX1_LEU1 34.01 ± 0.55 16.57 ± 0.36 50.58 ± 0.91 101.16 ± 1.82 32.76 ± 0.44
nanoMX1_LEU0 42.34 ± 0.08 31.03 ± 0.62 73.38 ± 0.70 146.76 ± 1.40 42.29 ± 0.44 nanoMX1_LEU0.5 36.15 ± 0.95 25.69 ± 0.45 61.84 ± 0.51 123.68 ± 1.02 41.54 ± 1.07 nanoMX1_LEU1 33.39 ± 0.86 16.59 ± 0.11 49.98 ± 0.97 99.96 ± 1.94 33.19 ± 0.43
*Data are means ± SD (n = 3 independent measurements).
3.5. X-ray powder diffraction results
348
X-ray powder diffraction was used to characterize the crystalline state of MX after the
349
preparation process. The XRPD pattern of the raw materials demonstrated the crystalline structure
350
of MX and LEU, as expected. Raw MX has characteristic peaks with the highest intensities at 6.6°,
351
11.4°, 13.1°, 13.5°, 15.1°, 18.7°, 19.3°, 25.9° and 26.4° 2-theta peaks indicating its crystalline structure
352
[46]. We detected the characteristic peaks of LEU at 6.12, 24.39, 30.61 2-theta peak [47]. In the case of
353
the products, the intensities of the characteristic peaks decreased (Fig. 2.). The presence of PVA had
354
no effect on the diffractograms.In the course of milling and spray-drying, a decrease in crystallinity
355
was perceptible, which was determined via the mean of the decrease of the total area beneath the
356
curve of the characteristic peaks compared to the physical mixtures. After treatment, ~71% of MX
357
remained crystalline for the nanoMX1_LEU0, ~52% for the nanoMX1_LEU0.5 and ~53% for the
358
nanoMX1_LEU1. The other part of the active ingredient became amorphous during the preparation
359
process. The preliminary stability test showed no changes in the structure after one month.
360
361
Figure 2. XRPD results of the raw materials (LEU, PVA, MX), the physical mixtures (pmMX1_LEU0,
362
pmMX1_LEU0.5, pmMX1_LEU1) and the spray-dried samples (nanoMX1_LEU0, nanoMX1_LEU0.5,
363
nanoMX1_LEU1).
364
3.6. Thermoanalytical results
365
DSC was employed to investigate the melting of PVA, LEU and MX in the raw form, in the
366
physical mixtures and in the prepared products (Fig 3.). PVA had no endothermic peak. LEU had
367
an endothermic peak at 294,41 °C. The DSC curves of raw MX showed a sharp endothermic peak at
368
264.03 °C, reflecting its melting point and crystalline structure. After milling and spray drying, the
369
DSC curves in all cases exhibited broader endothermic peaks of MX, indicating that the crystallinity
370
of the drug decreased. The residual MX crystals in the products melted at a lower temperature than
371
the crystals of raw MX due to the smaller particle size and the increased degree of amorphization.
372
This was promoted by PVA, which was softened at 85 °C as glass transition temperature (Tg) value.
373
374
Figure 3. DSC results of the raw materials, (PVA, LEU, MX), the physical mixtures (pmMX1_LEU0,
375
pmMX1_LEU0.5, pmMX1_LEU1) and the spray-dried samples (nanoMX1_LEU0, nanoMX1_LEU0.5,
376
nanoMX1_LEU1).
377
3.7. In vitro dissolution results
378
The initial API showed poor water-solubility as we mentioned above. The formulations were
379
compared to raw MX and the physical mixtures. The results of the dissolution study confirmed our
380
predictions (Fig. 4.). The released amount of MX was the lowest in the case of samples containing
381
raw material during the investigation. The spray-dried samples showed enhanced drug release
382
compared to the reference samples. Approximately half of the drug was released from the samples
383
containing nanonized API within the first 5 min and 65-85 % released within an hour. These
384
improvements in dissolution profile could be related to nanosizing effects, higher specific surface
385
area and amorphization. The presence of PVA inhibited the aggregation and increased polarity,
386
which helped to release the MX in the simulated lung medium. Applying LEU reduced the
387
cohesion between the particles, so larger a amount of MX was liberated from the powder than
388
without LEU. The highest amount of API was released from the nanoMX1_LEU0.5, because the
389
higher LEU concentration reduced the polarity of the products. The results of our formulations are
390
promising in the local pulmonary therapy. The prolonged presence of the particles gives enough
391
time to release the nanosized API. Therefore the clearance mechanism of the lung will reduce the
392
delivered drug dose less [6].
393
394
Figure 4. In vitro dissolution results of the API (rawMX), the physical mixtures (pmMX1_LEU0,
395
pmMX1_LEU0.5, pmMX1_LEU1) and the prepared samples (nanoMX1_LEU0, nanoMX1_LEU0.5,
396
nanoMX1_LEU1). Data are means ± SD (n = 3 independent measurements).
397
3.8. In vitro permeability results
398
We investigated the diffused amount of API from the simulated lung medium through a
399
membrane to the epithelium. The high surface area achieved by the nanosized particles was the
400
main factor affecting the rate of passive diffusion. Diffusion from the samples was faster and
401
reached higher values than from raw MX and the physical mixtures (Fig. 5.). The diffused MX
402
concentrations (60-90 µg/cm2 ) were promising if we interpolate them to the total surface of the
403
lung. We reached the highest values with the nanoMX1_LEU0.5 formulation, which was correlated
404
with the result of the in vitro dissolution test. The products showed a significantly increased flux (J)
405
and permeability coefficient (Kp) compared to the raw materials (Table 8.). The higher diffusion is
406
connected to the higher surface area produced by the nanoparticles. A large amount of API could
407
get into the epithelium with our spray-dried formulations, as a result of that, they could be effective
408
in the local treatment of pulmonary diseases.
409
0 10 20 30 40 50 60 70 80 90 100
0 5 10 15 30 60
Released MX (%)
Time (min) nanoMX1_LEU0
nanoMX1_LEU0.5 nanoMX1_LEU1 pmMX1_LEU0 pmMX1_LEU0.5 pmMX1_LEU1 rawMX
410
Figure 5. In vitro diffusion results of the API (rawMX), the physical mixtures (pmMX1_LEU0, pmMX1_LEU0.5,
411
pmMX1_LEU1) and the prepared samples (nanoMX1_LEU0, nanoMX1_LEU0.5, nanoMX1_LEU1). SD < ± 2%
412
(n = 3 independent measurements).
413
Table 8. In vitro permeability results of the samples.
414
Samples J (μg/cm2/h) Kp (cm/h)
rawMX 28.23 0.1394
pmMX1_LEU0 34.69 0.2081
pmMX1_LEU0.5 37.45 0.2247
pmMX1_LEU1 33.25 0.1995
nanoMX1_LEU0 61.80 0.3708
nanoMX1_LEU0.5 86.90 0.5214
nanoMX1_LEU1 73.58 0.4415
SD < ± 2% (n = 3 independent measurements).
415
3.9. In vitro aerodynamic results
416
The in vitro aerodynamic results were demonstrated in Table 9. The MMAD values were
417
between 1.55-2.33 µm, wherewith we could target the deeper airways [48]. The samples had FPF
418
values between 72-76%, which is higher than the FPF values of the Breezhaler formulations on the
419
market [32]. We can see the distribution of the products on the stages of the Andersen Cascade
420
Impactor (Fig. 6.). The nanoMX1_LEU0 sample had 15% deposition in the upper airways, 25 % and
421
27 % deposited on the 3rd and 4th stages. The FPF value here was the most outstanding (75.67 %).
422
The application of LEU improved the aerosolization of the products due to the reduced cohesion
423
between the particles, they de-aggregated during inhalation. The samples had smaller MMAD
424
(nanoMX1_LEU0.5: 1.74 µm, nanoMX1_LEU1: 1.55 µm) and flown deeper in the ACI, deposited on
425
the filter. We got high FPF values (nanoMX1_LEU0.5: 72.81%, nanoMX1_LEU0.5: 73.63%). The
426
emitted fraction (EF) in most of the samples were also high (around 72-84%), indicating a weak
427
adhesive character between the powder and the capsule, so a large amount of the product could
428
liberate from the device.
429
0 10 20 30 40 50 60 70 80 90
0 5 10 15 30 60
Diffused MX (µg/cm2)
Time (min) nanoMX1_LEU0
nanoMX1_LEU0.5 nanoMX1_LEU1 rawMX
pmMX1_LEU0 pmMX1_LEU0.5 pmMX1_LEU1
430
431
Figure 6. In vitro distribution of the samples (nanoMX1_LEU0, nanoMX1_LEU0.5, nanoMX1_LEU1). Data are432
means ± SD (n = 3 independent measurements).
433
Table 9. In vitro aerodynamic properties of the “nano-in-micro” systems.
434
Samples MMAD*
(μm) FPD*
(mg) FPF* (%) ED*
(mg) EF*
(%) Loaded API* (mg)
API content*
(%) nanoMX1_LEU0 2.33 ± 0.08 4.52 ±
0.33 75.67 ± 3.46 5.98 ±
0.22 72.42 ±
3.05 8.26 ± 0.14 93.81 ± 2.99 nanoMX1_LEU0.5 1.74 ± 0.35 3.09 ±
0.31 72.81 ± 1.46 4.24 ±
0.34 83.47 ±
1.33 5.07 ± 0.33 55.48 ± 0.78 nanoMX1_LEU1 1.55 ± 0.06 2.51 ±
0.04 73.63 ± 0.96 3.40 ±
0.10 75.22 ±
1.75 4.53 ± 0.23 51.46 ± 0.66
*Data are means ± SD (n = 3 independent measurements).
435
3.10. In silico aerodynamic results
436
Figure 7. shows the deposition fractions of the samples within the extrathoracic airways and
437
within different regions of the lung: the bronchial and acinar pulmonary regions. The results were
438
calculated with breath-holding time after inhalation: 5 s and 10 s. Using breath-holding time of 10 s,
439
the deposited fraction improved in all cases. The extrathoracic deposition is lower for the LEU
440
containing products, thanks to improved dispersity. The lower deposition in the lung was because
441
this method was defined the deposited amount on the filter, as an exhaled fraction. The
442
nanoMX1_LEU0 reached the highest deposition (47.47%) in the lung (Table 10.). In all cases, higher
443
values were obtained in the acinar region than in the bronchial region, which proved the delivery
444
into the lower parts of the lung. It is a more proper approach to the real distribution in the airways
445
than the in vitro method. However, these data are also promising for us because in various lung
446
diseases the airways are usually damaged, contracted or, obstructed.
447
0 5 10 15 20 25 30 35 40 45 50
throat 0. 1. 2. 3. 4. 5. 6. 7. filter
Distribution (%)
nanoMX1_LEU0 nanoMX1_LEU0.5 nanoMX1_LEU1
448
Figure 7. In silico aerodynamic results of the products (nanoMX1_LEU0, (nanoMX1_LEU0_5s,
449
nanoMX1_LEU0_10s, nanoMX1_LEU0.5_5s, nanoMX1_LEU0.5_10s, nanoMX1_LEU1_5s,
450
nanoMX1_LEU01_10s). Data are means ± SD (n = 3 independent measurements).
451
Table 10. In silico aerodynamic properties with a breath-holding time of 10 s.
452
Samples Deposited Fraction* (%)
Extrathoracic Lung Bronchial Acinar nanoMX1_LEU0 21.41 ± 2.79 46.73 ± 2.21 17.92 ± 2.93 28.81 ± 2.22 nanoMX1_LEU0.5 14.45 ± 0.95 27.55 ± 0.99 10.72 ± 1.30 16.83 ± 1.34 nanoMX1_LEU1 10.07 ± 0.47 22.44 ± 0.31 8.64 ± 0.54 13.80 ± 0.35
*Data are means ± SD (n = 3 independent measurements).
5. Discussion
453
The purpose of our research work was to develop a carrier-free „nano-in-micro” DPI system
454
including the advantages of nanonized active ingredient. We successfully worked out a
455
“nano-in-micro” structured particle preparation method. We nanonized the API by wet milling and
456
prepared micrometric sized particles by spray-drying. The samples containing MX, stabilizing
457
additive (PVA), and aerosolization adjuvant (LEU) were characterized. From the nanosuspension,
458
which contained MX nanoparticles (d=137 nm) we managed to prepare nearly spherical
459
microparticles with a size of 3-4 µm. By adding LEU, we could improve the yield (58 %) of the
460
spray-drying method. The specific surface area of the powders (1.7-2.2 m2/g) increased compared to
461
the raw materials. With the low density (0.20-0.27 g/cm3) formulations, we achieved proper
462
aerosolization properties. With the application of PVA, the polarity of the samples increased and
463
thanks to LEU, the cohesivity of the particles became lower. Part of the active ingredient was
464
detected in an amorphous state according to the XRPD and DSC measurements. Due to the particle
465
size reduction, improved surface area, amorphization and additives, dissolution was higher in the
466
lung medium, compared to the poorly water-soluble raw material, and the in vitro permeability of
467
the samples also improved (61-87 µg/cm2/h). The dissolution and permeability results were
468
beneficial to local delivery. Samples showed good aerosolization properties during the in vitro
469
aerodynamic measurements: FPF above 72 %, MMAD between 1.55-2.33 µm and ED above 72 %.
470
The application of LEU increased the deposition in the deeper airways. The Andersen Cascade
471
Impactor has limitations, the data are usually higher than they could be in real circumstances [49].
472
The in silico aerodynamic values proved the deep deposition of the products in the respiratory
473
0 10 20 30 40 50 60
Extrathoracic Lung Bronchial Acinar
Deposited fraction (%)
nanoMX1_LEU0_5s nanoMX1_LEU0_10s
nanoMX1_LEU0.5_5s nanoMX1_LEU0.5_10s
nanoMX1_LEU1_5s nanoMX1_LEU1_10s
airways. They showed higher deposition in the acinar region than in the bronchial region. This
474
method also just an approximated translation to patients.
475
6. Conclusion
476
The presented DPI offers an effective local treatment for lung diseases to prove it, it should be
477
tested in vivo soon. The execution of the stability measurement is also important because of the
478
“nano-in-micro” structure and the partial amorphization of the active ingredient.
479 480
Author Contributions: Conceptualization and Methodology, P.P., B. CS., P.S-R. and A.R.; Investigation, P. P.,
481
A.R. and Á.F.; Evaluation, P.P.; Writing—original draft, P.P.; Writing–review and editing, B. CS., Á.F., P.S-R.
482
and A.R.; Supervision, A.R. All authors have read and agreed to the published version of the manuscript.
483
Funding: This research was funded by the University of Szeged Open Access Fund grant number 5062
484
Acknowledgments: Gedeon Richter’s Talentum Foundation this work was supported by Gedeon Richter Ltd –
485
GINOP project (2.2.1-15-2016-00007), EFOP 3.6.3-VEKOP-16-2017-00009, Ministry of Human Capacities,
486
Hungary grant 20391-3/2018/FEKUSTRAT and TUDFO/47138-1/2019-ITM project is also acknowledged.
487
Conflicts of Interest: The authors declare no conflict of interest.
488
References
489
1. Sou, T.; Bergström, C.A.S. Contemporary Formulation Development for Inhaled
490
Pharmaceuticals. J. Pharm. Sci. 2021, 110, 66–86, doi:10.1016/j.xphs.2020.09.006.
491
2. Pilcer, G.; Amighi, K. Formulation strategy and use of excipients in pulmonary drug
492
delivery. Int. J. Pharm. 2010, 392, 1–19, doi:10.1016/j.ijpharm.2010.03.017.
493
3. Malamatari, M.; Charisi, A.; Malamataris, S.; Kachrimanis, K.; Nikolakakis, I. Spray drying
494
for the preparation of nanoparticle-based drug formulations as dry powders for inhalation.
495
Processes 2020, 8, doi:10.3390/pr8070788.
496
4. Lechanteur, A.; Evrard, B. Influence of composition and spray-drying process parameters on
497
carrier-free DPI properties and behaviors in the lung: A review. Pharmaceutics 2020, 12, 1–22,
498
doi:10.3390/pharmaceutics12010055.
499
5. Darquenne, C. Aerosol deposition in health and disease. J. Aerosol Med. Pulm. Drug Deliv.
500
2012, 25, 140–147, doi:10.1089/jamp.2011.0916.
501
6. Ruge, C.C.; Kirch, J.; Lehr, C.M. Pulmonary drug delivery: From generating aerosols to
502
overcoming biological barriers-therapeutic possibilities and technological challenges. Lancet
503
Respir. Med. 2013, 1, 402–413, doi:10.1016/S2213-2600(13)70072-9.
504
7. Malamatari, M.; Somavarapu, S.; Kachrimanis, K.; Buckton, G.; Taylor, K.M.G. Preparation
505
of respirable nanoparticle agglomerates of the low melting and ductile drug ibuprofen:
506
Impact of formulation parameters. Powder Technol. 2017, 308, 123–134,
507
doi:10.1016/j.powtec.2016.12.007.
508
8. https://pubchem.ncbi.nlm.nih.gov/compound/Meloxicam.
509
9. Szabó-Révész, P. Modifying the physicochemical properties of NSAIDs for nasal and
510
pulmonary administration. Drug Discov. Today Technol. 2018, 27, 87–93,
511
doi:10.1016/j.ddtec.2018.03.002.
512
10. Arafa, H.M.M.; Abdel-Wahab, M.H.; El-Shafeey, M.F.; Badary, O.A.; Hamada, F.M.A.
513
Anti-fibrotic effect of meloxicam in a murine lung fibrosis model. Eur. J. Pharmacol. 2007, 564,
514
181–189, doi:10.1016/j.ejphar.2007.02.065.
515
11. Yokouchi, H.; Kanazawa, K.; Ishida, T.; Oizumi, S.; Shinagawa, N.; Sukoh, N.; Harada, M.;
516
Ogura, S.; Munakata, M.; Dosaka-Akita, H.; et al. Cyclooxygenase-2 inhibitors for
517
non-small-cell lung cancer: A phase II trial and literature review. Mol. Clin. Oncol. 2014, 2,
518
744–750, doi:10.3892/mco.2014.319.
519
12. Weiss, A.; Porter, S.; Rozenberg, D.; O’Connor, E.; Lee, T.; Balter, M.; Wentlandt, K. Chronic
520
Obstructive Pulmonary Disease: A Palliative Medicine Review of the Disease, Its Therapies,
521
and Drug Interactions. J. Pain Symptom Manage. 2020, 60, 135–150,
522
doi:10.1016/j.jpainsymman.2020.01.009.
523
13. Bartos, C.; Szabó-Révész, P.; Bartos, C.; Katona, G.; Jójárt-Laczkovich, O.; Ambrus, R. The
524
Effect of an Optimized Wet Milling Technology on the Crystallinity, Morphology and
525
Dissolution Properties of Micro- and Nanonized Meloxicam. Molecules 2016, 21,
526
doi:10.3390/molecules21040507.
527
14. Pomázi, A.; Buttini, F.; Ambrus, R.; Colombo, P.; Szabó-Révész, P. Effect of polymers for
528
aerolization properties of mannitol-based microcomposites containing meloxicam. Eur.
529
Polym. J. 2013, 49, 2518–2527, doi:10.1016/j.eurpolymj.2013.03.017.
530
15. Feng, A.L.; Boraey, M.A.; Gwin, M.A.; Finlay, P.R.; Kuehl, P.J.; Vehring, R. Mechanistic
531
models facilitate efficient development of leucine containing microparticles for pulmonary
532
drug delivery. Int. J. Pharm. 2011, 409, 156–163, doi:10.1016/j.ijpharm.2011.02.049.
533
16. Li, L.; Sun, S.; Parumasivam, T.; Denman, J.A.; Gengenbach, T.; Tang, P.; Mao, S.; Chan, H.K.
534
L-Leucine as an excipient against moisture on in vitro aerosolization performances of highly
535
hygroscopic spray-dried powders. Eur. J. Pharm. Biopharm. 2016, 102, 132–141,
536
doi:10.1016/j.ejpb.2016.02.010.
537
17. Chvatal, A.; Farkas, Á.; Balásházy, I.; Szabó-Révész, P.; Ambrus, R. Aerodynamic properties
538
and in silico deposition of meloxicam potassium incorporated in a carrier-free DPI
539
pulmonary system. Int. J. Pharm. 2017, 520, 70–78, doi:10.1016/j.ijpharm.2017.01.070.
540
18. Chvatal, A.; Ambrus, R.; Party, P.; Katona, G.; Jójárt-Laczkovich, O.; Szabó-Révész, P.; Fattal,
541
E.; Tsapis, N. Formulation and comparison of spray dried non-porous and large porous
542
particles containing meloxicam for pulmonary drug delivery. Int. J. Pharm. 2019, 559, 68–75,
543
doi:10.1016/j.ijpharm.2019.01.034.
544
19. Seville, P.C.; Learoyd, T.P.; Li, H.Y.; Williamson, I.J.; Birchall, J.C. Amino acid-modified
545
spray-dried powders with enhanced aerosolisation properties for pulmonary drug delivery.
546
Powder Technol. 2007, 178, 40–50, doi:10.1016/j.powtec.2007.03.046.
547
20. Li, Q.; Rudolph, V.; Weigl, B.; Earl, A. Interparticle van der Waals force in powder
548
flowability and compactibility. Int. J. Pharm. 2004, 280, 77–93,
549
doi:10.1016/j.ijpharm.2004.05.001.
550
21. 2.9.34. Bulk density and tapped density of powders. In EUROPEAN PHARMACOPOEIA 9.0;
551
p. 359.
552
22. Ambrus, R.; Benke, E.; Farkas, Á.; Balásházy, I.; Szabó-Révész, P. Novel dry powder inhaler
553
formulation containing antibiotic using combined technology to improve aerodynamic
554
properties. Eur. J. Pharm. Sci. 2018, 123, 20–27, doi:10.1016/j.ejps.2018.07.030.
555
23. Pharmacopoeia, E. 2.9.3. Dissolution test for solid dosage forms. Eur. PHARMACOPOEIA 9.0
556
2010, 228.
557
24. Fröhlich, E.; Mercuri, A.; Wu, S.; Salar-Behzadi, S. Measurements of deposition, lung surface
558
area and lung fluid for simulation of inhaled compounds. Front. Pharmacol. 2016, 7, 1–10,
559
doi:10.3389/fphar.2016.00181.
560
25. Parlati, C. Respirable microparticles of aminoglycoside antibiotics for pulmonary
561
administration, University of Parma, 2008.
562
26. May, S. Dissolution Testing of Powders for Inhalation. Dissertation 2013, 8–11.
563
27. Boarder, M.; Dixon, J.; Newby, D.; Navti, P.; Zetterström, T. Pharmacology for Pharmacy and
564
the Health Sciences; Oxford University Press, 2010;
565
28. Chvatal, A.; Alzhrani, R.; Tiwari, A.K.; Ambrus, R.; Szabó-Révész, P.; Boddu, S.H.S.
566
Cytotoxicity of inhalable dry powders in A549 human lung cancer cell line. Farmacia 2018,
567
66, 172–175.
568
29. Sipos, B.; Szabó-Révész, P.; Csóka, I.; Pallagi, E.; Dobó, D.G.; Bélteky, P.; Kónya, Z.; Deák, Á.;
569
Janovák, L.; Katona, G. Quality by design based formulation study of meloxicam-loaded
570
polymeric micelles for intranasal administration. Pharmaceutics 2020, 12, 1–29,
571
doi:10.3390/pharmaceutics12080697.
572
30. 2.9.18. Preparations for inhalation: aerodynamic assessment of fine particles. In EUROPEAN
573
PHARMACOPOEIA 9.0; p. 323.
574
31. Buttini, F.; Colombo, G.; Kwok, P.C.L.; Wui, W.T. Aerodynamic Assessment for Inhalation
575
Products: Fundamentals and Current Pharmacopoeial Methods. Inhal. Drug Deliv. Tech. Prod.
576
2013, 91–119, doi:10.1002/9781118397145.ch6.
577
32. Chapman, K.R.; Fogarty, C.M.; Peckitt, C.; Lassen, C.; Jadayel, D.; Dederichs, J.; Dalvi, M.;
578
Kramer, B. Delivery characteristics and patients’ handling of two single-dose dry-powder
579
inhalers used in COPD. Int. J. COPD 2011, 6, 353–363, doi:10.2147/COPD.S18529.
580
33. Benke, E.; Farkas, Á.; Szabó-révész, P.; Ambrus, R. Development of an innovative, carrier-
581
based dry powder inhalation formulation containing spray-dried meloxicam potassium to
582
improve the in vitro and in silico aerodynamic properties. Pharmaceutics 2020, 12, 1–19,
583
doi:10.3390/pharmaceutics12060535.
584
34. Cunha, L.; Rodrigues, S.; da Costa, A.M.R.; Faleiro, M.L.; Buttini, F.; Grenha, A. Inhalable
585
fucoidan microparticles combining two antitubercular drugs with potential application in
586
pulmonary tuberculosis therapy. Polymers (Basel). 2018, 10, doi:10.3390/polym10060636.
587
35. Hofmann, W. Modelling inhaled particle deposition in the human lung-A review. J. Aerosol
588
Sci. 2011, 42, 693–724, doi:10.1016/j.jaerosci.2011.05.007.
589
36. Otto G., R.; Yeh, H.; Schum, G.M.; Phalen, R.F. Tracheobronchial Geometry: Human, Dog,
590
Rat, Hamster - A Compilation of Selected Data from the Project Respiratory Tract Deposition
591
Models. U.S. Gov. Print. Off. 1976, 1–11.
592
37. Koblinger, L.; Hofmann, W. Monte Carlo modeling of aerosol deposition in human lungs.
593
Part I: Simulation of particle transport in a stochastic lung structure. J. Aerosol Sci. 1990, 21,
594
661–674, doi:10.1016/0021-8502(90)90121-D.
595
38. Farkas, Á.; Jókay, Á.; Füri, P.; Balásházy, I.; Müller, V.; Odler, B.; Horváth, A. Computer
596
modelling as a tool in characterization and optimization of aerosol drug delivery. Aerosol Air
597
Qual. Res. 2015, 15, 2466–2474, doi:10.4209/aaqr.2015.03.0144.
598
39. Farkas, Á.; Jókay, Á.; Balásházy, I.; Füri, P.; Müller, V.; Tomisa, G.; Horváth, A. Numerical
599
simulation of emitted particle characteristics and airway deposition distribution of
600
Symbicort® Turbuhaler® dry powder fixed combination aerosol drug. Eur. J. Pharm. Sci.