Pharmaceutics 2021, 13, x. https://doi.org/10.3390/xxxxx www.mdpi.com/journal/pharmaceutics
Article 1
In vitro drug release, permeability and structural test of cipro-
2floxacin-loaded nanofibers
3Luca Éva Uhljar 1, Sheng Yuan Kan 2, Norbert Radacsi 2, Vasileios Koutsos 2, Piroska Szabó-Révész 1 and Rita Am- 4
brus 1,* 5
1 Faculty of Pharmacy, Interdisciplinary Excellence Centre, Institute of Pharmaceutical Technology and 6 Regulatory Affairs, University of Szeged, Eötvös u. 6., H-6720 Szeged, Hungary; uhljar.luca.eva@szte.hu 7
(L.É.U.); ReveszPiroska@szte.hu (P.S-R.) 8
2 School of Engineering, Institute for Materials and Processes, The University of Edinburgh, King’s Buildings, 9 Edinburgh EH9 3FB, United Kingdom; skyshengyuan@hotmail.com (S.Y.K.); n.radacsi@ed.ac.uk (N.R.); 10
vasileios.koutsos@ed.ac.uk (V.K.) 11
* Correspondence: ambrus.rita@szte.hu 12
Abstract: Nanofibers of the poorly water-soluble antibiotic, ciprofloxacin (CIP), were fabricated in 13 the form of an amorphous solid dispersion by using poly(vinyl pyrrolidone) as polymer matrix, by 14 the low-cost electrospinning method. Nanofibers’ solubility, and in vitro diffusion were remarkably 15 higher than those of the CIP powder or the physical mixture of the two components. The fiber size 16 and morphology were optimized, and it was found that the addition of the CIP to the electrospin- 17 ning solution decreased the nanofiber diameter leading to an increased specific surface area. 18 Structural characterization confirmed the interactions between the drug and the polymer and the 19 amorphous state of CIP inside the nanofibers. Since the solubility of CIP is pH-dependent, the in 20 vitro solubility and dissolution studies were executed at different pH levels. The nanofiber sample 21 with the finest morphology demonstrated a significant increase in solubility both in water and pH 22 7.4 buffer. Single medium and two-stage biorelevant dissolution studies were observed, and the 23 release mechanism described by mathematical models. Besides, in vitro diffusion from pH 6.8 to 24 pH 7.4 notably increased when compared to the pure drug and physical mixture. Ciproflox- 25 acin-loaded PVP nanofibers can be considered as fast-dissolving formulations with improved 26
physicochemical properties. 27
Keywords: amorphous solid dispersion, ciprofloxacin, electrospinning, nanofibers, poorly wa- 28
ter-soluble drug, povidone 29
30
1. Introduction 31
Nowadays, one of the main challenges in pharmaceutical technology is dealing with 32 poorly water-soluble drugs. The amount of Biopharmaceutics Classification System 33
(BCS) Class II and Class IV drugs is estimated to make up ∼40% of currently marketed 34
drugs and ∼90% of compounds currently under development [1–3]. One of the BCS Class 35
II/IV drugs is Ciprofloxacin (CIP) which is a worldwide-used, broad-spectrum, sec- 36 ond-generation fluoroquinolone antibiotic. Fluoroquinolones inhibit DNA replication in 37 bacteria since their mechanism of action is the inhibition of bacterial DNA gyrase and 38 topoisomerase IV. The lack of cross-resistance between fluoroquinolones and other 39 Citation: Lastname, F.; Lastname, F.;
Lastname, F. Title. Pharmaceutics 2021, 13, x.
https://doi.org/10.3390/xxxxx
Academic Editor: Firstname Last- name
Received: date Accepted: date Published: date
Publisher’s Note: MDPI stays neu- tral with regard to jurisdictional claims in published maps and insti- tutional affiliations.
Copyright: © 2021 by the authors.
Submitted for possible open access publication under the terms and conditions of the Creative Commons Attribution (CC BY) license (http://creativecommons.org/licenses /by/4.0/).
classes of antibiotics makes this antibiotic family important. CIP and its derivatives can 40 effectively treat antibiotic-resistant infections (e.g., nosocomial pneumonia) so they are 41 usually reserved as “drugs of last resort” [4]. Since CIP is active against many 42 Gram-negative and Gram-positive bacteria, it is directed to treat several bacterial infec- 43 tions. CIP is indicated to a broad spectrum of diseases from bacterial conjunctivitis 44 through bone and joint infections to complicated urinary tract infections. Accordingly, 45 the available dosage forms on the market are ophthalmic and otic solutions, film-coated 46 tablets, oral suspensions, and solutions for infusions. Thus, various routes for drug ad- 47 ministration, both local and systemic, are applied. Despite the common use, CIP has only 48 56-77% bioavailability [4]. The solubility of the drug is pH-dependent, as CIP is highly 49 soluble below pH 5 and above pH 10 but almost insoluble around neutral pH level [5]. 50 According to the BCS, CIP belongs to Class IV, with low water-solubility (0.067 mg/mL at 51
25 °C, pH 7.5; [6]) and poor permeability [4]. 52
In most cases, nanocarrier-based drug delivery systems can offer a solution to the 53 low solubility problem of the drug. Nanostructures are innovative formulations with 54 nanometer-scale in at least one dimension and a large surface-area-to-volume ratio. The 55 latter ensures that a large amount of the drug can come into contact with the surrounding 56 medium. In this way, the dissolution rate and even solubility can increase [7–9]. Fur- 57 thermore, numerous drug delivery systems contain the active pharmaceutical ingredient 58 (API) in an amorphous state and therefore cause increased solubility of the drug [10,11]. 59 With the increase of solubility and dissolution rate, the bioavailability of the API in- 60 creases [12–14]. Currently, intensive research is underway to formulate CIP into different 61 nanocarriers to treat several diseases. Some examples are collected in Table 1. 62 Table 1. Ciprofloxacin-loaded nanocarriers under investigation with the aimed indication 63 Type of Nanocarrier Excipients applied in
Nanocarrier Aimed indications Targeted organs References Polymeric nanoparticles
(NP) in nanofibers (NF)
PLGA and PCL - NP
PEOT/PBT - NF tissue engineering middle ear [15]
Nanoparticles and coated nanoparticles
PLGA
and chitosan (coat) root canal infection tooth [16]
Composite nanoparticles synthetic nano-HA and
sodium alginate tissue engineering bone [17]
Microspheres PLGA osteomyelitis, orthopedic
infections bone [18]
Microparticles calcium carbonate, sodium
hyaluronate lung infections lungs [19]
Nanocrystals inside
liposomes HSPC, cholesterol lung infections lungs [20]
Amorphous nanoparticle
complex dextran sulfate non-cystic fibrosis bron-
chiectasis lungs [21]
Lipid-core nanocapsules
PCL, sorbitan monostearate, oleic acid,
polysorbate 80
cystic fibrosis lungs [22]
Nanofibers PVP wound infections skin [23]
Nanofibers PVA, chitosan, graphene
oxide wound infections skin [24]
Abbreviations: HA - hydroxyapatite; HSPC - hydrogenated soy phosphatidylcholine; PCL - poly(ε-caprolactone); PEOT/PBT - 64 Poly(ethylene oxide terephthalate)/poly(butylene terephthalate) copolymer; PLGA - poly(DL-lactide-co-glycolide); PVA - poly(vinyl 65
alcohol); PVP - poly(vinyl pyrrolidone) 66
67 Polymeric nanofibers are considered as solid dispersions with a large specific sur- 68 face area that can stabilize drugs in their amorphous state. Thus, polymer-based nanofi- 69 bers provide an attractive approach for the development of dosage forms due to the en- 70 hanced solubility and dissolution rate [25,26]. Nanofibers have a variety of uses currently 71 under investigation in different fields of science. In pharmaceutical and medical fields, at 72 least four applications have to be mentioned: wound dressings, filtration, drug delivery 73 systems, and tissue engineering scaffolds [27–31]. Electrospinning is an effective and in- 74 expensive method for the fabrication of polymeric nanofibers; hence it is the most widely 75 used technique for nanofiber production in the industry. During the electrospinning 76 procedure, the ejection and travel of the polymer-drug fluid jet are induced by the large 77 potential difference between a needle and a collector, generated by the high voltage 78 power supply [32]. As the jet travels towards the collector, the solvent evaporates, and 79 the jet solidifies into nano-sized fibers. It is possible to control the mean fiber diameter 80 and morphology by changing the polymer-drug solution, the applied voltage, the nee- 81 dle-collector distance, the flow rate, the collector speed, or the environmental tempera- 82
ture and humidity [33,34]. 83
Poly(vinyl pyrrolidone) (PVP) is a water-soluble and biocompatible polymer, which 84 is commonly used as a pharmaceutical excipient and food additive [35]. PVP also widely 85 used as a carrier polymer that enables electrospinning [23,36–45]. 86 Ciprofloxacin loaded PVP nanofibers as potential wound dressings have been re- 87 cently investigated [23,41,44]. However, to the best of our knowledge, the development 88 of a potential per os formulation has not been published yet. 89 In this article, the preformulation studies of PVP-based nanofiber mats loaded with 90 CIP for per os administration are investigated. The aim of the present study was to in- 91 crease the water solubility and diffusion of the API and study the in vitro drug release 92 and its kinetics. Additionally, it was aimed to investigate the effect of the polymer-drug 93 solution and the flow rate on the fiber diameter and morphology. Special attention was 94 paid to structural characterization, drug entrapment efficiency, solubility, in vitro disso- 95 lution, and in vitro diffusion of the CIP-loaded nanofibrous samples to produce immedi- 96 ate-release nanofibrous formulation therefore to achieve effectible antibiotic therapy. 97
2. Materials and Methods 98
2.1. Materials 99
Ciprofloxacin base (CIP; Mw = 331.35; purity >98%) was gifted by Teva Pharmaceu- 100 tical Works Ltd. (Hungary). Polyvinylpyrrolidone (PVP) (Mw = 1,300,000) was obtained 101 from Alfa Aesar (United Kingdom). Ethanol (99.99% purity) and chloroform (99.8% pu- 102 rity) were purchased from Fisher Scientific (United Kingdom). 103 Phosphate buffer solutions (PBS, pH 7.4 and 6.8) were prepared in-house as follows. 104 To prepare 1 liter of the pH 7.4 PBS, 1.44 g disodium phosphate dihydrate (Na2HPO4 x 2 105 H2O), 0.12 g potassium dihydrogen phosphate (KH2PO4), 8.00 g sodium chloride (NaCl), 106 and 0.20 g potassium chloride (KCl) was dissolved in approximately 0.9 L of distilled 107 water. Then the pH was adjusted to 7.4 using aqueous solutions of NaOH and made the 108 buffer up to volume 1 L. For the preparation of 1 L of the pH 6.8 PBS, 6.8 g KH2PO4 was 109 dissolved in 900 mL of distilled water before mixing 77.00 mL of aqueous solutions of 110 NaOH (0.2 M). The pH was adjusted to 6.8 using the NaOH solution. All used chemicals 111
were purchased from Sigma–Aldrich (Hungary). 112
All other chemicals were analytical grade, and distilled water was used. 113 114
2.2. Methods 115
2.2.1. Preparation of the solutions for electrospinning 116 As the first step of the nanofiber preparation, the electrospinning solutions were 117 prepared. PVP powder was dissolved in ethanol, whereas ciprofloxacin was dissolved in 118 chloroform in a separate vessel. Constant stirring was applied to both at room tempera- 119 ture for 24 hours to generate homogenous solutions using a magnetic stirrer at 700 rpm. 120 The nominal concentration of the CIP solutions was 1 mg/mL, while the polymer con- 121 centrations varied between 5-20% w/v. The PVP and the drug solutions were mixed in 122 1:1, 1:2, 1:3 volume ratio, respectively, to yield the requested concentrations. The full de- 123
tails of the samples prepared are listed in Table 2. 124
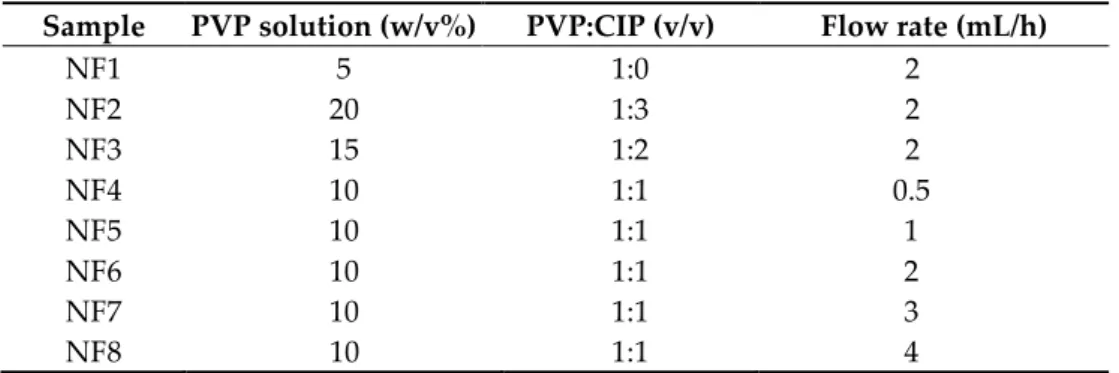
Table 2. The composition of each sample and their preparation procedures 125 Sample PVP solution (w/v%) PVP:CIP (v/v) Flow rate (mL/h)
NF1 5 1:0 2
NF2 20 1:3 2
NF3 15 1:2 2
NF4 10 1:1 0.5
NF5 10 1:1 1
NF6 10 1:1 2
NF7 10 1:1 3
NF8 10 1:1 4
126
2.2.2. Electrospinning procedure 127
The prepared solutions were filled in 2 mL syringes fitted with stainless-steel 20G 128 needles. The electrospinning process was carried out using a commercially available 129 electrospinning device (IME Medical Electrospinning, The Netherlands; Figure 1.). The 130 applied potential difference was 24 kV, and the needle-collector distance was maintained 131 10 cm. Different flow rates (0.5, 1, 2, 3, and 4 mL/h) were provided by a syringe pump 132 (Table 2). All the experiments were performed at ambient conditions (23 °C temperature 133 and 36-42% relative humidity). Additionally, a control sample containing no CIP was 134 prepared using the same conditions as were used for the other samples (a constant 2 135
mL/h pump flow rate was used for the pure PVP sample). 136
137
Figure 1. Preparation of ciprofloxacin-loaded nanofibers 138
2.2.3. Preparation of the physical mixture 139
To the structural characterization and in vitro studies, physical mixtures were used 140 as reference samples prepared by a shaker mixer (Turbula System Schatz; Willy A. 141 Bachofen AG Maschinenfabrik, Basel, Switzerland). PVP and CIP were homogenized 142 under controlled conditions (50 rpm, 10 min) in the same weight ratio as most nanofi- 143
brous samples. 144
145
2.2.4. Geometrical and morphological measurements 146
The morphology of the electrospun nanofibers was observed by scanning electron 147 microscopy (SEM; Hitachi S4700, Hitachi Scientific Ltd., Tokyo, Japan) at 10 kV. Speci- 148 mens of the fiber mats (0.4 × 0.3 cm) were cut and coated with approximately 10 nm thin 149 film of gold-palladium using a sputter coater (Bio-Rad SC 502, VG Microtech, Uckfield, 150 United Kingdom) before SEM imaging was performed. 100 fibers from each formulation 151 were randomly selected to carry out the fiber diameter measurement (ImageJ 1.44p 152
software; Bethesda, MD, USA). 153
154
2.2.5. Structural characterization 155
CIP, physical mixture, and CIP-loaded nanofibers were characterized by X-ray 156 powder diffraction (XRPD; D8 Advance, Bruker AXS GmbH, Karlsruhe, Germany). The 157 samples were measured with Cu K λI radiation (40kV/40mA, λ = 1.5406 Å) in between 158
diffraction angle 3-40° for their structural properties. 159
Differential scanning calorimeter (DSC; Mettler Toledo DSC821e; Mettler Inc., 160 Schwerzenbach, Switzerland) was applied to evaluate the thermal behavior of the sam- 161 ples using 25 °C – 300 °C temperature range at a heating rate of 5 °C min-1. 162 Fourier transform infrared spectroscopy (FTIR; Thermo Nicolet AVATAR 330, 163 Madison, WI, USA) was performed after discs of a KBr and nanofibers had been made by 164 a compression molding technique. The discs were scanned 128 times over the range 165
4000-400 cm-1 and with a resolution of 4 cm-1. 166
167
2.2.6. Drug loading and drug entrapment efficiency 168
The drug loading and the amount of CIP entrapped in the optimized nanofibrous 169 mat was quantified by UV spectrophotometry (ABL&E-Jasco UV/VIS Spectrophotometer 170 V-730, Budapest, Hungary). Known mass of NF6 sample (about 160 mg) was dissolved in 171 50 mL of 0.1 M hydrochloric acid solution. The amount of CIP in the solution was calcu- 172
lated by UV analysis at a λmax of 277 nm. 173
The amount of the loaded CIP of the NF6 formulation was calculated by comparing 174 the released mass of CIP (wUV) with the mass of the dissolved nanofiber mat (wUV). The 175 drug loading (DL%) was calculated by the following equation (1). 176
DL (%) = (wUV/wMAT) × 100. (1) The drug entrapment efficiency of the nanofiber (EE) was calculated by the follow- 177
ing equation (2). 178
179 EE (%) = (wUV/wES) × 100, (2) where wUV is the calculated mass of CIP released from the nanofibers, and wES is the 180 mass of CIP dissolved before the electrospinning procedure. 181 Each experiment was performed in four parallel measurements, and the average 182
values and standard deviations are reported. 183
184
2.2.7. Solubility tests 185
Solubility tests were carried out in distilled water and pH 7.4 PBS as CIP is a poorly 186 water-soluble drug and has a U-shaped pH-dependent solubility with a minimum 187 around pH 7.4. The first step was to place the pure drug, the physical mixture, and the 188 drug-loaded nanofibrous samples in 3 mL of distilled water (pH 6.3) or PBS (pH 7.4), 189 which were then stirred with a magnetic bar at room temperature for 24 hours. The 190 samples were then filtered (0.22 mm, FilterBio PES Syringe Filter; Labex Ltd., Budapest, 191 Hungary), suitably diluted, and measured with UV spectrophotometry (ABL&E-Jasco 192 UV/VIS Spectrophotometer V-730, Budapest, Hungary) at 275 nm and 271 nm in the case 193 of water and PBS, respectively. The solubility tests of each sample were performed in 194 triplicates, and the average values with the standard deviations are reported. 195 Additionally, the solubility of the CIP was measured with the same methodology in 196 Fasted State Simulating Gastric Fluid (FaSSGF; Biorelevant.com, London, England) and 197 Fasted State Simulating Intestinal Fluid (FaSSIF; Biorelevant.com, London, England) to 198 get data for the in vitro two-stage drug release study. For the UV spectroscopy 277 nm 199 and 272 nm in the case of the FaSSGF and FaSSIF media, respectively, were set as the 200 wavelength of light. The measurements’ results are reported in Section 3.5. 201 202
2.2.8. In vitro drug release studies 203
Two types of in vitro drug release studies were executed to get a more complete 204 picture of the CIP release. Firstly, single medium dissolution (pH 7.4 PBS) with a modi- 205 fied paddle method (Hanson Research SR8-Plus Dissolution Test Station, Chatsworth, 206 CA, USA) was used to measure the drug release from NF6 nanofibers (containing 25 mg 207 CIP) compared with its corresponding physical mixture, and also with 25 mg raw CIP 208 powder. The release studies were carried out in 100 mL of the PBS medium at 37 °C. The 209 paddle was rotated at 100 rpm. 5 mL samples were taken manually from the buffer solu- 210 tion after 5, 10, 15, 30, 60, and 90 minutes. After sampling, the volume was replaced with 211 fresh PBS. The amount of drug present in the aliquots was determined with UV-Vis 212 spectrophotometry (ABL&E-Jasco UV/VIS Spectrophotometer V-730, Budapest, Hun- 213 gary) at a max of 275 nm. The cumulative CIP release (~25 mg = 100%) was calculated 214 using the calibration curve of CIP in pH 7.4 PBS. Each experiment was performed in 215 triplicate, and the average values and standard deviations are reported. 216 Besides, to mimic the in vivo conditions better, a two-stage release test as a biorele- 217 vant gastrointestinal transfer protocol was also studied by the Hanson dissolution tester 218 mentioned above. 25 mg CIP powder was compared with a hundred-fold larger mass of 219 NF6 electrospun sample as the nanofibers were containing 1 w/w% CIP. The samples 220 were first added to 25 mL of FaSSGF, and 2 mL aliquots were taken in the time points: 1, 221 3, 5, 10, 15, and 30 minutes. Right after the last sampling, 25 mL of FaSSIF Concentrate, as 222 a “bolus”, was quickly added to the gastric medium. The FaSSIF Concentrate’s surfactant 223 concentration and buffer strength are doubled compared to those of regular FaSSIF. In 224 this way, after the addition of 25 mL of FaSSIF Concentrate to 25 mL of FaSSGF, the final 225 dissolution medium will be the regular FaSSIF. The methodology and the preparation of 226 the FaSSIF Concentrate are reported by J. Mann et al. [46]. 2 mL aliquots were taken 1, 3, 227 5, 10, 15, 30, and 60 minutes after the medium change. Each taken volume was replaced 228 with fresh FaSSIF media. The dissolution vessels were thermostated at 37 °C and the 229 paddle speed was set to 100 rpm during the experiment. Similarly to the first release 230 study, the cumulative drug release (~25 mg = 100%) was calculated from the absorbance 231 values measured by UV-Vis spectrophotometry at a max of 277 nm and 272 nm in the case 232 of the FaSSGF and FaSSIF media, respectively. Each experiment was performed in trip- 233 licate, and the average values and standard deviations are reported. 234 235
2.2.9. Study of drug-release kinetics and mechanism 236
The release kinetics of CIP from the electrospun nanofiber and physical mixture was 237 compared to the dissolution kinetics of the CIP powder. Five different mathematical 238
models (zero order, first order, Hixson–Crowell, Higuchi, and Korsmeyer-Peppas model) 239 were fitted with the obtained cumulative drug release vs. time curves to describe the ki- 240 netics. To evaluate which model was followed, the value of the regression coefficient (R2) 241
was determined and compared. 242
243 244 245
2.2.10. In vitro diffusion study 246
For the estimation of the passive diffusion of CIP through biological membranes, the 247 Side-Bi-SideTM (Crown Glass, Somerville, NJ, USA) diffusion test was carried out. The 248 cellulose ester membrane (pore diameter = 0.45 µm) was dipped in isopropyl myristate 249 before use. The donor phase was pH 6.8 PBS, and the acceptor phase was pH 7.4 PBS, 250 both were kept at 37 °C temperature. The diffused drug content was measured in 251 real-time at 272 nm by AvaLight DH-S-BAL spectrophotometer (AVANTES, Apeldoorn, 252 The Netherlands) connected to an AvaSpec-2048L transmission immersion probe 253 (AVANTES, Apeldoorn, The Netherlands). The optical path length was 1 cm. The diffu- 254 sion tests of each sample were performed in triplicates, and the average values with the 255
standard deviations are reported. 256
The flux, J, was calculated from the linear part of the graph using the following 257
equation (3): 258
259
J = ∂m/(A ∂t), (3)
where m is the cumulative amount of API transported in t time, and A is the surface 260 area of the membrane (0.875 cm2). The permeability coefficient (Kp) was determined by 261 normalizing the flux to the donor concentration (Cd), according to the equation (4): 262
Kp = J/Cd, (4)
263
2.2.11. Statistical analysis 264
The significance levels of the differences between the measured fiber diameters of 265 the samples produced under different parameters were examined by one-way ANOVA 266 with post-hoc Tukey HSD test. All the experimental results of solubility and single me- 267 dium dissolution tests were expressed as mean ± standard deviation and statistically 268 compared by a two-sample t-test. The experimental results with p values <0.05, <0.01, and 269
<0.001 were assumed to be statistically significant. 270
3. Results and Discussion 271
3.1. Optimization of the electrospinning parameters 272
Reviewing the works focusing on the electrospinning of drug-loaded PVP nanofi- 273 bers, the solution flow rate is found to ranges between 0.2 and 2 mL/h. [23,36–45]. The 274 average fiber diameter of the different formulations was largely varying. One of the aims 275 of this paper was to investigate the effect of flow rate on the diameter of PVP nanofibers, 276 keeping the other preparation parameters constant. Also, nanofibers with different 277 PVP:CIP volume ratios were prepared and studied. Scanning electron microscope was 278 used to visualize the nanofibers, and then their morphology was observed, and the av- 279 erage fiber diameter was measured. The narrowest nanofiber formulation with the finest 280
morphology was targeted during the optimization. 281
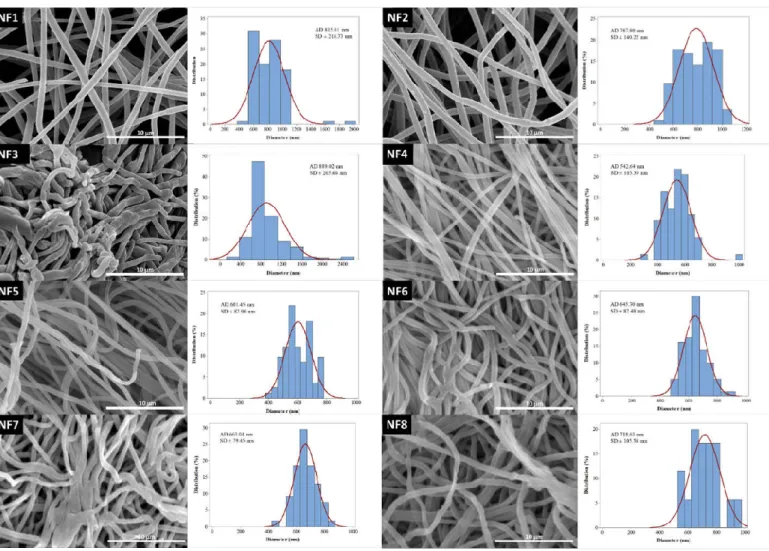
The morphology of drug-free and various drug-loaded nanofibers are represented 282 in Table 3 and Figure 2. Continuous, smooth-surfaced nanofibers were successfully pre- 283 pared from all the solutions studied except for sample NF3. PVP:CIP 1:2 volume ratio 284
eventuated discontinuous, worm-like nanofibers with largely varying diameters (889 ± 285 265 nm). The average diameter of the pure PVP fibers was 815 ± 216 nm. Considering the 286 continuous fibers, the addition of the CIP has decreased the fiber diameter. The decrease 287 was significant except for sample NF2 (Table 4). This is expected to be related to the in- 288 crease in the conductivity of the electrospinning solutions by adding the CIP [47]. Higher 289 solution conductivity could facilitate the elongation of the jet and generate thinner fibers 290 [48]. Additionally, the PVP nanofibers had some narrowing that slightly resembles the 291 formation of beads, as shown in Figure 2. This was probably due to the low PVP con- 292 centration [49]. As the flow rate was increased, the average fiber diameter was increasing, 293 which was expected from the literature [49]. However, the difference was not significant 294 in every case (Table 4). Besides, the 3 mL/h flow rate (NF7) caused incomplete solvent 295 evaporation and merged fibers, while the sample produced by 4 mL/h flow rate (NF8) 296 showed some bead-like structures on top of the merged fibers (Figure 2). According to 297 the results of this study, two formulations, namely NF5 and NF6 had the most optimal 298 morphology and diameter distribution. So, the 1:1 ratio between the PVP and CIP was 299 found optimal, similarly to our previous study [50]. The higher flow rate is desirable for 300 the preparation of samples because of the larger number of nanofibers produced during 301 the same period of time. Since the applied flow rate of NF6 was two times higher than the 302 flow rate of NF5, finally NF6 was selected for further studies. 303
Table 3. Fiber morphology and average diameter of different formulations 304
Sample Fiber morphology Average diameter (nm)
NF1 continuous smooth 815 ± 216
NF2 continuous smooth 787 ± 140
NF3 discontinuous worm-like 889 ± 265
NF4 continuous smooth 542 ± 103
NF5 continuous smooth 601 ± 87
NF6 continuous smooth 645 ± 82
NF7 continuous smooth 663 ± 79
NF8 continuous rough 718 ± 105
305
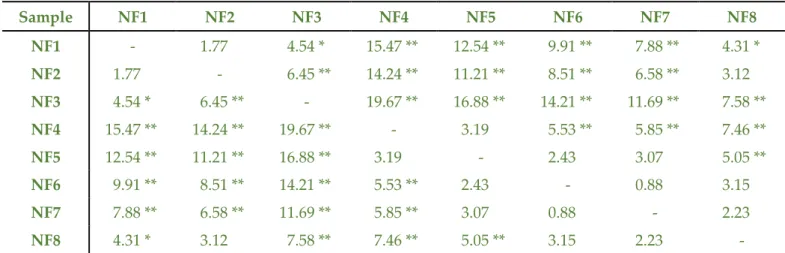
Table 4. Q statistic values of the different nanofibrous formulations as pairs of treatments in one-way ANOVA with post-hoc Tukey 306 HSD test. The significantly different (** p < 0.01; * p < 0.05) pairs of treatments are marked. 307
Sample NF1 NF2 NF3 NF4 NF5 NF6 NF7 NF8
NF1 - 1.77 4.54 * 15.47 ** 12.54 ** 9.91 ** 7.88 ** 4.31 * NF2 1.77 - 6.45 ** 14.24 ** 11.21 ** 8.51 ** 6.58 ** 3.12 NF3 4.54 * 6.45 ** - 19.67 ** 16.88 ** 14.21 ** 11.69 ** 7.58 **
NF4 15.47 ** 14.24 ** 19.67 ** - 3.19 5.53 ** 5.85 ** 7.46 **
NF5 12.54 ** 11.21 ** 16.88 ** 3.19 - 2.43 3.07 5.05 **
NF6 9.91 ** 8.51 ** 14.21 ** 5.53 ** 2.43 - 0.88 3.15 NF7 7.88 ** 6.58 ** 11.69 ** 5.85 ** 3.07 0.88 - 2.23 NF8 4.31 * 3.12 7.58 ** 7.46 ** 5.05 ** 3.15 2.23 -
308
309
Figure 2. SEM images and diameter distributions of nanofibrous samples (5,000x magnification) 310
3.2. Structural characterization 311
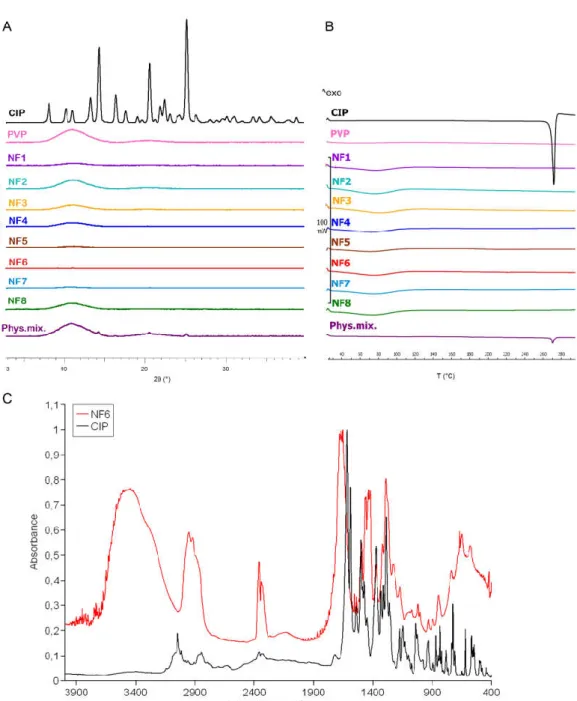
The change in the crystallinity of CIP was studied by XRPD and DSC (Figure 3A and 312 B). The XRPD of the CIP powder showed high crystallinity represented by several 313 smaller and three longer sharp peaks at around 2-Theta = 14.5, 20.9, and 25.4°. The dif- 314 fractogram of the physical mixture also has the same peaks along with a broad peak 315 between 2-Theta = 7-15°. The broad peak appeared in the diffractogram of PVP, physical 316 mixture, and the half of nanofibrous samples prove the polymer amorphous nature. The 317 three characteristic peaks of the CIP are missing from the spectra of the nanofibrous 318 samples, which indicates physicochemical interactions between the drug and the poly- 319 mer matrix, and the amorphous form of CIP created by the fast evaporation of the solvent 320
during electrospinning. 321
Figure 3B presents the DSC thermograms of CIP, PVP, physical mixture, and all the 322 samples listed in Table 2. The melting point of the pure drug is well-defined by a large 323 endothermic peak at 275 °C, also appearing on the thermogram of the physical mixture. 324 However, the flat PVP and NF1-NF8 thermograms suggest amorphous components. It 325 can be concluded from both results that the drug was incorporated in amorphous form 326
into the nanofibers. 327
Main drug-polymer interactions have been observed by FTIR, and the spectra are 328 given in Figure 3C. One prominent characteristic CIP peak at 1732 cm-1 (νC=O) shifted 329 toward the higher wavenumbers and stretched due to the interaction with the hydroxyl 330 groups of the PVP [51]. The wide band between 3050–3750 cm-1 (νC-OH) is enlarged by 331
the hydrogen bonding between the CIP and PVP in the nanofibers. Also, the bands be- 332 tween 3050–2750 cm-1 (alkene and aromatic νC-H), between 2380-2275 cm-1 (νC-N), at 333 1500 cm-1 (quinolone), and at 1290 cm-1 (νC-O) appeared wider in case of the nanofiber 334 [52]. These shifts and widenings confirm the successful incorporation of the CIP into the 335
polymeric fibers. 336
337
Figure 3. XRPD diffractogram (A) and DSC thermograms (B) of ciprofloxacin (CIP), PVP, physical mixture, and NF1-NF8 nanofi- 338 brous samples. All the electrospun samples are amorphous solid dispersions. FTIR spectra (C) of CIP and NF6 nanofibrous sample. 339 The observed shifts and widenings confirm the successful incorporation of the CIP into the polymeric fibers. 340
3.3 Drug loading and drug entrapment efficiency 341
Nanofibers in general exhibits very high entrapment efficiency because the electro- 342 spinning procedure can be considered as an in-situ solidification of a polymer solution. 343 Since both CIP and PVP are non-volatile in nature, high entrapment efficiency was ex- 344
pected under the consideration of complete miscibility. 345
Entrapment efficiency, as well as drug loading, was calculated by UV spectropho- 346 tometry. Solvent with low pH (0.1 M HCl) was used to earn complete dissolution. NF6 347 nanofibrous sample met our expectations with 92 ± 8% entrapment efficiency. Further- 348 more, the theoretical drug loading of the NF6 formulation was 0.99%, while the calcu- 349 lated drug loading was 0.92 ± 0.08%. This data is consistent with the high entrapment ef- 350
ficiency. 351
352
3.4. Solubility test 353
The optimization study revealed that the sample NF6 had the most promising size 354 and morphology for the solubility and dissolution studies. Solubility tests of the raw CIP 355 powder, the physical mixture, and the drug-loaded nanofibrous samples were carried 356 out in distilled water and PBS, as shown in Table 5. CIP has a pH-dependent, U-shaped 357 solubility profile showing high solubility at pH < 5 and pH > 10 and poor solubility 358 around neutral pH level as its isoelectric point is 7.42 [5]. Thus, distilled water and pH 7.4 359 PBS were chosen as solvents to observe the effect of the polymer nanocarrier on the 360 solubility. The pH was measured at the beginning and the end of the tests. The pH values 361 of the solvents before adding the CIP were 6.3 and 7.4 in the case of the distilled water 362 and PBS, respectively. During the 24-h solubility study, the pH of the CIP solution in 363 water increased to 7.1 because CIP as a weak base slightly alkalized the solution. With the 364 increase of the pH level the solubility of the drug decreases which reduces the dissolution 365 of the remaining solid CIP in the system. The buffer capacity of the PBS was sufficient to 366
prevent a notable pH shift. 367
Studies with both solvents suggested that the incorporation of CIP into nanofibers 368 caused a significant increase (p < 0.01 in the case of water and p < 0.05 in the case of PBS) 369 in the drug solubility. In distilled water, the final CIP concentration showed a 12-fold 370 increase in the case of nanofibers compared with the raw CIP, while in the PBS, the nan- 371 ofibers were approx. 6.4 times more soluble. Furthermore, the solubility of the drug in the 372 physical mixture was not significantly higher in either solvent. Thus, it can be seen that 373 only the presence of PVP could enhance solubility by increasing the wettability. How- 374 ever, this enhancement is much lower than in the case of nanofibers, where solid mo- 375 lecular dispersion of CIP has formed during the electrospinning procedure. Solid mo- 376 lecular dispersions can guarantee increased solubility by decreasing the particle size and 377 improving wettability. This finding may be correlated to the characterization results as 378
inside the nanofiber the CIP is in its amorphous form. 379
Table 5. Solubility data of the samples in distilled water and phosphate buffer. The dissolution of 380 the ciprofloxacin (CIP) shifted the pH from 6.3 to 7.1 in distilled water. The nanofiber NF6 has sig- 381 nificantly higher (** p < 0.01; * p < 0.05) solubility than the physical mixture and the raw CIP pow- 382
der. Statistical analysis: Two-sample t-test. 383
Sample Solubility [mg/mL] in water (pH 6.3 → pH 7.1)
Solubility [mg/mL] in PBS (pH 7.4)
CIP 0.071 ± 0.001 0.099 ± 0.001
Physical mixture 0.182 ± 0.035 0.123 ± 0.001
Nanofiber (NF6) 0.862 ± 0.074 0.629 ± 0.186
384
3.5. In vitro drug release 385
The in vitro release profiles of electrospun nanofibers and raw CIP powder were 386 investigated both in single medium dissolution and two-stage biorelevant release tests. 387 On the one hand, pH 7.4 PBS was chosen as a medium while in this pH level CIP has a 388 minimum solubility value, and the pH of the terminal ileum [53], as well as the blood, is 389 around 7.4. The pH-dependent solubility of a drug can cause incomplete dissolution or 390 precipitation, which leads to suboptimal bioavailability. This might generate a problem 391
** ** *
*
with CIP because it occurs mostly at high administered doses [4]. On the other hand, the 392 pH shift occurred by the transfer from the stomach to the small intestine may affect the 393 solubility and the bioavailability of CIP [54]. To investigate this effect, conditions similar 394 to in vivo (biosimilar media, change in pH after 30 minutes, body temperature) were used 395
by a two-stage release study [46]. 396
Figure 4 presents the cumulative drug release vs. time curves of CIP powder, 397 physical mixture, and electrospun sample (NF6) measured in PBS (pH 7.4). In the case of 398 the CIP powder, the dissolution was not complete within 90 min, most probably due to 399 the poor solubility of the drug at this pH. Until 90 minutes, only 41 ± 3% of the drug was 400 liberated. Similarly, the drug release from the physical mixture was 67 ± 12% at the end of 401 the measurement (90 min). However, NF6 showed a significantly higher dissolution rate 402 than CIP powder (p < 0.001) in every measured point. Also, the nanofibrous sample 403 demonstrated significantly higher drug release than the physical mixture (p < 0.05) in 404 time points 5 and 10 minutes. Besides, while all the samples showed fast dissolution be- 405 havior, the release was the fastest from the nanofibers. The improved dissolution rate 406 resulted in 94 ± 6% dissolved CIP within only 5 minutes. The distinct difference between 407 the raw CIP and the nanofibers could be caused by the high surface-to-volume ratio, the 408 high wettability, and the amorphous drug inside the nanofibers. 409 410 Figure 4. In vitro dissolution of ciprofloxacin (CIP) from NF6 nanofiber, physical mixture, and CIP powder in pH 7.4 phosphate 411 buffer solution. All measured NF6 values were significantly higher than the raw CIP values (p < 0.001), and the first two were sig- 412 nificantly higher than the physical mixture values (p < 0.05). Statistical analysis: Two-sample t-test. 413
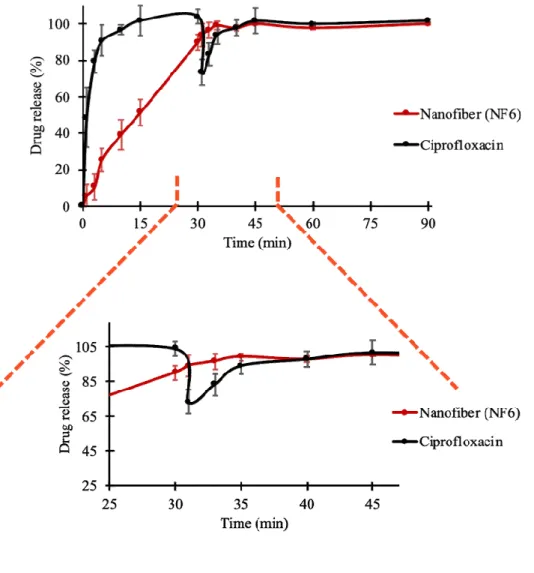
Besides, a two-stage biorelevant release study was executed to mimic the in vivo 414 conditions, since the solubility of CIP is sensitive to changes in pH of the gastrointestinal 415 environment. The raw CIP powder and the NF6 nanofibrous sample were placed into 25 416 mL of FaSSGF medium and the drug release was studied until 30 minutes. From the raw 417 CIP, the release was fast and complete as the whole amount of the added powder was 418 dissolved until 10 minutes (Figure 5). This was expected, since Hansmann et al. publi- 419 cized a similar result with Ciprobay® 500 mg IR tablet [54], and the 24-hour solubility test 420 in FaSSGF (described in Section 2.2.7.) showed 7.794 ± 0.675 mg/mL average CIP con- 421 centration. However, in the case of the electrospun sample, the drug release was slower. 422 It barely reached 90% until the last sampling of the FaSSGF medium. The difference 423 could have caused by the strong gelation of the high molecular weight PVP (Mw = 424 1,300,000) in low pH levels forming a viscous matrix around the CIP, which could re- 425 markably slow down its diffusion to the dissolution medium. 426 As the second phase of the two-stage study, at 30 minutes, FaSSIF Concentrate was 427 added to the FaSSGF dissolution medium to create a 1:1 volume ratio mixture (FaSSIF 428 medium). With this step, the emptying of the stomach into the small intestine is modeled 429 easily [54,55]. Due to the change of pH, the solubility of CIP decreased. 0.205 ± 0.002 430 mg/mL drug concentration was detected as a result of the 24-hour solubility test in FaS- 431 SIF (described in Section 2.2.7.). In the case of the raw CIP samples, this 38-fold decrease 432 caused the precipitation of the pre-dissolved CIP, which was visible in the vessels. Also, a 433
slope can be observed at 30 min time point in Figure 5. Interestingly, the curve of the 434 nanofibrous sample has no slope while the dissolution of the drug was continued even 435 after the change of the medium. From the time point of 40 min, the two curves run to- 436 gether at around 100%. The time range between 25 and 45 minutes is magnified in Figure 437 5. It is evident, that the precipitation of the drug is not desirable due to the predictable 438 decrease in bioavailability. However, according to this in vitro study the precipitation of 439
the CIP can be avoided by nanofiber formulation. 440
Figure 5. In vitro dissolution of ciprofloxacin (CIP) from NF6 nanofiber and CIP powder during the two-stage bio- 441 relevant release study. The dissolution medium (FaSSGF) simulated gastric condition until 30 minutes when the me- 442 dium was turned into FaSSIF biorelevant fluid. The time range around the change of the medium (25 - 45 min) is 443
magnified for the better visualization. 444
445
3.6. Drug-release kinetics and mechanism 446
To describe the release kinetics from nanofibers, usually, five different mathematical 447 models are used, namely zero order, first order, Hixson–Crowell model, Higuchi model, 448 and Korsmeyer–Peppas model. The regression coefficient (R2) values of the different 449
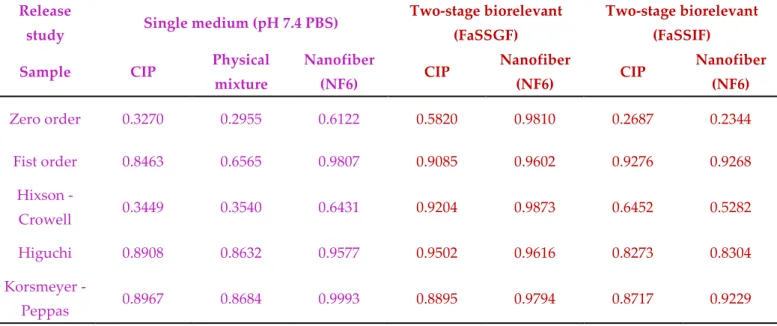
drug release models are listed in Table 6. 450
In the case of the single medium (pH 7.4 PBS) dissolution study, the Kors- 451 meyer-Peppas model showed more superior than other models studied in describing the 452 release kinetic of the raw CIP, the physical mixture, and the NF6 electrospun sample. 453
However, the Korsmeyer-Peppas model could not be fitted very well to the curves of CIP 454 powder (R2 = 0.8967) and physical mixture (R2 = 0.8684), while the drug release of nano- 455 fibers was almost perfectly described by the model (R2 = 0.9993). This is reasonable while 456 the Korsmeyer-Peppas model describes drug release from a polymeric system. It takes 457 into account several mechanisms simultaneously such as the diffusion of water into the 458 polymer matrix, the swelling, and the dissolution of the polymer [52,56]. 459 Furthermore, the Korsmeyer-Peppas model showed a high R2 value both in FaSSGF 460 (R2 = 0.9794) and FaSSIF (R2 = 0.9229) considering the release kinetics of the two-stage 461 biorelevant dissolution study. But in the case of the latter, the first order kinetics could be 462 fitted to the curve even more precisely (R2 = 0.9268). First order was found to be the re- 463 lease kinetics of the raw CIP in FaSSIF medium, as well, which means that the dissolution 464 rate of CIP from the PVP matrix was dependent on the drug concentration. This can be 465 explained by the change of pH caused by the change of the medium at 30 minutes. The 466 solution was supersaturated, and the higher pH caused the decrease of the solubility of 467 the drug. Near to its solubility limit, the concentration of the CIP could affect the release 468
kinetics. 469
In terms of the other medium, the release of the CIP powder followed the Higuchi 470 model (R2 = 0.9502) while the highest R2 values of the nanofibrous sample were related to 471 zero order (R2 = 0.9810) and the Hixson-Crowell model (R2 = 0.9873). The difference in the 472 course of the curves can also be seen in Figure 5. The Higuchi model describes the drug 473 release from different matrix systems which contain water-soluble drugs [52]. The 474 FaSSGF is a good solvent of the CIP and without any polymer in the system, it could 475 dissolve freely. On the other hand, the PVP formed a viscous, hemisphere gel at the bot- 476 tom of the vessel causing the Hixson-Crowell model. This release model considering the 477 dissolution of the tablet or polymer matrix but with the maintenance of the geometrical 478
characteristics. 479
Table 6. Regression coefficient values of the different drug release models. 480 Release
study Single medium (pH 7.4 PBS) Two-stage biorelevant (FaSSGF)
Two-stage biorelevant (FaSSIF)
Sample CIP Physical
mixture
Nanofiber
(NF6) CIP Nanofiber
(NF6) CIP Nanofiber
(NF6)
Zero order 0.3270 0.2955 0.6122 0.5820 0.9810 0.2687 0.2344
Fist order 0.8463 0.6565 0.9807 0.9085 0.9602 0.9276 0.9268
Hixson -
Crowell 0.3449 0.3540 0.6431 0.9204 0.9873 0.6452 0.5282
Higuchi 0.8908 0.8632 0.9577 0.9502 0.9616 0.8273 0.8304
Korsmeyer -
Peppas 0.8967 0.8684 0.9993 0.8895 0.9794 0.8717 0.9229
481 482 483
3.7. In vitro diffusion study 484
In vitro diffusion study was executed to compare the capacity of CIP from different 485 samples (NF6 nanofiber, physical mixture, CIP powder) for crossing biological barriers 486 e.g., the small intestine cells (Figure 6). In the literature, it is suggested that the CIP is 487 absorbed from the duodenum and the proximal jejunum [57]. So, during the in vitro dif- 488
fusion study, pH 6.8 PBS was used as donor phase. The acceptor phase (pH 7.4 PBS) 489 modeled the intracellular pH (“set-point” pHi 7.35) of intestinal absorptive cells [58]. 490 Since the absorption of ciprofloxacin seems to be mainly mediated not by active but pas- 491 sive diffusion [54], a synthetic membrane was used to separate the two phases. 492 According to the results, the diffusion of the CIP was remarkably higher from the 493 nanofibrous sample (215 µg/cm2) than the raw CIP (122 µg/cm2) or the physical mixture 494 (118 µg/cm2). Figure 6 shows the diffusion profiles of CIP from the samples. The diffused 495 CIP over time curve of the physical mixture interestingly runs with the curve of the 496 nanofibrous sample until the first 20 minutes, but after it becomes flatter as the CIP dif- 497 fusion slows down. Finally, at the time range between 80 and 120 minutes, it overlaps 498 with the curve of the pure CIP powder. This fascinating behavior could be caused by the 499 presence of PVP. As written previously, the PVP is a wetting agent that could increase 500 the solubility of the drug. More solute CIP means a higher concentration gradient, which 501 results in faster diffusion. However, the effect of this increase has a limit, and beyond 502
that, the solution and diffusion of CIP slow down. 503
Figure 6. In vitro diffusion of ciprofloxacin (CIP) from the NF6 nanofibrous sample, physical mixture, and CIP powder (SD±2%) 504 The calculated flux (J) and permeability coefficient (Kp) values are shown in Table 7. 505 The diffused CIP amount was 1.7 times higher from the NF6 sample than from the non- 506 fibrous samples. The presence of the PVP did not affect the diffusion since the results of 507 the physical mixture were similar to the CIP powders. Moreover, the permeability coef- 508 ficient was increased 1.9 times by the nanofiber formulation. 509 Table 7. Calculated flux (J) and permeability coefficient (Kp) values 510
Sample J (µg/(cm2 h)) Kp (cm/h)
CIP 60.94 0.112
Physical mixture 58.80 0.105
Nanofiber (NF6) 107.71 0.217
511 512 513 514
4. Conclusions 515
Since CIP is a BSC Class IV drug, various pharmaceutical technological approaches 516 are desirable to improve its bioavailability through the improvement in the solubility, the 517 dissolution, and the permeability. One such approach is the formulation of nanofibers via 518 electrospinning, which is a simple and cost-effective production technique. Electrospun 519
nanofibers, beside solid nanoparticles, are considered as amorphous solid dispersions, 520 and promising nanocarriers. The nanofibers are favorable drug carriers because of the 521 high specific surface area, the wide variety of polymers and APIs spinnable, the ease of 522 material combination, and the capability for mass production. 523 In the present study, CIP-loaded nanofibers were successfully fabricated by elec- 524 trospinning. With the optimized process parameters, the nanofibers had small, uniform 525 fiber diameter with smooth surface morphology. The flow rates used in PVP-based nan- 526 ofiber fabrication were compared. It was found that a higher flow rate produced thicker 527 fibers, but in the case of too high a flow rate, the fibers were merged because the solvent 528 evaporation was incomplete. According to the results of the XRPD and the DSC meas- 529 urements, the CIP lost its crystallinity during the electrospinning procedure, and an 530 amorphous form was produced. This form of the drug, along with the increased surface 531 area, is the reason for the significantly higher solubility and in vitro dissolution rate in pH 532 7.4 PBS achieved with the nanofibrous samples. In the single medium release study (pH 533 7.4 PBS), the nanofibrous formulation demonstrated fast dissolution and the release ki- 534 netics followed Korsmeyer-Peppas model. In contrast, the raw CIP showed incomplete 535 dissolution due to its poor solubility at this pH level. To mimic more precisely the in vivo 536 conditions, a two-stage biorelevant release study was executed. Since the CIP is more 537 soluble at low pH levels, a supersaturated solution was formed with the FaSSGF me- 538 dium. Then, with the change of the medium to FaSSIF, the solubility of the drug changed, 539 and precipitation occurred. The precipitation could be prevented by nanofibers, since the 540 PVP formed a viscous matrix around the CIP and released it with the dissolution kinetics 541 described the best by Hixson-Crowell model and zero order kinetics. Moreover, incor- 542 poration of CIP into nanofibers could provide noticeable higher in vitro diffusion through 543 the membrane. Therefore, our results showed that CIP-loaded PVP-nanofibers could be 544 considered as fast-dissolving formulations with improved physicochemical properties 545 and may be suitable for further studies to develop an oral dosage form. 546 547 Author Contributions: Conceptualization, L.É.U., P.S-R. and R.A.; methodology, L.É.U., S.Y.K., 548 N.R., V.K., P.S-R. and R.A.; validation, V.K. and P.S-R.; formal analysis and investigation, L.É.U. 549 and A.R.; writing—original draft preparation, L.É.U.; writing—review and editing, S.Y.K., N.R., 550 V.K., P.S-R., and R.A.; visualization, L.É.U., and N.R.; supervision, N.R., V.K., P.S-R., and R.A.; 551 funding acquisition, A.R. All authors have read and agreed to the published version of the manu- 552
script. 553
Funding: The publication was funded by The University of Szeged Open Access Fund (FundRef, 554
Grant No. 5249). 555
Data Availability Statement: The datasets used and/or analyzed are available from the corre- 556
sponding author on reasonable request. 557
Acknowledgments: This project was supported by the Gedeon Richter's Talentum Foundation, 558 Gedeon Richter Plc. Also, Ministry of Human Capacities, Hungary grant TKP 2020, and EFOP 559 3.6.3-VEKOP-16-2017-00009 are acknowledged. The authors would like to thank Areen Alshweiat 560 of University of Szeged for her help in the sample preparation, and Gábor Katona of University of 561 Szeged and Gregory Myles of The University of Edinburgh for reviewing the paper. 562 Conflicts of Interest: The authors declare no conflict of interest. 563
References 564
1. Di, L.; Kerns, E.; Carter, G. Drug-Like Property Concepts in Pharmaceutical Design. Curr. Pharm. Des. 2009, 15, 2184–2194, 565
doi:10.2174/138161209788682479. 566
2. Williams, H.D.; Trevaskis, N.L.; Charman, S.A.; Shanker, R.M.; Charman, W.N.; Pouton, C.W.; Porter, C.J.H. Strategies to 567 Address Low Drug Solubility in Discovery and Development. Pharmacol. Rev. 2013, 65, 315–499, doi:10.1124/pr.112.005660. 568 3. Loftsson, T.; Brewster, M.E. Pharmaceutical Applications of Cyclodextrins: Basic Science and Product Development: 569 Pharmaceutical Applications of Cyclodextrins. J. Pharm. Pharmacol. 2010, 62, 1607–1621, doi:10.1111/j.2042-7158.2010.01030.x. 570 4. Olivera, M.E.; Manzo, R.H.; Junginger, H.E.; Midha, K.K.; Shah, V.P.; Stavchansky, S.; Dressman, J.B.; Barends, D.M. 571 Biowaiver Monographs for Immediate Release Solid Oral Dosage Forms: Ciprofloxacin Hydrochloride. J. Pharm. Sci. 2011, 100, 572
22–33, doi:10.1002/jps.22259. 573
5. Ross, D.; Riley, C. Aqueous Solubilities of Some Variously Substituted Quinolone Antimicrobials. Int. J. Pharm. 1990, 63, 574
237–250, doi:10.1016/0378-5173(90)90130-V. 575
6. Caço, A.I.; Varanda, F.; Pratas de Melo, M.J.; Dias, A.M.A.; Dohrn, R.; Marrucho, I.M. Solubility of Antibiotics in Different 576 Solvents. Part II. Non-Hydrochloride Forms of Tetracycline and Ciprofloxacin. Ind. Eng. Chem. Res. 2008, 47, 8083–8089, 577
doi:10.1021/ie8003495. 578
7. Radacsi, N.; Ambrus, R.; Szabó-Révész, P.; van der Heijden, A.; ter Horst, J.H. Atmospheric Pressure Cold Plasma Synthesis of 579 Submicrometer-Sized Pharmaceuticals with Improved Physicochemical Properties. Cryst. Growth Des. 2012, 12, 5090–5095, 580
doi:10.1021/cg301026b. 581
8. Kariminia, S.; Shamsipur, A.; Shamsipur, M. Analytical Characteristics and Application of Novel Chitosan Coated Magnetic 582 Nanoparticles as an Efficient Drug Delivery System for Ciprofloxacin. Enhanced Drug Release Kinetics by Low-Frequency 583 Ultrasounds. J. Pharm. Biomed. Anal. 2016, 129, 450–457, doi:10.1016/j.jpba.2016.07.016. 584 9. Zattoni, A. Flow Field-Flow Fractionation for the Analysis of Nanoparticles Used in Drug Delivery. J. Pharm. Biomed. Anal. 585
2014, 9. 586
10. Jermain, S.V.; Brough, C.; Williams, R.O. Amorphous Solid Dispersions and Nanocrystal Technologies for Poorly 587 Water-Soluble Drug Delivery – An Update. Int. J. Pharm. 2018, 535, 379–392, doi:10.1016/j.ijpharm.2017.10.051. 588 11. Ogawa, N.; Hiramatsu, T.; Suzuki, R.; Okamoto, R.; Shibagaki, K.; Fujita, K.; Takahashi, C.; Kawashima, Y.; Yamamoto, H. 589 Improvement in the Water Solubility of Drugs with a Solid Dispersion System by Spray Drying and Hot-Melt Extrusion with 590 Using the Amphiphilic Polyvinyl Caprolactam-Polyvinyl Acetate-Polyethylene Glycol Graft Copolymer and d-Mannitol. Eur. 591
J. Pharm. Sci. 2018, 111, 205–214, doi:10.1016/j.ejps.2017.09.014. 592
12. Kumar, R. Nanotechnology Based Approaches to Enhance Aqueous Solubility and Bioavailability of Griseofulvin: A 593 Literature Survey. J. Drug Deliv. Sci. Technol. 2019, 53, 101221, doi:10.1016/j.jddst.2019.101221. 594 13. Murdande, S.B.; Pikal, M.J.; Shanker, R.M.; Bogner, R.H. Solubility Advantage of Amorphous Pharmaceuticals: II. Application 595 of Quantitative Thermodynamic Relationships for Prediction of Solubility Enhancement in Structurally Diverse Insoluble 596
Pharmaceuticals. Pharm. Res. 2010, 27, 2704–2714, doi:10.1007/s11095-010-0269-5. 597
14. Horter, D.; Dressman, J.B. Influence of Physicochemical Properties on Dissolution of Drugs in the Gastrointestinal Tractq. Adv. 598
Drug Deliv. Rev. 2001, 13. 599
15. Günday, C.; Anand, S.; Gencer, H.B.; Munafò, S.; Moroni, L.; Fusco, A.; Donnarumma, G.; Ricci, C.; Hatir, P.C.; Türeli, N.G.; et 600 al. Ciprofloxacin-Loaded Polymeric Nanoparticles Incorporated Electrospun Fibers for Drug Delivery in Tissue Engineering 601 Applications. Drug Deliv. Transl. Res. 2020, 10, 706–720, doi:10.1007/s13346-020-00736-1. 602 16. Arafa, M.G.; Mousa, H.A.; Afifi, N.N. Preparation of PLGA-Chitosan Based Nanocarriers for Enhancing Antibacterial Effect of 603 Ciprofloxacin in Root Canal Infection. Drug Deliv. 2020, 27, 26–39, doi:10.1080/10717544.2019.1701140. 604 17. Benedini, L.; Laiuppa, J.; Santillán, G.; Baldini, M.; Messina, P. Antibacterial Alginate/Nano-Hydroxyapatite Composites for 605 Bone Tissue Engineering: Assessment of Their Bioactivity, Biocompatibility, and Antibacterial Activity. Mater. Sci. Eng. C 2020, 606
115, 111101, doi:10.1016/j.msec.2020.111101. 607
18. MOCANU, A.-G.; BELU, I. Formulation and Characterization of Ciprofloxacin Loaded PLGA Microspheres for Applications 608 in Orthopedic Infections. Curr. Health Sci. J. 2017, 306–310, doi:10.12865/CHSJ.43.04.03. 609 19. Lamy, B.; Tewes, F.; Serrano, D.R.; Lamarche, I.; Gobin, P.; Couet, W.; Healy, A.M.; Marchand, S. New Aerosol Formulation to 610 Control Ciprofloxacin Pulmonary Concentration. J. Controlled Release 2018, 271, 118–126, doi:10.1016/j.jconrel.2017.12.021. 611 20. Khatib, I.; Tang, P.; Ruan, J.; Cipolla, D.; Dayton, F.; Blanchard, J.D.; Chan, H.-K. Formation of Ciprofloxacin Nanocrystals 612 within Liposomes by Spray Drying for Controlled Release via Inhalation. Int. J. Pharm. 2020, 578, 119045, 613
doi:10.1016/j.ijpharm.2020.119045. 614
21. Torge, A. Ciprofloxacin-Loaded Lipid-Core Nanocapsules as Mucus Penetrating Drug Delivery System Intended for the 615
Treatment of Bacterial Infections in Cystic Fibrosis. Int. J. Pharm. 2017, 11. 616
22. Tran, T.-T.; Vidaillac, C.; Yu, H.; Yong, V.F.L.; Roizman, D.; Chandrasekaran, R.; Lim, A.Y.H.; Low, T.B.; Tan, G.L.; 617 Abisheganaden, J.A.; et al. A New Therapeutic Avenue for Bronchiectasis: Dry Powder Inhaler of Ciprofloxacin Nanoplex 618 Exhibits Superior Ex Vivo Mucus Permeability and Antibacterial Efficacy to Its Native Ciprofloxacin Counterpart. Int. J. 619
Pharm. 2018, 547, 368–376, doi:10.1016/j.ijpharm.2018.06.017. 620
23. Rancan; Contardi; Jurisch; Blume-Peytavi; Vogt; Bayer; Schaudinn Evaluation of Drug Delivery and Efficacy of 621 Ciprofloxacin-Loaded Povidone Foils and Nanofiber Mats in a Wound-Infection Model Based on Ex Vivo Human Skin. 622
Pharmaceutics 2019, 11, 527, doi:10.3390/pharmaceutics11100527. 623
24. Yang; Zhang; Zhang Electrospun Chitosan/Poly (Vinyl Alcohol)/Graphene Oxide Nanofibrous Membrane with 624 Ciprofloxacin Antibiotic Drug for Potential WoundDressing Application. Int. J. Mol. Sci. 2019, 20, 4395, 625
doi:10.3390/ijms20184395. 626
25. Paaver, U.; Heinämäki, J.; Laidmäe, I.; Lust, A.; Kozlova, J.; Sillaste, E.; Kirsimäe, K.; Veski, P.; Kogermann, K. Electrospun 627 Nanofibers as a Potential Controlled-Release Solid Dispersion System for Poorly Water-Soluble Drugs. Int. J. Pharm. 2015, 479, 628
252–260, doi:10.1016/j.ijpharm.2014.12.024. 629
26. Sipos, E.; Kósa, N.; Kazsoki, A.; Szabó, Z.-I.; Zelkó, R. Formulation and Characterization of Aceclofenac-Loaded Nanofiber 630 Based Orally Dissolving Webs. Pharmaceutics 2019, 11, 417, doi:10.3390/pharmaceutics11080417. 631 27. Villarreal-Gómez, L.J.; Cornejo-Bravo, J.M.; Vera-Graziano, R.; Grande, D. Electrospinning as a Powerful Technique for 632 Biomedical Applications: A Critically Selected Survey. J. Biomater. Sci. Polym. Ed. 2016, 27, 157–176, 633
doi:10.1080/09205063.2015.1116885. 634
28. Ambekar, R.S.; Kandasubramanian, B. Advancements in Nanofibers for Wound Dressing: A Review. Eur. Polym. J. 2019, 117, 635
304–336, doi:10.1016/j.eurpolymj.2019.05.020. 636
29. Barhoum, A.; Pal, K.; Rahier, H.; Uludag, H.; Kim, I.S.; Bechelany, M. Nanofibers as New-Generation Materials: From 637 Spinning and Nano-Spinning Fabrication Techniques to Emerging Applications. Appl. Mater. Today 2019, 17, 1–35, 638