Disorders of the Nervous System
Neuregulin 1 Type I Overexpression Is Associated with Reduced NMDA Receptor–Mediated
Synaptic Signaling in Hippocampal Interneurons Expressing PV or CCK
Dimitrios Kotzadimitriou,1,ⴱWiebke Nissen,1,ⴱMelinda Paizs,2Kathryn Newton,1 Paul J. Harrison,3 Ole Paulsen,4and Karri Lamsa1,2
DOI:http://dx.doi.org/10.1523/ENEURO.0418-17.2018
1Department of Pharmacology, University of Oxford, Oxford, OX1 3QT, UK,2Department of Physiology, Anatomy and Neuroscience, University of Szeged, Szeged, 6720, Hungary,3Department of Psychiatry, University of Oxford, and Oxford Health NHS Foundation Trust, Oxford, UK, and4Department of Physiology, Development and Neuroscience, University of Cambridge, Cambridge, UK
Abstract
Hypofunction ofN-methyl-D-aspartate receptors (NMDARs) in inhibitory GABAergic interneurons is implicated in the pathophysiology of schizophrenia (SZ), a heritable disorder with many susceptibility genes. However, it is still unclear how SZ risk genes interfere with NMDAR-mediated synaptic transmission in diverse inhibitory interneuron populations. One putative risk gene is neuregulin 1 (NRG1), which signals via the receptor tyrosine kinase ErbB4, itself a schizophrenia risk gene. The type I isoform of NRG1 shows increased expression in the brain of SZ patients, and ErbB4 is enriched in GABAergic interneurons expressing parvalbumin (PV) or cholecystokinin (CCK).
Here, we investigated ErbB4 expression and synaptic transmission in interneuronal populations of the hippocam- pus of transgenic mice overexpressing NRG1 type I (NRG1tg-type-Imice). Immunohistochemical analyses con- firmed that ErbB4 was coexpressed with either PV or CCK in hippocampal interneurons, but we observed a reduced number of ErbB4-immunopositive interneurons in the NRG1tg-type-Imice. NMDAR-mediated currents in interneurons expressing PV (including PV⫹basket cells) or CCK were reduced in NRG1tg-type-Imice compared to their littermate controls. We found no difference in AMPA receptor–mediated currents. Optogenetic activation (5 pulses at 20 Hz) of local glutamatergic fibers revealed a decreased NMDAR-mediated contribution to disynaptic GABAergic inhibition of pyramidal cells in the NRG1tg-type-Imice. GABAergic synaptic transmission from either PV⫹ or CCK⫹ interneurons, and glutamatergic transmission onto pyramidal cells, did not significantly differ between genotypes. The results indicate that synaptic NMDAR-mediated signaling in hippocampal interneurons
Significance Statement
Hypofunction of NMDA receptors in inhibitory GABAergic interneurons is implicated in pathophysiology of schizophrenia (SZ), but it is largely unknown how SZ risk genes interfere with NMDAR-mediated signaling in specific interneurons. We investigated synaptic transmission in hippocampus of mice overexpressing the type I isoform of the putative SZ risk gene, NRG1, and found markedly reduced NMDAR-mediated synaptic responses in GABAergic interneuron types labeled for PV or CCK, which are known to express the NRG1 receptor ErbB4. The NMDAR hypofunction changed synaptic excitatory drive of interneurons during hippocampal network activity. The observed reductions of NMDAR-mediated transmission in these in- terneurons may contribute to the hippocampal dysfunction observed with increased NGR1 type I expres- sion and may provide a link to the genetic predisposition to SZ.
is sensitive to chronically elevated NGR1 type I levels. This may contribute to the pathophysiological conse- quences of increasedNRG1expression in SZ.
Key words:Axo-axonic cell; basket cell; cholecystokinin; ErbB4 receptor; NMDA receptors; parvalbumin;
schizophrenia
Introduction
Many schizophrenia (SZ) susceptibility genes have been linked to N-methyl-D-aspartate receptor (NMDAR) signaling (Harrison and Weinberger, 2005; Hall et al., 2015), consistent with the hypothesis that NMDAR hypo- function contributes to the disease pathophysiology (Ol- ney and Farber, 1995;Coyle, 2012;Gonzalez-Burgos and Lewis, 2012). It has been proposed that NMDAR function could particularly be impaired in hippocampal and neo- cortical GABAergic interneurons in the disorder, compro- mising recurrent inhibition (Carlén et al., 2012;Curley and Lewis, 2012; Gilmour et al., 2012). Two prominent GABAergic inhibitory interneuron subpopulations, defined by mutually exclusive markers parvalbumin (PV) or chole- cystokinin (CCK), are strongly involved through recurrent inhibition in rhythmic network activities in the neocortex and hippocampus (Cobb et al., 1995;Ellender and Paulsen, 2010;Manseau et al., 2010;Lasztóczi et al., 2011;Buzsáki and Wang, 2012;Fasano et al., 2017;Pelkey et al., 2017).
Disrupted function of either of these interneuron popula- tions in animal models results in alterations of coordinated neuronal network activities, particularly the synchronous gamma frequency (20 – 80 Hz) oscillations, and causes behavioral changes associated with the disorder (Belforte et al., 2010; Nakazawa et al., 2012; Brown et al., 2014;
Schmidt et al., 2014;Cho et al., 2015;Gonzalez-Burgos et al., 2015; Schmidt and Mirnics, 2015; Huang et al.,
2016;Del Pino et al., 2017;Medrihan et al., 2017;Vargish et al., 2017). However, whether and how specific SZ sus- ceptibility genes interfere with NMDAR-mediated synaptic signaling in these interneurons is still not well known (Gonzalez-Burgos and Lewis, 2012;Vullhorst et al., 2015).
In this respect, the gene for neuregulin 1 (NRG1) is a relevant candidate to study because diverse evidence links it to NMDAR function and SZ pathogenesis (Stefans- son et al., 2002;Corfas et al., 2004;Gu et al., 2005;Hahn et al., 2006; Law et al., 2006; Bjarnadottir et al., 2007;
Chong et al., 2008; Pitcher et al., 2011; Weickert et al., 2013). Moreover, the main receptor for NRG1 signaling, ErbB4, itself a schizophrenia risk gene (Schizophrenia Work- ing Group of the Psychiatric Genomics Consortium, 2014), is expressed in PV⫹and CCK⫹GABAergic interneurons but not in glutamatergic pyramidal cells (Vullhorst et al., 2009;
Fazzari et al., 2010;Neddens et al., 2011; Del Pino et al., 2017).
NRG1 has several functionally distinct isoforms, of which type I (among others) has been reported to be overex- pressed in SZ (Hashimoto et al., 2004; Law et al., 2006).
Overexpression of NRG1 type I mRNA, or administration of the protein in early postnatal development, results in pathophysiological changes reminiscent of schizophrenia endophenotype in animal models: alterations in rhythmic gamma-frequency network oscillations (Deakin et al., 2012) and synaptic plasticity (Agarwal et al., 2014), and a behavioral phenotype including age-emergent impair- ment of hippocampal working memory (Chen et al., 2008;
Deakin et al., 2009;Kato et al., 2011;Yin et al., 2013;Luo et al., 2014). These findings together suggest that NRG1- ErbB4 signaling may regulate glutamatergic NMDAR- mediated transmission in interneurons, and that alterations in this mechanism might contribute to the pathophysiology of SZ. To investigate this possibility, we have studied synaptic function in hippocampal interneu- rons expressing PV or CCK in mice overexpressing NRG1 type 1, using a combination of electrophysiological, op- togenetic, and immunohistochemical techniques.
Materials and Methods
Ethics statement
All animal procedures were performed in accordance with British Home Office regulations and personal and project licenses held by the authors, following local ethics review at the University of Oxford (UK).
Experimental animals
Experiments were conducted on heterozygous (at least 1 month old) NRG1 type I transgenic (NRG1tg-type-I) mice of either sex, overexpressing NRG1 type I (1a-isoform) under a Thy-1.2 promoter (RRID:MGI:3530784;Michailov et al., 2004). To specifically express fluorescent marker in PV interneurons, PV-Cre⫹/⫹ mice (The Jackson Labora- tory, B6;129P2-Pvalbtm1[cre]Arbr/J; RRID:IMSR_JAX:
Received December 4, 2017; accepted February 28, 2018; First published April 20, 2018.
The authors declare no competing financial interests.
Author contributions: designed research (DK, WN, PJH, OP, KL), performed research (DK, WN, MP, KN, KL). analyzed data (DK, WN, MP, KN, KL), wrote the paper (DK, WN, KL).
This work was supported by the Medical Research Council UK (DK, WN, KN, OP, KL), the John Fell OUP Research Fund (KL), the Biotechnology and Biological Sciences Research Council UK (OP), Wellcome Trust (PJH, KL), Hungarian Academy of Sciences Neuroscience Program 2017-1.2.1-NKP- 2017-00002 (MP, KL), the Oxford University Vice-Chancellor’s grant (WN) and Keble College, Oxford (DK).
*D.K. and W.N. contributed equally to this paper.
Acknowledgments: We thank Dr. Ed Mann for donating Ai9 and Ai9xPV-Cre mice; Drs. Klaus-Armin Nave and Markus Schwab (MPI G¨ ottingen, Germany) for the gift of NRG1tg-type-Imice; Dr. Andres Buonanno (National Institute of Child Health and Human Development, Bethesda, MD, USA) for the rabbit anti-ErbB4 antibody; Dr. Andras Szabo for help in anatomic analysis and cell reconstructions; Linda Avena, Fabian Peters, and Matt Prior for contributing to initial experiments; Drs. Marco Bocchio, Alexei Bygrave, Marco Capogna, Liliana Minichiello, Pavel Perestenko, and Ayesha Sengupta for scientific advice and discussions; and the Peter Somogyi laboratory in MRC ANU for help with anatomic and immunohistochemical procedures.
Correspondence should be addressed to Karri Lamsa, Department of Phys- iology, Anatomy and Neuroscience, University of Szeged, Kozep fasor 52, 6720 Szeged, Hungary. Email:klamsa@bio.u-szeged.hu.
DOI:http://dx.doi.org/10.1523/ENEURO.0418-17.2018 Copyright © 2018 Kotzadimitriou et al.
This is an open-access article distributed under the terms of theCreative Commons Attribution 4.0 International license, which permits unrestricted use, distribution and reproduction in any medium provided that the original work is properly attributed.
017320) were crossbred with Ai9⫹/⫹ mice (The Jackson Laboratory, B6.Cg-Gt[ROSA]26Sortm9[CAG-tdTomato]
Hze/J; RRID:IMSR_JAX:007909) to produce tdTomato ex- pression in the PV⫹cells (Figs. 1,2 and 3). The female offspring were further crossed with the NRG1tg-type-I ⫹/⫺
males. For the experiments in Fig. 4, Lhx6-eGFP⫹/⫺fe- males expressing GFP in PV cells (The Jackson Laboratory, Tg[Lhx6-EGFP]BP221Gsat/M, RRID:MMRRC_000246-MU) were crossbred with male NRG1tg-type-I⫹/⫺mice, and an- atomically identified basket cells in hippocampal slices (Nissen et al., 2010) were defined as PV⫹ basket cells (PVBCs) and confirmed immunonegative for axonal can- nabinoid receptor type 1 (CB1R;Armstrong and Soltesz, 2012). To express fluorescent marker in CCK neurons, BAC-CCK-Cre⫹/⫺ mice (Geibel et al., 2014; RRID:MGI:
5575864) were crossed with the Ai9⫹/⫹mice for tdTomato expression in the CCK⫹cells. For the virus transduction studies, PV-Cre⫹/⫹females (The Jackson Laboratory, B6;
129P2-Pvalbtm1[cre]Arbr/J; RRID:IMSR_JAX:017320), heterozygous BAC-CCK- Cre ⫹/⫺ females (RRID:MGI:
5575864), or CaMKII-Cre⫹/⫹females (B6.Cg-Tg[Camk2a- cre]T29-1Stl/J; RRID:IMSR_JAX:005359) were crossbred with male NRG1tg-type-I ⫹/⫺ mice. The Cre-expressing NRG1tg-type-I and control littermates were injected with adeno-associated virus construct encoding opsin.
Opsin construct transduction
Mice were anesthetized with 2%– 4% isoflurane (CHEBI:
6015). AAV2-ChR2-eYFP (in some cases AAV5-ChR2- eYFP) was stereotactically injected via 33-gauge needle attached to a Microlitre Syringe (Hamilton) into midventral CA3 or dorsal CA1 hippocampus. The vector sequence was: pAAV-EF1a-sCreDIO hChR2(H134R)-EYFP-WPRE (Vector Core Services, Gene Therapy Center Virus, Uni- versity of North Carolina). In each hemisphere, a craniot- omy was performed using a micro-torque, and a total volume of 800 nl virus suspension (viral particle suspen- sion titer 4 ⫻ 1012/mL) was delivered at 80 nl/min by a Micro Syringe Pump Controller (World Precision Instru- ments). The scalp incision was sutured, and mice were allowed to recover for 10 –21 d. Light exposure of brain tissue during preparation of slices was minimized to avoid photoactivation of ChR2. In experiments, ChR2 was acti- vated by a fixed-spot laser (Laser nominal maximum power 100 mW; Rapp OptoElectronics) light (20-m diameter to evoke IPSCs with minimal stimulation of GABAergic fibers, and 80-m diameter in experiments stimulating glutamater- gic fibers with 20-Hz train stimulation) via the microscope objective.
Identification of interneuron populations and pyramidal cells
CCK interneurons inFig. 1were tagged by the fluores- cent marker tdTomato using the crossed mouse line:
BAC-CCK-Cre tg with Ai9 mice. InFig. 2, CCK-expressing interneurons were identified with positive immunoreaction for somatic pro-CCK or by positive immunoreaction for axonal CB1R when the soma recovery was compromised.
InFigs. 1,2, and3, the PV-expressing cells were identified by genetic fluorescence marker in PV-Cre mice crossed with Ai9 mice. Recorded cells were filled with neurobiotin
(0.3% w/v) and visualized, and some were anatomically identified as basket cells by their characteristic predomi- nant axon distribution instr. pyramidale and the lack of axo-axonic cell axon terminal cartridges (Klausberger and Somogyi, 2008). In addition, the basket cells inFig. 4were confirmed immunonegative for axonal CB1R (Katona et al., 1999;Tsou et al., 1999;Bodor et al., 2005;Armstrong and Soltesz, 2012). Pyramidal cells (PCs) were identified by their somatodendritic structure with mushroom spines along the dendrites.
Electrophysiological recordings
Mice were anesthetized with sodium-pentobarbitone and decapitated. After brain removal, horizontal (for mid- ventral hippocampus) or coronal (for dorsal hippocampus) brain slices (250m) were cut using a vibrating microtome (Microm HM650V) in oxygenated (95% O2/5% CO2) ice- cold (0 – 4°C) cutting solution. The composition of the cutting solution was (in mM): 75 sucrose, 87 NaCl, 2.5 KCl, 0.5 CaCl2, 7 MgCl2, 1.0 NaH2PO4, 25 NaHCO3, 25 glu- cose, pH 7.4, bubbled with 95% O2/5% CO2. Slices were kept submerged at 32°C in the sucrose solution for 20 –25 min before being transferred to an interface chamber in which they were maintained in Earle’s balanced salt so- lution (Thermo Fisher Scientific, 14155063) with 3 mm Mg2⫹and 1 mm Ca2⫹at room temperature (20 –24°C) for at least 60 min before starting experiments. In the experi- ments, the slices were superfused with oxygenated record- ing solution at 5 mL/min in a submerged-type recording chamber at 30°C (Luigs & Neumann) mounted on Olympus BX51 microscope stage (20⫻ objective, 2– 4 zoom) with epifluorescence and filters (eGFP, eYFP, tdTomato) and DIC-IR with a CCD camera (Till Photonics). The superfusion solution was (in mM): 119 NaCl, 2.5 KCl, 2.5 CaCl2, 1.3 MgSO4, 1.25 NaH2PO4, 25 NaHCO3, and 11 glucose, final pH 7.4 (equilibrated with 95% O2/5% CO2).
Borosilicate-glass microelectrodes were pulled (P-97, Sutter Instrument) from GC150F-10 capillaries (Harvard Apparatus). Pipettes (6 – 8 M⍀) were filled (Figs. 2,3, and 4) with (in mM): 145 Cs-methanesulfonate, 20 HEPES, 10 CsOH, 8 NaCl, 0.2 CsOH-EGTA, 2 ATP-Mg, 0.3 GTP-Na, 5 QX-314, and 0.2%– 0.5% neurobiotin (295 mOsm, pH 7.2).
InFigs. 5and6, 145 K-gluconate or K-methanesulfonate (with 10 KOH, and 0.2 K-EGTA) were used instead. Recordings with⬎30% change in access resistance were excluded.
Liquid-junction potential was not corrected. Data were recorded with a Multiclamp 700B amplifier, low-pass fil- tered (cutoff frequencyⱖ2 kHz), digitized (ⱖ10 kHz, Digi- data 1400), acquired by Clampex, and analyzed by pClamp10.2 (Molecular Devices, SCR_011323).
Extracellular electrical stimuli were applied via a bipolar electrode (50 –100s, 50 – 400A) instratum oriensand current isolator (CBAPC75PL1, FHC) every 15 s. Synaptic currents werepost hoclowpass filtered at 1 KHz. Phar- macologically isolated AMPA receptor (AMPAR)-mediated EPSC peak amplitude was recorded at – 60 mV, and the NMDAR-mediated EPSC amplitude was measured in the presence of the AMPA/kainate receptor blocker NBQX at a membrane potential 40 mV positive to their measured reversal potential estimated by a linear fitting curve of the
Figure 1.ErbB4 expression in PV⫹and PV–interneurons and the ErbB4 expression levels in hippocampus of WT and the NRG1tg-type-I mice.A, Immunostaining for ErbB4, the NRG1 receptor, in the ventral hippocampus CA3 area neurons using highly specific rabbit anti-ErbB4 (polyclonal anti-antiserum 5941;Neddens and Buonanno, 2010).A1, Double immunolabeling for PV (Cy3) and ErbB4 (Alexa488). Merged image shows double-labeled neurons (arrowhead) and ErbB4⫹interneurons immunonegative for PV (arrows).s.r, stratum radiatum.A2, In mice with genetic fluorescence marker (tdTomato) in CCK cells (tdTom-CCK), ErbB4 immunostaining with Alexa Fluor 488 shows the expression in many CCK⫹neurons ins.r.andstratum pyramidale(s.p.). Cre-dependent tdTomato signal is strong in putative CA3 interneurons (soma ins.r.) and weaker in s.p., where the majority of pyramidal cell somata are located (contrast adjustment in the image). In merged image, arrowheads point at interneuron somata with both fluorescent signals. Scale bars, 50m. Confocal microscope images.B–D, Cell density analysis of hippocampal interneurons immunopositive for ErbB4 in the WT and NRG1 type I– overexpressing mice (NRG1tg-type-I mice). B1, ErbB4 immunoreaction (20-m stack image) in sample hippocampal sections of WT (left) and NRG1tg-type-Imice (right). Scale bar, 100m.B2, Box plots show ErbB4⫹cell soma density
current–voltage relation for at least 20 evoked NMDAR EPSCs measured between –20 and 65 mV (Deleuze and Huguenard, 2016). In cells where no NMDAR EPSC was detected, the current was defined as 0.mEPSC record- ings (2 min for AMPAR and 2 min for NMDAR mEPSCs) were acquired at 20 kHz and bandpass filtered offline (cutoff frequencies 4 Hz to 5 or 6 kHz at – 65 mV, 2–500 Hz at 40 mV) for analysis. Events were detected with an amplitude threshold-crossing algorithm in pClamp (Mo- lecular Devices, SCR_011323). Criteria for threshold de- tection for NMDAR mEPSCs (at 40 mV) were amplitude threshold 7 pA, duration 0.8 –200 ms, with noise rejection 0.8 ms. For the AMPAR mEPSCs (at – 65 mV) the amplitude threshold was 5 pA, duration 0.5–100 ms, with noise rejection 0.5 ms) evaluated after blockade of AMPARs with NBQX (25 M). The same detection criteria were employed for all cells. Number of AMPAR mEPSCs inves- tigated in the analyses were as follows: in wild-type (WT) basket cells (median and interquartile range), 424 and 279 – 680 events (7 cells); in NRG1tg-type-Ibasket cells, 394 and 301– 470 events (6 cells); in WT pyramidal cells, 134 and 128 –205 events (7 cells); in NRG1tg-type-I pyramidal cells, 95 and 64 –150 events (10 cells). The numbers of NMDAR mEPSCs measured in similar time window were as follows: in WT basket cells (median and interquartile range), 513 and 178 –792 events (6 cells); in NRG1tg-type-I basket cells, 348 and 280 –520 events (6 cells). mEPSC frequency was calculated from the 2-min time window as the event occurrence in Hz. Average mEPSC amplitude was calculated in each cell from all events occurring in the 2-min time window.
In experiments using optogenetic stimulation of GABAergic fibers, the monosynaptic IPSCs were measured at 0 to –10 mV. Optogenetic stimulation of the glutamatergic fibers (5 pulses at 20 Hz) was applied every 30 s while the disyn- aptic IPSCs were recorded (on average at 11 mV; see Results) in postsynaptic pyramidal cells. The optogeneti- cally evoked postsynaptic currents were lowpass filtered offline at 1 kHz, and the evoked postsynaptic current charge was analyzed with pClamp10.2 (Molecular Devices, SCR_011323).
Drugs
Drugs were purchased as follows: 2,3-dioxo-6-nitro-1,2,3,4- tetrahydrobenzo[f]quinoxaline-7-sulfonamide disodium salt (NBQX) from Abcam;DL-2-amino-5-phosphonopentanoic acid sodium salt (DL-AP5), picrotoxin (PiTX), CGP55845, 4-[(2S)- 2-[(5-isoquinolinylsulfonyl)
methylamino]-3-oxo-3-(4-phenyl-1-piperazinyl)propyl]
phenyl isoquinolinesulfonic acid ester (KN-62), and (RS)-␣- methyl-4-carboxyphenylglycine (MCPG) from Tocris Biosci- ence. Stocks were diluted (1:1000) in ddH2O, DMSO, or ethanol.
Statistics
Attest was used for data that were normally distributed (Shapiro–Wilk test) and with n ⱖ 10 in tested groups.
Otherwise, a Mann–WhitneyUtest or rank sum test was used.
Anatomic and immunohistochemical processes After whole-cell recordings, slices were fixed overnight at 4°C in 4% paraformaldehyde (NIFCHEM:birnlex 3072_2), 0.05% glutaraldehyde (NIFINV:birnlex 3070_2), and 0.2% picric acid in 0.1 M sodium phosphate buffer (PB), then washed in 0.1MPB. Slices were embedded in 20% gelatin and sectioned (40 – 60m) with a microtome (Leica VT1000) in 0.1M PB, then washed in 50 mM Tris- buffered saline (TBS, pH 7.4) with 0.3% Triton X-100 (TBS-Tx) and incubated with streptavidin-Alexa Fluor 488 (1:2000, Invitrogen, S-32354) or -Cy3 (1:2000, Thermo Fisher, S-A1010), and finally washed in 50 mM TBS-Tx.
Sections mounted in Vectashield (Vector Laboratories) were examined with an epifluorescence microscope (DM5000-B, Leica Microsystems) using appropriate filter sets and a CCD camera (ORCA-ER, Hamamatsu).
Sections for immunoreactions were washed in 50 mM
TBS-Tx, blocked in 20% normal horse serum (NHS, Vec- tor Laboratories) in TBS-Tx for at least 1 h at room tem- perature (20 –24°C), and incubated in primary antibodies for 48 h at 4°C in TBS-Tx with 1% NHS. Fluorochrome- conjugated secondary antibodies were applied overnight at 4°C in TBS-Tx with 1% NHS. Mounted sections in continued
(measured up to 20-m depth from the section surface) in WT (blue,n⫽9 sections in 3 mice) and NRG1tg-type-I(red, 12 sections in 3 mice) mice hippocampi. The plot shows median and interquartile range. Fewer ErbB4⫹somata were detected in the NRG1tg-type-I mice compared to the WT mice in all hippocampal areas. From the left: whole hippocampus including areas CA1, CA2, and CA3; area CA1–2 restricted to alveus,stratum oriens, and stratum pyramidale; area CA1–2 restricted to stratum radiatumand lacunosum- moleculare; area CA3 containing alveuswithstrata oriensand pyramidale; and area CA3 withstrata lucidum and radiatum and lacunosum-moleculare.p-values compare data between genotypes (Mann–WhitneyUtest).C1, Immunoreaction for PV in the same sections as inB1.C2, Cell density analyses show no difference in the observed PV⫹cell somata between the two genotypes as indicated bypvalues (Mann–WhitneyUtest). Box plots as inB2.D1, Merged ErbB4 and PV immunolabeling in the sample sections above.D2, Box plots show proportion of the double-labeled cells (co-immunoreactive for ErbB4 and PV) in the PV⫹cell population in WT and NRG1tg-type-Imice. The analyses show unaltered proportion in the whole hippocampus and in most subregions compared separately. The significantpvalue is bolded.E, Immunoblot analysis of ErbB4 expression levels in WT and NRG1tg-type-Imice using hippocampal extracts.E1, The antibody against ErbB4 detects a band of the predicted protein size (⬃150 kDa) in hippocampal protein extracts. Left lane, no nonspecific bands were detected in the secondary-only antibody control (right lane).E2, Hippocampal extracts from 6 WT and 6 NRG1tg-type-Imice of both genders (3 males and 3 females in each genotype in scrambled order) tested for ErbB4 expression. GAPDH was used as a loading control.E3, Box plot shows (mean and interquartile range) densitometry analysis comparison of the ErbB4 levels normalized by the GAPDH in the 12 hippocampal extracts (6 in both genotypes including 3 males and 3 females). The results indicate a general trend to lower ErbB4 levels in NRG1tg-type-Imice, but with no significant difference between the genotypes (Mann–WhitneyUtest).
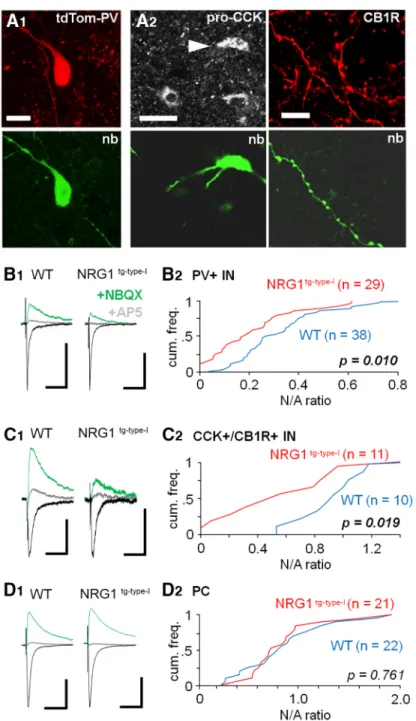
Figure 2.Reduced synaptic NMDAR-mediated currents in hippocampal interneurons expressing PV or CCK in the NRG1tg-type-Imice.
A, Interneurons expressing PV or CCK in the CA3 area. A1, Sample image of a recorded PV interneuron identified by PV expression-dependent fluorescent genetic marker tdTomato (tdTom-PV). Recorded cells were also visualized with filled neurobiotin (nb, Alexa Fluor 488).A2, Recorded cells not showing tdTomato signal were identified as CCK⫹interneuronspost hocwith positive somatic immunoreaction for pro-CCK (left; Cy5, arrowhead) or in the absence of recovered soma and dendrites (right) by positive reaction for axonal cannabinoid receptor type 1 (CB1R, Cy3). Scale bars from left: 10, 20, and 10m, respectively.B, Reduced NMDAR- versus AMPAR-mediated EPSCs ratio (N/A ratio) in glutamatergic synaptic input to interneurons expressing PV. Electrical stimulation was applied in CA3stratum oriensaiming to activate associative/commissural pathways. AMPAR-mediated EPSCs were recorded at – 60 mV (in PiTX, 100M) and blocked by NBQX (25M) to record NMDAR-mediated EPSCs (at 40 mV from their reversal potential).B1, Averaged EPSCs (10 traces) in sample PV⫹interneurons in WT and NRG1tg-type-Imouse (black, AMPAR EPSCs;green, NMDAR EPSCs in the presence of NBQX; gray, following application of NMDAR blocker DL-AP5). Scale bars, 100 pA, 25 ms.
B2, Cumulative histograms of the N/A amplitude ratios in all studied PV⫹ interneurons (WT, blue line; NRG1tg-type-I, red line).p indicates difference between the genotypes (Mann–WhitneyUtest).C, Reduced N/A ratio in glutamatergic synaptic input to the CCK⫹ interneurons. C1, Averaged EPSCs (10) in sample cells in the WT and in the NRG1tg-type-I mouse with scaling as above.
C2, Cumulative histogram quantifying the N/A ratios in CCK⫹ interneurons with p indicating significant difference between the genotypes (Mann–WhitneyUtest).D, The N/A ratio is unaltered between the genotypes in the CA3 pyramidal cells.D1, Averaged EPSCs (10 traces) in sample pyramidal cells with scaling as above.D2, Cumulative histograms of the N/A ratios.
Vectashield were evaluated atⱖ40⫻magnification using confocal laser-scanning microscopy (LSM710, Carl Zeiss) with Zen2008 software. Digital micrographs were con- structed fromz-stacks with ImageJ software (SCR:003070).
Micrographs were only adjusted for brightness and con- trast. The primary antibodies used were rabbit anti-ErbB4 (polyclonal anti-antiserum 5941, 1:500; Vullhorst et al., 2009), guinea pig anti-PV (Synaptic Systems, 195004, RRID:AB_2156476, 1:2000), rabbit anti-proCCK (RRID:
AB_2571674, 1:500;Morino et al., 1994), guinea pig anti- CB1R (Frontier Science, CB1-GP-af530-1, RRID:
AB_2571593, 1:1000). The secondary antibodies were CY5 donkey anti– guinea pig (1:250, Jackson ImmunoRe- search, 706-175-148), CY3 donkey anti– guinea pig (1:
400, Jackson ImmunoResearch, 706-165-148), Alexa Fluor 647 donkey anti– guinea pig (1:250, Invitrogen, 706- 605-148), Alexa Fluor 488 donkey anti-rabbit (1:500, In- vitrogen, A21206), Dylight 649 donkey anti-rabbit (1:250, Jackson ImmunoResearch, 711-495-152).
Cell density analyses
Mice were anesthetized with 2%– 4% isoflurane (CHEBI:
6015) at a rate of 1.0–1.5 ml/min and then further anesthe- tized with an intraperitoneal injection of pentobarbitone sodium (20% w/v, dosage 0.2 mg/g; Pharmasol). Animals were perfused with 0.1 M PBS solution (pH 7.4, at 22–24°C) followed by ice-cold fixative solution; 4% w/v paraformal- dehyde (NIFCHEM:birnlex 3072_2) with 15% v/v satu- rated picric acid solution in 0.1 M PB. A vibratome (VT1000S Leica Microsystems) was used for cutting cor- onal brain sections (60-m thickness). Sections contain- ing the hippocampal formation were washed (3–5 times, 10 min) with TBS-Tx and blocked with 20% NHS in TBS-Tx for 1 h at room temperature (20 –24°C). This was followed by a 2-night incubation with the primary antibod- ies: rabbit anti-ErbB4 (polyclonal anti-antiserum 5941, 1:500) and guinea pig anti-PV (Synaptic Systems, 195004, RRID:AB2156476, 1:2000) in TBS-Tx with 1% NHS at 4°C.
After washes (3–5 times, 10 min each) with TBS-Tx, sec- Figure 3.Reduced synaptic NMDAR-mediated currents in identified PV basket cells in the NRG1tg-type-Imice. Identified PV basket cells (PVBCs) in the recorded interneuron population (seeFig. 2) show reduced N/A ratio in the NRG1tg-type-Imice.A, Illustration of a sample PVBC (70-m-thick section) in WT (axon, blue; soma and dendrites, red; s.r.,stratum radiatum; s.luc.,lucidum; s.p., pyramidale; s.o.,oriens). Scale, 100m.B, The N/A EPSC amplitude ratio in identified basket cells.B1, Averaged (10) EPSCs in a PVBC from WT and NRG1tg-type-Imouse. Black, AMPAR EPSCs at – 60 mV;green, EPSCs (at 40 mV from their reversal potential in the presence of NBQX, 25 M); gray, EPSCs following the application of DL-AP5 (100 M). PiTX (100 M) was present in all experiments. Scale bars, 50 pA, 25 ms.B2, Plot shows N/A ratio of every identified PVBC in WT (blue circles) and NRG1tg-type-Imice (red circles), and their mean⫾SEM (n⫽10 and 10 cells).pvalue indicates highly significant difference (ttest).
tions were incubated overnight with Alexa Fluor 488 – conjugated and Alexa Fluor 647– conjugated secondary antibodies both raised in donkey, respectively, in TBS-Tx with 1% NHS. Sections containing mid-ventral hippocam- pus from both hemispheres were scanned using an epiflu- orescence microscope (AxioImager M2; Zeiss) equipped with Stereoinvestigator software (MBF Bioscience). Opti- cal sections of 1m were acquired using a 20⫻objective at a final depth of 20m from the section surface, while the first 1m from the section surface was defined as a guard zone and not scanned (Bocchio et al., 2015).
Brightness and contrast acquiring settings were adjusted for each section, to achieve good visualization of all pos- itive cells for a specific neuromarker across all section areas. Cell counting was performed offline. Distinct hip- pocampal regions were visually delineated and analyzed as individual anatomically defined subregions as follows:
CA1–2 alveus (alv)/stratum oriens (s.o)/stratum pyrami- dale (s.p), CA1–2 stratum radiatum (s.r)/stratum lacunosum-moleculare (s.l-m), CA3 alv/s.o/s.p, and CA3 stratum lucidum (s.l)/s.r/s.l-m. Cells were counted when the cell somata or nuclei came into focus with the optical dissector.
Immunoblotting
Tissue sample homogenates were prepared from mouse hippocampus in ice-cold lysis buffer containing 20 mMTris (pH 7.5), 50 mMNaCl, 1 mMEDTA, 0.1% SDS, 1%
Triton X-100, 2% protease inhibitors (Roche), 1% phos- phatase inhibitors Cocktail 2 and 3 (Sigma), using a plas- tic homogenizer, repeated passages through a syringe, followed by 5-min sonication and 75-min rotation at 4°C.
Next, the homogenates were centrifuged at 4000⫻g, and the supernatant was collected. Lysates were quantified for their total protein content with standard Bradford as- say (Bio-Rad), diluted to sample buffer containing 100 mM
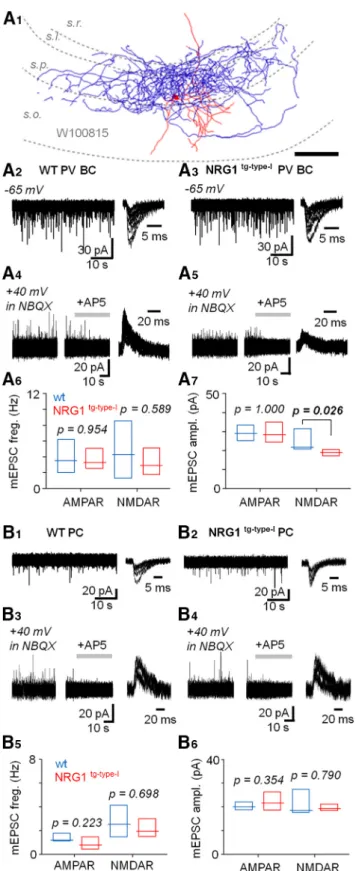
(or 2⫻increased) DTT, 10% glycerol, 2% SDS, 2 mMTris Figure 4.Quantal current analysis in parvalbumin basket cells
shows unaltered AMPAR mEPSCs in the NRG1tg-type-I mice.
A, Recording of miniature AMPAR- and NMDAR-mediated EP- SCs (mEPSCs) in identified CA3 area PVBCs (in the presence of TTX 1Mand PiTX 100M).A1, Illustration of a recorded and partially reconstructed PVBC (70-m-thick section) in WT mouse. Scale, 100m.A2, AMPAR mEPSCs in a PVBC in the WT mouse (at – 65 mV). Left, the mEPSCs shown in 45-s time
Figure 4. continued
window. Right, six events superimposed in 15-ms time window.
A3, AMPAR mEPSCs in a PVBC in the NRG1tg-type-Imouse.A4, NMDAR mEPSCs in the same WT mouse PVBC as inA2after blockade of AMPARs by NBQX (25M, recorded at 40 mV). Left, the mEPSCs shown in 45-s time window. Middle, the mEPSCs blockade with DL-AP5 (100M, application indicated by hori- zontal bar). Right, six superimposed mEPSCs in 80-ms time window.A5, NMDAR mEPSCs blocked by DL-AP5 in NRG1tg-
type-Imouse PVBC shown inA3.A6, Box plot (median, interquar- tile range) summarizes AMPAR and NMDAR mEPSC frequency (measured at least 3 min) in PVBC in WT (blue) and NRG1tg-type-I (red) mice.A7, Box plot summarizes mEPSC amplitude. Note moderately but significantly smaller NMDAR mEPSC in the NRG1tg-type-Imice PVBCs (Mann–WhitneyUtest). The significant pvalue is bolded.B, Unaltered NMDAR- and AMPAR-mediated mEPSCs in the CA3 area pyramidal cells in NRG1tg-type-Imice.
B1,B2, Sample traces showing AMPAR mEPSCs in pyramidal cells of both genotypes.B3,B4, Respectively, NMDAR EPSCs in the same cells.B5, Box plot (median, interquartile range) sum- marizing the AMPAR- and NMDAR-mediated mEPSC frequency (WT, blue, NRG1tg-type-I, red).B6, Summary of he AMPAR and NMDAR mEPSC amplitudes in the two genotypes (Mann–Whit- neyUtest).
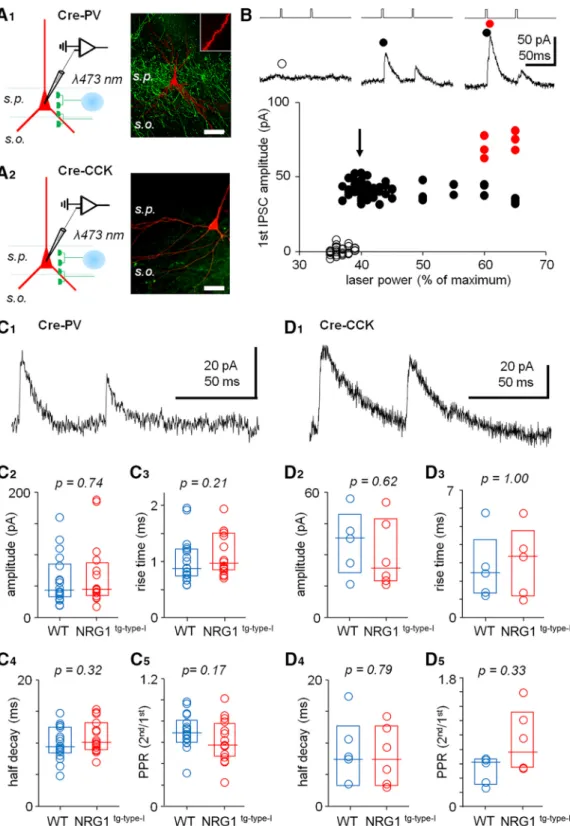
Figure 5. GABAergic synaptic transmission from either PV⫹ or CCK⫹ cells is not significantly altered in NRG1tg-type-I mice.
A, Experimental design showing optogenetic stimulation (at 473-nm laser spot, 20-m diameter) of GABAergic fibers in the CA3 stratum pyramidalein slices from ChR2-eYFP–transfected mice expressing Cre-protein in either PV⫹cells (A1) or CCK⫹cells (A2).
Left, schematic illustration of the experiment with whole-cell recording in CA3 PCs and optogenetic stimulation focused onstratum pyramidale (s.p.). Right, confocal microscope images from sample slices (visualizedpost hoc) showing eYFP fluorescence (green) in the PV- (above) or CCK-Cre mice. Postsynaptic neurobiotin-filled pyramidal cells are shown red with an inset of a spiny pyramidal cell apical dendrite. Scale, 50m.B, Sample experiment showing optogenetically evoked GABAergic IPSCs in a postsynaptic pyramidal cell using minimal stimulation. Monosynaptic IPSCs (black circles) were evoked by smallest stimulation power eliciting IPSCs in the PC. Open circles, failures; red circles, additional IPSCs elicited by increased stimulation power. Timing of laser pulses with representative IPSCs in the experiment is shown above.C, The optogenetically evoked GABAergic IPSCs from PV cell fibers do not differ significantly between WT mice (blue) and NRG1tg-type-Imice (red; Mann–WhitneyUtest).C1, A sample trace. Box plots (median,
HCl, and 0.1% (w/v) bromophenol blue crystals, and in- cubated at 95°C for 5 min to denature proteins. Protein lysates were size separated by SDS-PAGE, using 6% or 10% acrylamide gels, and electrophoretically transferred onto nitrocellulose membranes. After blocking in the Od- yssey proprietary blocking buffer (LI-COR Biosciences) for 1 h at room temperature (20 –24°C), membranes were incubated with the primary antibodies overnight at 4°C (rabbit anti-ErbB4, polyclonal anti-antiserum 5941, 1:900).
Rabbit anti-GADPH (1:10,000) in Odyssey blocking buffer was supplemented with 0.01% Tween 20. After washes with PBS⫻Tx (5 times, 5 min), membranes were incubated with the appropriate fluorescent secondary antibody (goat anti-rabbit IRDYe 800CW, LI-COR Biosciences) for 1 h at 20 –24°C. Finally, after five 5-min washes with PBS⫻Tx, the membranes were scanned with an infrared scanner (Od- yssey Clx scanner, LI-COR Biosciences, SCR:014579) and the digital scans were analyzed with Image Studio Lite software (LI-COR Biosciences, SCR:014211).
Results
Expression of ErbB4 in the hippocampus of WT and NRG1 type I– overexpressing mice
Given the well-established role of ErbB4 as the major receptor to elicit NRG1 signaling cascades in the brain (Flames et al., 2004; López-Bendito et al., 2006; Kri- vosheya et al., 2008;Fazzari et al., 2010;Li et al., 2012b), we visualized the ErbB4 receptor in hippocampal interneu- rons using rabbit anti-ErbB4 (polyclonal anti-antiserum 5941) immunostaining, which shows high epitope specificity (Vullhorst et al., 2009). We found that ErbB4 coexpressed with PV and CCK, the mutually exclusive neuronal mark- ers (Fig. 1A1,A2) that label perisoma-targeting (and also some dendrite-targeting) hippocampal interneuron types.
Given that NRG1-ErbB4 signaling is known to regulate interneuron migration, survival, and proliferation during neurodevelopment (Flames et al., 2004;Li et al., 2012b), we first investigated whether the NRG1 type I– overex- pressing mice showed an altered distribution of ErbB4⫹ interneurons in the hippocampus. Fluorescence imaging- based ErbB4⫹ cell soma counting showed a reduced density in the NRG1tg-type-I mice compared to the WT mice in all subfields (Fig.1B1,B2). In the whole hippocam- pus (including the CA1–CA3 areas) of the WT mice, the ErbB4⫹soma density was 4.98⫻103cells/mm3(median, interquartile range 4.65–5.66⫻103cells/mm3), and in the NRG1tg-type-Imice, 2.82⫻103cells/mm3(median, inter- quartile range 2.37–3.48 ⫻ 103 cells/mm3; p ⫽ 0.002, Mann–Whitney U test; Fig. 1B2). Hippocampal subre- gions, compared separately, were defined as follows: (1) stratum pyramidale with infrapyramidal laminae in the CA1–2 area, (2) suprapyramidal layers in the CA1–2 area, (3)stratum pyramidalewith infrapyramidal laminae in the CA3 area, (4) suprapyramidal layers in the CA3 area. The
subregion-specific soma counting results are illustrated in Fig.1B2. The cell counts in the CA1 and CA2 areas were pooled together because of small size of the CA2, and the result mainly represents the CA1 area.
In contrast, analysis of PV-immunopositive cell somata showed no difference between the two genotypes, in line with a previous study using the same NRG1tg-type-Imouse line (Deakin et al., 2012). Fluorescence imaging-based PV⫹cell soma counting (Fig. 1C1) in the WT mice revealed 2.44⫻103 cells/mm3 (median, interquartile range 2.03–
2.74⫻103cells/mm3,n⫽9 sections in 3 mice; Fig.1C2).
Correspondingly, the PV⫹ cell soma density analysis in the NRG1tg-type-Imice showed 2.28⫻103cells/mm3(me- dian, interquartile range 2.03–2.63⫻103cells/mm3,n⫽ 12 sections in 3 mice;p ⫽0.696, Mann–WhitneyU test;
Fig. 1C1,C2). The detected PV⫹cell densities were also unaltered in the analyzed hippocampal subregions (Fig.
1C2). When we quantified percentages of the ErbB4- and PV-coexpressing neurons in the two genotypes, we found that in both genotypes most hippocampal PV⫹cells co- expressed the ErbB4 receptor (Fig. 1D1). Comparing the coexpression results in the entire hippocampus did not show a difference between the genotypes (Fig.1D2). In WT mice, the coexpression covered 77.66% (median, interquartile range 75.85%– 86.85%,n⫽9 slices from 3 mice) of the PV⫹ neurons; in the NRG1tg-type-I mice, it comprised 75.64% (median, interquartile range 72.41%–
80.01%,n⫽12 slices from 3 mice) of the PV⫹cells (p⫽ 0.166, Mann–WhitneyUtest), in agreement with previous studies (Yau et al., 2003;Fazzari et al., 2010;Bean et al., 2014; see alsoNeddens and Buonanno, 2010). However, when comparing the expression in the hippocampal subar- eas (Fig. 1D2), a significant but small decrease was ob- served in the coexpression level, specifically in the CA1–2 area (includingalveus,stratum oriens, andstratum pyra- midale) in the NRG1tg-type-Imice (p⫽0.043, Mann–Whit- neyUtest;Fig. 1D2).
These results show that NRG1 type I overexpression does not produce significant changes in the coexpression of ErbB4 and PV in most hippocampal areas or in the spatial distribution of PV⫹neurons in the hippocampus.
Yet, these data suggest that NRG1 overexpression leads to altered ErbB4⫹cell soma count of interneurons other than those expressing PV. This could either emerge from changes in the migration, survival, and proliferation of these cells during neurodevelopment (Flames et al., 2004;
Li et al., 2012a) or be caused by alterations in the expres- sion and trafficking of the receptor (Longart et al., 2007;
see Discussion).
We found no significant difference in ErbB4 protein levels between the two genotypes using Western blot analysis of whole-hippocampus extracts (n⫽6 including 3 males and 3 females in both genotypes, p ⫽ 0.310, Mann–Whitney U test; Fig. 1E1–E3). This discrepancy continued
interquartile range) show data from all the PCs studied.C2, The evoked IPSC amplitudes.C3, The IPSC half decay.C4, The IPSC rise time.C5, The IPSC paired-pulse (50 ms) ratio (2nd/1st IPSC amplitude).pvalues with Mann-Whitney test.D, The IPSCs from CCK-fibers do not show significant difference between the genotypes.D1, Sample trace.D2–D5, The IPSC amplitude, IPSC half decay, rise time, and paired-pulse ratio, respectively (Mann–Whitney test).
may be attributed partly to the fact that the cell density analysis focused on cells in specific hippocampal subre- gions, whereas the lysates in the immunoblots comprised the entire hippocampus, possibly masking subregion- specific differences (see Discussion).
In conclusion, the above results suggest that expres- sion level or pattern of the ErbB4 in some hippocampal CA1 and CA3 cells is altered in response to NRG1 type I genomic overexpression (see Discussion). In addition, the analyses confirm earlier findings that ErbB4 is present in the hippocampal interneurons expressing PV or CCK (Vullhorst et al., 2009), and that both PV⫹ and the PV– interneuron subpopulations expressing the receptor ErbB4 are present in the NRG1tg-type-Imouse hippocam- pus (seeFig. 1B2).
Hippocampal interneurons expressing PV or CCK have reduced synaptic NMDAR-mediated currents in the mice overexpressing NRG1 type I
Next, we studied synaptic AMPAR- and NMDAR- mediated glutamatergic EPSCs in three neuron subpopu- lations in the CA3 area of acute hippocampal slices; PV⫹ interneurons (Fig. 2A1), CCK⫹ interneurons (Fig. 2A2), which both commonly express the ErbB4 (seeFig. 1), and pyramidal cells in which the receptor is absent (Vullhorst et al., 2009). All cells were studied in the whole-cell voltage clamp mode in hippocampal slices from mice expressing fluorescent marker (tdTomato) in PV-interneurons (see Ma- terials and methods). The CCK⫹ GABAergic interneurons were identifiedpost hoc by positive immunoreaction for cytoplasmic pro-CCK (tested when cell soma was recov- ered,n ⫽3 in WT control andn⫽4 in NRG1tg-type-I) or axonal CB1R (tested when only interneuron axon was recovered,n⫽7 andn⫽7 respectively;Fig. 2A2;Katona et al., 1999). We applied electrical microelectrode stimu- lation in the CA3 stratum oriensaiming to activate pre- dominantly associative-commissural fibers. Blockers for GABAA and GABAB receptors (picrotoxin, 100 M, and CGP55845, 1 M) were present in all experiments. We found that the NMDAR-mediated EPSCs in PV⫹interneu- rons of the NRG1tg-type-Imice were smaller, in comparison to the AMPAR EPSCs, than in their WT littermate controls (measuring a ratio of the NMDAR-EPSC and the AMPAR- EPSC amplitude, N/A ratio;Fig. 2B1). The evoked average glutamatergic EPSCs in the NRG1tg-type-I mice were (median, interquartile range): NMDA EPSC, 19.8 pA, 10.4 – 45.5 pA; AMPAR EPSC, 110.7 pA, 79.1–136.0 pA.
Correspondingly, the N/A ratio in the NRG1tg-type-I mice was 0.18, 0.08 – 0.29 (n⫽29). In the WT control mice, the NMDA EPSC amplitude was 47.6 pA (median, interquar- tile range 29.1– 60.8 pA), and the AMPAR EPSC amplitude 127.8 pA, 79.6 –214.7 pA. Hence the N/A ratio in WT was 0.28, 0.19 – 0.42 (n⫽38). The N/A ratios in PV⫹cells of the two genotypes were different (p⫽0.010, Mann–Whitney Utest).Fig. 2B2shows cumulative histograms of the N/A ratios measured in the PV⫹interneurons of the two geno- types.
Likewise, we found that the CCK⫹CA3 area interneu- rons in the NRG1tg-type-Imice showed smaller N/A ampli- tude ratio (median 0.57, interquartile range 0.46 – 0.98,
n⫽12) than their littermate controls (median 1.12, inter- quartile range 0.82–1.25, n ⫽ 10; p ⫽ 0.019, Mann–
Whitney U test; Fig. 2C1). The EPSC amplitudes in the CCK⫹ interneurons in the NRG1tg-type-I mice were (me- dian, interquartile range): NMDAR EPSC, 31.8 pA, 26.4 – 43.8 pA; AMPAR EPSC, 54.9 pA, 30.8 – 65.9 pA (n⫽12).
In the WT CCK⫹ cells, the NMDAR EPSC was 52.6 pA (median, interquartile range 37.1–73.6 pA) and the AMPAR EPSC was 42.5 pA (median, interquartile range 33.2–58.4 pA; n ⫽ 10). Sample EPSCs in the CCK⫹ interneurons are illustrated in Fig.2C1, and the cumula- tive histograms of the N/A ratios are shown inFig. 2C2. In line with previous observations, CCK⫹interneurons had larger NMDAR-mediated synaptic currents (compared as the N/A ratio in the WT mice) than PV⫹cells (p⫽0.001, Mann–WhitneyU test;Maccaferri and Dingledine, 2002;
Matta et al., 2013).
In contrast to the interneurons, there was no difference in the N/A ratio across pyramidal cells (PCs) between genotypes (Fig. 2D1,D2; p ⫽ 0.761, Mann–Whitney U test). EPSCs in the NRG1tg-type-Imice PCs were (median, interquartile range): NMDAR EPSC, 47.5 pA, 34.0 –76.2 pA, and AMPAR EPSC, 63.8 pA, 41.9 –105.1 pA. Conse- quently, the N/A ratio in the NRG1tg-type-Imice was 0.80, 0.49 –1.11 (n⫽21). Correspondingly, in the WT mice, the NMDA EPSC amplitude was 73.3 pA (median, interquar- tile range 45.0 –96.5 pA), and AMPAR EPSC amplitude, 100.1 pA (median, interquartile range 49.1–120.2 pA). The N/A ratio in the WT PCs was 0.79, 0.63– 0.98 (n⫽22).
Because both interneuron populations comprise vari- ous specialized cell types (Klausberger and Somogyi, 2008; Pelkey et al., 2017), and glutamatergic synapse features may vary between individual interneuron types (Papp et al., 2013), we visualized and anatomically exam- ined the recorded interneurons (filled with neurobiotin) to identify basket cells (PVBCs;Fig. 3A) in the PV⫹subpop- ulation (seeFig. 2B). We confirmed 22 PVBCs (12 in the WT mice and 10 in the NRG1tg-type-Imice). Interestingly, the PVBC group in both genotypes showed parametric distribution of the N/A values (in the NRG1tg-type-I mice W ⫽ 0.91,p ⫽ 0.270; in the WT mice,W ⫽0.96, p ⫽ 0.780; Shapiro–Wilk test) showing that the N/A values have less variation in an identified PV⫹cell type subpop- ulation than in the entire PV⫹ cell population in general.
The PVBC data showed smaller N/A EPSC ratio in the NRG1tg-type-Imice (0.14 ⫾0.04,n⫽ 10) than in the WT control mice (0.31⫾ 0.04,n ⫽12; p ⫽0.006, mean⫾ SEM,ttest;Fig. 3B1,B2). In addition to the basket cells, we identified two axo-axonic cells (Nissen et al., 2010) in the NRG1tg-type-Imice (their average N/A ratios 0.09 and 0.21) and one in the WT control littermates (N/A ratio⫽ 0.18). Because of their low number, these cells were not separately compared between the genotypes (but the cells were included in the PV⫹cell pool inFig. 2).
Quantal current analysis in parvalbumin basket cells shows unaltered AMPAR-mediated transmission in NRG1tg-type-IMice
Because the decreased N/A ratio alone is unable to distinguish between suppressed NMDAR currents and
increased AMPAR EPSCs, and because altered NRG1 levels can affect AMPAR-mediated transmission (Abe et al., 2011), we next studied glutamatergic miniature currents (mEPSCs) in a new set of identified PVBCs re- corded in the CA3 area (Fig. 4A1). The cells were voltage clamped at – 65 mV for the AMPAR EPSCs and 40 mV for the NMDAR EPSCs in presence of tetrodotoxin (TTX, 1
M) and the GABA receptor blockers (picrotoxin, 100M, and CGP55845, 1M). In WT mice PVBCs, the AMPAR- mediated mEPSCs (Fig. 4A2) occurred at 3.53 Hz (me- dian, interquartile range 2.32–5.67 Hz, n ⫽ 7) and had amplitudes of 28.9 pA (median, interquartile range 25.3–
32.6 pA, n ⫽ 7). Correspondingly, in the NRG1tg-type-I mice, the AMPAR mEPSC (Fig. 4A3) frequency was 3.28 Hz (median, interquartile range 2.51–3.92 Hz,n⫽6) and the amplitude 28.3 pA (median, interquartile range 24.8 – 34.7 pA,n ⫽ 6). Neither the AMPAR mEPSC frequency (p⫽0.954) nor the amplitude (p⫽1.00) differed between genotypes in the PVBCs (Mann–WhitneyUtest).
In addition, we measured the NMDAR-mediated mEP- SCs in the same identified PVBCs following wash-in of NBQX (25M). One recording was lost before the NBQX application and therefore the n number is smaller than above. We found that the frequency of detected NMDAR mEPSCs was not different between WT PVBCs (Fig. 4A4;
4.27 Hz, 1.48 – 6.60 Hz, n ⫽ 6) and the NRG1tg-type-I PVBCs (Fig. 4A5; 2.90 Hz, 2.34 – 4.33 Hz,n⫽6; median and interquartile range,p⫽0.589, Mann–WhitneyUtest;
Fig. 4A6). Yet, the amplitude of the NMDAR mEPSCs in NRG1tg-type-Imice (19.0 pA, 17.6 –20.1 pA; median, inter- quartile range) was moderately but significantly lower than in WT littermates (21.8 pA, 20.8 –30.0 pA; p ⫽ 0.026, Mann–WhitneyU test). These results are summarized in Fig. 4A6,A7.
We also recorded mEPSCs in the CA3 area PCs and found that neither AMPAR- nor NMDAR-mediated mEP- SCs differed between the genotypes. In the WT PCs, the AMPAR mEPSC (Fig. 4B1) values were 1.15 Hz (median, interquartile range 1.10 –1.70 Hz, n ⫽ 7) and 20.8 pA (median, interquartile range 18.8 –21.9 pA,n⫽7). Corre- spondingly, in the NRG1tg-type-Imice (Fig. 4B2), the values were 0.79 Hz (median, interquartile range 0.54 –1.25 Hz,n
⫽10,p ⫽0.223 vs. the WT PCs) and 21.6 pA (median, interquartile range 19.0 –25.0 pA,n ⫽10,p ⫽0.354 vs.
the WT PCs; Mann–Whitney U test). Respectively, the NMDAR mEPSCs in the WT PCs (Fig. 4B3) occurred at 2.54 Hz (median, interquartile range 1.60 –3.71 Hz,n⫽5) with amplitude of 18.5 pA (median, interquartile range 17.8 –24.1 pA, n ⫽ 5). The NMDAR mEPSCs in the NRG1tg-type-IPCs (Fig. 4B4) occurred at 1.94 Hz (median, interquartile range 1.71–2.87 Hz,n⫽9,p⫽0.689 vs. the WT PCs) showing an amplitude of 19.3 pA (median, inter- quartile range 18.5–20.6 pA,n⫽9,p⫽0.790 vs. the WT PCs). The results are summarized inFig. 4B5,B6.
The findings of unchanged AMPAR mEPSCs in the PVBCs and PCs (and the moderate reduction of the NMDAR mEPSC amplitude specifically in the PVBCs in the NRG1tg-type-Imice) indicate that the altered N/A ratio observed (Fig. 3) was caused by reduced postsynaptic NMDAR currents in the NRG1tg-type-Imice PVBCs.
GABAergic inhibitory currents from parvalbumin- or cholecystokinin-expressing CA3 interneurons are not altered in NRG1tg-type-I mice
Given that alterations in NRG1 levels can acutely change inhibitory synapses and modify them long term (Okada and Corfas, 2004;Woo et al., 2007;Chen et al., 2010; Yin et al., 2013; Agarwal et al., 2014), we studied whether GABAergic synaptic output from interneurons expressing either PV or CCK is also altered in the NRG1tg-
type-Imice. To selectively stimulate axons from these in- terneurons, we prepared slices from NRG1tg-type-Iand WT mice expressing Cre-protein either in PV⫹cells or CCK⫹ interneurons and transduced with a Cre-dependent adeno- associated virus (AAV)-channelrhodopsin-2 (ChR2)-eYFP construct (see Materials and methods). Expression of the construct in the two types of GABAergic fibers is illustrated inFig. 5A1,A2. GABAergic IPSCs were elicited in the CA3 area pyramidal cells stimulating the interneuron axons locally with brief laser light pulses (3 ms, 473 nm) focused instratum pyramidale. Stimulation intensity was set to use minimal laser power required for stable IPSCs (Fig. 5B). In all experiments, the postsynaptic pyramidal cells (voltage clamped at 0 to 10 mV) were recorded in the presence of glutamate receptor blockers NBQX (25M) and DL-AP5 (100M). The optically evoked IPSCs were blocked with picrotoxin (100M) in all experiments tested (n⫽8 of 8 in IPSCs from PV⫹fibers, andn⫽3 of 3 from CCK⫹fibers).
We found that the IPSCs did not differ significantly between the genotypes for either PV⫹or CCK⫹GABAe- rgic synapses (Mann–WhitneyUtest). For PV⫹fibers, the evoked IPSC amplitudes (Fig. 5C1) were 43.6 pA, 34.3–
82.0 pA (median, interquartile range;n⫽18 cells) in WT mice, and 44.8 pA, 36.2– 82.7 pA in NRG1tg-type-I mice (n⫽16 cell,p⫽0.74 vs. WT;Fig. 5C2). The IPSC rise time (from 20% to 80% of the peak) values in the WT were 0.88 ms, 0.76 –1.20 ms (n⫽18 cells), and in the NRG1tg-type-I mice 0.97 ms, 0.87–1.49 ms (n⫽16,p ⫽0.208 vs. WT;
Fig. 5C3). The IPSCs from the WT mice PV⫹ fibers showed a decay half-time of 9.4 ms, 8.6 –12.4 ms (n⫽ 18), and the decay half times in the NRG1tg-type-IPV⫹cells were 10.1 ms, 9.0 –12.8 ms (n⫽16,p⫽0.32 vs. WT;Fig.
5C4). The paired-pulse ratio (PPR, 50-ms interval, 2nd IPSC/1st IPSC amplitude) in the WT mice was 0.69, 0.60 – 0.79 (n ⫽ 18), and in the NRG1tg-type-I 0.58, 0.80 – 0.76 (n⫽16,p⫽0.173 vs. WT;Fig. 5C5).
The IPSC amplitudes evoked from the CCK⫹fibers (Fig.
5D1) were 38.0 pA, 23.9 – 45.4 pA in WT mice (n⫽5), and 23.4 pA, 18.0 – 44.7 pA in NRG1tg-type-Imice (n⫽6,p⫽ 0.662 vs. WT;Fig. 5D2). The IPSC rise time (from 20% to 80% of the peak) in the WT mice was 2.40 ms, 1.40 –3.60 ms (n ⫽ 5 cells), and 3.30 ms, 1.29 – 4.30 ms in the NRG1tg-type-Imice (n⫽5,p⫽0.94 vs. WT;Fig. 5D3). The decay half time in the WT was 7.7 ms, 6.3–12.2 ms (n⫽5), and in the NRG1tg-type-Imice it was 7.4 ms, 3.4 –12.3 ms (n⫽6,p⫽0.79 vs. WT;Fig. 5D4). The IPSCs evoked from the CCK⫹fibers showed PPR of 0.61, 0.32– 0.66 in WT (n⫽5), and 0.75, 0.54 –1.22 in the NRG1tg-type-Imice (n⫽ 6,p ⫽0.33 vs. WT;Fig. 5D5).
Reduced NMDAR-driven recurrent inhibition in the hippocampus in NRG1tg-type-Imice
Finally, we investigated whether the reduced synaptic NMDAR-mediated transmission in these two common recurrent inhibition interneuron subpopulations had con- sequences for the GABAergic inhibition evoked by repet- itive firing of the hippocampal glutamatergic neurons. To study this, we optogenetically stimulated glutamatergic fibers, focusing the laser light pulses instratum pyrami- daleandstratum oriens, aiming to activate the recurrent disynaptic GABAergic pathway. We did the experiments in the CA1 area to avoid polysynaptic glutamatergic discharge generated in the CA3 recurrent glutamatergic circuits (Maccaferri and McBain, 1995). We used hip- pocampal slices of the NRG1tg-type-I ⫹/⫺ mice and their littermate WT controls both crossed with CaMKII-Cre⫾ and transduced with the AAV-ChR2-eYFP construct in the hippocampus (Fig. 6A). We made a translaminar surgical cut in the slices fromalveustostratum lacunosum-moleculare in the CA1-CA2 area border to exclude the CA3 area recurrent excitatory loop and polysynaptic discharges (Maccaferri and McBain, 1995).
We applied bursts of five pulses of stimuli at 20 Hz every 60 s to generate disynaptic IPSCs in the CA1 area pyramidal cells. The IPSCs were recorded at a reversal potential of the EPSCs (11.1 ⫾ 0.7 mV, mean ⫾ SEM) elicited in the same cells (n⫽13 comprising 7 cells in the NRG1tg-type-I mice and 6 cells in the WT controls; Fig.
6B1,B2). Long-term plasticity blockers KN-62 (3M) and MCPG (200M) were present in all experiments for long- term stability of the disynaptic IPSCs (Perez et al., 2001;
Kullmann and Lamsa, 2011;Campanac et al., 2013). After a stable baseline (at least 5 min), NMDAR blocker DL-AP5 (100 M) was washed in (Fig. 6C1,C2). This suppressed the evoked recurrent GABAergic IPSC in the WT mice to 0.66 of baseline (charge median, interquartile range 0.61–
0.71, p ⫽ 0.031 vs. baseline, n ⫽ 6 cells), and in the NRG1tg-type-I mice to 0.74 (charge median, interquartile range 0.66 – 0.83, p ⫽ 0.026 vs. baseline, n ⫽ 7 cells) compared to the baseline (Mann–Whitney rank sum test).
The IPSC charge was compared in each experiment be- tween the last 3 min in baseline, and in an equal time window in the presence of DL-AP5 (at 5– 8 min after DL-AP5 application). The suppression of the disynaptic Figure 6.Reduced NMDAR-driven recurrent hippocampal inhibition in NRG1tg-type-Imice.A, Schematic summarizes the experimental design. Optogenetic stimulation of CA1 area pyramidal cell fibers expressing ChR2 (green, CAMKII-Cre mice transfected with AAV2-ChR2-eYFP). Recurrent inhibitory IPSCs are generated by laser spot (473-nm, 3-ms) stimulation focused instratum pyramidale (s.p.) andoriens (s.o.).B, Sample experiments showing averaged (5) recurrent IPSCs in the CA1 pyramidal cells, evoked by the optogenetic stimulation (5 pulses at 20 Hz) in WT (B1) and NRG1tg-type-I(B2) mice. Black traces show IPSCs in baseline; green is in the presence of NMDAR blocker DL-AP5 (100M, at 5– 8 min after DL-AP5 application). The IPSCs were recorded at the reversal potential of EPSCs. The IPSCs were fully blocked with NBQX (25M, gray traces).C, Plots show the recurrent IPSC charge in sample experiments in the WT (C1) and NRG1tg-type-I(C2) mouse. Wash-in of DL-AP5 and NBQX is indicated by green and gray horizontal bars, respectively.D, The hippocampal recurrent IPSCs in the NRG1tg-type-Imice show reduced sensitivity to the NMDAR antagonist.
Box plot (median, interquartile range) summarizes the effect of DL-AP5 (100M) on the recurrent IPSC charge in WT (blue) and NRG1tg-type-I(red) mice. The IPSC charge in the presence of DL-AP5 (and in the presence of NBQX) is normalized with the baseline for each experiment.pvalue with Mann–WhitneyUtest.