Report
Reduced Prefrontal Synaptic Connectivity and Disturbed Oscillatory Population Dynamics in the CNTNAP2 Model of Autism
Graphical Abstract
Highlights
d
Synaptic inputs onto mPFC L2/3 pyramidal neurons are reduced in Cntnap2 KO mice
d
The frequency and amplitude of mEPSCs are reduced in the mPFC of Cntnap2 KO neurons
d
Decreased density of dendritic excitatory and inhibitory synapses in Cntnap2 KO mice
d
Phase-modulated spiking to slow LFP oscillations is altered in Cntnap2 KO units
Authors
Maria T. Lazaro, Jiannis Taxidis, Tristan Shuman, ..., Xiangmin Xu, Daniel H. Geschwind, Peyman Golshani
Correspondence
dhg@mednet.ucla.edu (D.H.G.), pgolshani@mednet.ucla.edu (P.G.)
In Brief
Lazaro et al. demonstrate a decrease in synaptic inputs onto mPFC L2/3
pyramidal neurons of Cntnap2 KO mice, concurrent with reduced spines and synapses. These lead to perturbed network activity, with mPFC cells exhibiting reduced phase locking and altered preferred phases to slow LFP oscillations, which may underlie autism- related phenotypes.
Strength of excitatory inputs
LFP delta oscillation (1-4 Hz)
Wild Type CNTNAP2 Knock-Out
Reduced dendritic spines
Decreased synaptic input
mPFC pyramidal cells
Decreased and time-shifted
phase locking
Spiking during locomotion Spiking during locomotion
Lazaro et al., 2019, Cell Reports27, 2567–2578 May 28, 2019
https://doi.org/10.1016/j.celrep.2019.05.006
Cell Reports
Report
Reduced Prefrontal Synaptic Connectivity and Disturbed Oscillatory Population
Dynamics in the CNTNAP2 Model of Autism
Maria T. Lazaro,1,2,3,13Jiannis Taxidis,3,4,13Tristan Shuman,3,4,5Iris Bachmutsky,3Taruna Ikrar,6Rommel Santos,6 G. Mark Marcello,7Apoorva Mylavarapu,3Swasty Chandra,3Allison Foreman,3Rachna Goli,3Duy Tran,3Nikhil Sharma,3 Michelle Azhdam,3Hongmei Dong,3Katrina Y. Choe,2Olga Pen˜agarikano,8,9Sotiris C. Masmanidis,4Bence Ra´cz,7 Xiangmin Xu,6Daniel H. Geschwind,2,3,10,11,*and Peyman Golshani3,4,11,12,14,*
1Interdepartmental Program for Neuroscience, UCLA, Los Angeles, CA, USA
2Center for Neurobehavioral Genetics, Semel Institute, UCLA, Los Angeles, CA, USA
3Department of Neurology, David Geffen School of Medicine, UCLA, Los Angeles, CA, USA
4Integrative Center for Learning and Memory, Brain Research Institute, UCLA, Los Angeles, CA, USA
5Department of Neuroscience, Icahn School of Medicine at Mount Sinai, New York, NY, USA
6Department of Anatomy and Neurobiology, UC Irvine, Irvine, CA, USA
7Department of Anatomy and Histology, University of Veterinary Medicine, Budapest, Hungary
8Department of Pharmacology, School of Medicine, University of the Basque Country (UPV/EHU), Vizcaya, Spain
9Centro de Investigacio´n Biome´dica en Red en Salud Mental (CIBERSAM), Madrid, Spain
10Center for Autism Research and Treatment, Semel Institute, UCLA, Los Angeles, CA, USA
11Intellectual Development and Disabilities Research Center, UCLA, Los Angeles, CA, USA
12West Los Angeles VA Medical Center, Los Angeles, CA
13These authors contributed equally
14Lead Contact
*Correspondence:dhg@mednet.ucla.edu(D.H.G.),pgolshani@mednet.ucla.edu(P.G.) https://doi.org/10.1016/j.celrep.2019.05.006
SUMMARY
Loss-of-function mutations in CNTNAP2 cause a syn- dromic form of autism spectrum disorder in humans and produce social deficits, repetitive behaviors, and seizures in mice. However, the functional effects of these mutations at cellular and circuit levels re- main elusive. Using laser-scanning photostimulation, whole-cell recordings, and electron microscopy, we found a dramatic decrease in excitatory and inhibitory synaptic inputs onto L2/3 pyramidal neurons of the medial prefrontal cortex (mPFC) of Cntnap2 knockout (KO) mice, concurrent with reduced spines and syn- apses, despite normal dendritic complexity and intrinsic excitability. Moreover, recording of mPFC local field potentials (LFPs) and unit spiking
in vivore- vealed increased activity in inhibitory neurons, reduced phase-locking to delta and theta oscillations, and delayed phase preference during locomotion.
Excitatory neurons showed similar phase modulation changes at delta frequencies. Finally, pairwise corre- lations increased during immobility in KO mice. Thus, reduced synaptic inputs can yield perturbed temporal coordination of neuronal firing in cortical ensembles.
INTRODUCTION
Autism spectrum disorder (ASD) is characterized by deficits in social communication and repetitive or restrictive behaviors
(American Psychiatric Association, 2013). Genetic studies have revealed that the etiology of ASD is very heterogeneous, involving hundreds of genes (O’Roak et al., 2012; Sanders et al., 2012; Chen et al., 2015; Krishnan et al., 2016), a significant proportion of which appear as rare recessive orde novodomi- nant mutations (Geschwind, 2011; Iossifov et al., 2014; Gilman et al., 2011; Leppa et al., 2016). One highly penetrant syndromic form of ASD is caused by loss-of-function mutations in the CNTNAP2 gene (Strauss et al., 2006), and CNTNAP2 polymor- phisms have been associated with increased risk of ASD and other conditions (Poot et al., 2010; Scott-Van Zeeland et al., 2010; Arking et al., 2008).
CNTNAP2 encodes for contactin-associated protein-like 2 (Caspr2), a protein of the neurexin superfamily that has diverse cellular and circuit functions (Strauss et al., 2006; Poliak et al., 1999, 2001, 2003; Gdalyahu et al., 2015; Varea et al., 2015;
Alarcόn et al., 2008; Pen˜agarikano et al., 2011; Jurgensen and Castillo, 2015). Mice lacking the Cntnap2 gene recapitulate core behavioral deficits of ASD, including socialization and communication impairments, repetitive behaviors, and seizures (Pen˜agarikano et al., 2011). Recentin vivoevidence suggests that CNTNAP2 has a putative role in synapse formation and sta- bilization and that dendritic spine dynamics are affected in the Cntnap2 knockout (KO) mice, with reduced stability in newly formed spines (Gdalyahu et al., 2015). In addition, loss of CNTNAP2 leads to synaptic alterationsin vitro, with decreased inhibition and axonal excitability deficits in acute hippocampal slices (Anderson et al., 2012; Jurgensen and Castillo, 2015; Scott et al., 2019). These results suggest that CNTNAP2 mutations may be linked to abnormal behavior by altering synaptic neuro- transmission, functional connectivity, and neuronal network
activity. However, the specific cellular and circuit mechanisms that lead to altered behavior in Cntnap2 KO mice remain unclear.
Here, we examined the neurophysiological consequences of Cntnap2 deletion in the mouse medial prefrontal cortex (mPFC), a brain region that is critically involved in social behavior (Yizhar et al., 2011; Grossmann, 2013) and notably affected in ASD (Voineagu et al., 2011; Redcay et al., 2013; Selimbeyoglu et al., 2017). mPFC cells can modulate social behavior, are
critical for cortico-cortical communication, and have been considered a critical hub for autism-related gene expression (Yizhar et al., 2011; de la Torre-Ubieta et al., 2016; Selimbeyoglu et al., 2017; Parikshak et al., 2013). Using glutamate uncaging via laser-scanning photostimulation (LSPS) on layer 2/3 (L2/3) pyramidal neurons of the mPFC in combination with in vitro whole-cell patch-clamp recordings, we observed a reduction in both excitatory and inhibitory synaptic inputs onto excitatory neurons and decreased excitatory neurotransmission. Anatom- ical studies showed a concomitant decrease in dendritic spine and synapse densities. Using multichannel silicon microprobes to recordin vivolocal field potentials (LFPs) and activity from sin- gle neurons in the mPFC, we observed robust alterations in the phase locking of units to delta and theta oscillations during loco- motion. These findings demonstrate that the loss of Cntnap2 re- sults in decreased excitatory drive onto pyramidal cells, which further leads to alterations in circuit-level synchronous activity in the mPFC. Therefore, mutations in CNTNAP2 could be mech- anistically linked to alterations in microcircuit connectivity and lead to abnormal population activity, providing a potential sub- strate for behavioral abnormalities in ASD.
RESULTS
Decreased Excitatory and Inhibitory Inputs in the mPFC of Cntnap2 KO Mice
To test how the loss of CNTNAP2 alters mPFC microcircuits, we used LSPS via glutamate uncaging to map and quantify local excitatory and inhibitory cortical inputs onto L2/3 mPFC pyrami- dal neurons. By voltage clamping patched pyramidal neurons at 70 and +5 mV, we recorded excitatory and inhibitory synaptic inputs, respectively, while uncaging glutamate and activating small clusters of surrounding neurons (Figures 1A, 1B, andS1).
We observed that, similar to wild-type (WT), L2/3 pyramidal neu- rons in KO mice received most of their excitatory and inhibitory synaptic inputs from L2/3 and L5 in the mPFC (Figures 1C and 1D). However, L2/3 excitatory neurons in KO mice displayed a dramatic reduction in both excitatory and inhibitory local synap- tic inputs compared to WT (Figures 1C–1E), while the balance of excitation to inhibition (E/I) in individual neurons was not signifi- cantly altered (Figure 1F). This reduction was not due to lower neuronal responsiveness to glutamate uncaging in KO mice, since both mouse groups showed equivalent responses to un- caging onto perisomatic regions (Figure S1).
Our input mapping findings could also be associated with al- terations in the intrinsic excitability of cortical neurons. Caspr2 has a known role in the clustering of potassium channels in the juxtaparanodes of axons, which are important for the propaga- tion of action potentials (Poliak et al., 1999, 2001, 2003).
To examine whether the loss of Cntnap2 resulted in altered excitability and intrinsic properties in mPFC, we performed whole-cell current-clamp recordings on mPFC L2/3 pyramidal and parvalbumin-positive (PV+) inhibitory neurons (recorded in Cntnap2-PV-Cre 3 Ai9 animals) in KO and WT controls. We focused on PV+interneurons, as these cells provide powerful perisomatic inhibition to cortical pyramidal neurons, and their dysfunction has been implicated in autism-associated def- icits resulting from the loss of Cntnap2 (Scott et al., 2019;
LSPS glutamate uncaging Inhib.
Excit.
L2/3 Pyr
A B
40
L1L2/3 L5 L6 0
WT KO
L1L2/3 L5 L6
EPSC Amplitude (pA)
L1 L2/3 L5 L6
60
0
WT KO
L1L2/3 L5 L6L1L2/3 L5 L6
IPSC Amplitude (pA)
Excitatory inputs Inhibitory inputs
C D
E F
L1 L2/3 L5 L6
Inhibitory
Excitatory Ratio
WT KO WT KO
0 1 2 3 4
Total synaptic input (log) WT KO0.0
0.5 1.0 1.5
E/I
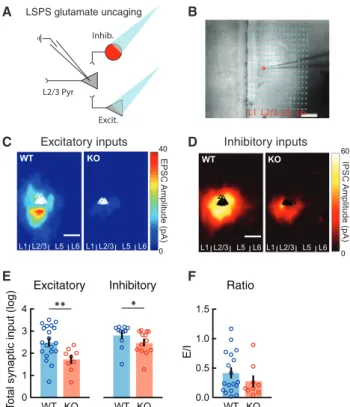
Figure 1. Reduced Excitatory and Inhibitory Synaptic Inputs to L2/3 Pyramidal Neurons in the mPFC of Cntnap2 KO Mice
(A) Schematic of laser-scanning photostimulation (LSPS) via glutamate un- caging paradigm, combined with whole-cell patch-clamp recordings of L2/3 pyramidal (Pyr) neurons in acute slices of the medial prefrontal cortex (mPFC).
Patched neurons were clamped at 70 or +5 mV for the detection of local excitatory or inhibitory synaptic connections arising from photostimulated presynaptic glutamatergic (Excit.) and GABAergic (Inhib.) neurons.
(B) Example of an LSPS experiment in an mPFC slice, in which differential interference contrast imaging was used for tissue visualization. Photo- stimulation sites are superimposed (dots) and spaced within a 100-mm360- mm grid. The red circle indicates the location of the recorded glutamatergic neuron in L2/3, approached by the patch pipette.
(C and D) Group-averaged excitatory (C) and inhibitory (D) input maps of L2/3 excitatory neurons for WT (n = 20 cells from 3 mice in C; n = 11 cells from 3 mice in D) and KO (n = 9 cells from 3 mice in C; n = 13 cells from 3 mice in D) mice.
Triangles indicate the location of individually recorded neurons.
(E) Average total synaptic excitatory and inhibitory input strength (log) measured for L2/3 excitatory cells depicting a robust decrease in the KO mice, compared to WT mice (WT: EPSC 2.51±0.17, n = 20 cells; KO:
EPSC 1.72±0.17, n = 9 cells; WT: IPSC 2.83±0.16, n = 11 cells; KO: IPSC 2.49±0.15, n = 13 cells; EPSC: **p = 0.0051, IPSC: *p = 0.0218; Wilcoxon test).
(F) Average ratios of total EPSCs over IPSCs from individual cells (WT: n = 17 cells; KO: n = 8 cells). There is no significant difference in E/I ratio between WT and KO (p = 0.8873; unpaired t test). Scale bars: 200mm.
All errors bars indicate the SEM.
Pen˜agarikano et al., 2011). Input-output curves, showing the average number of action potentials elicited by increasing cur- rent injections in pyramidal and PV+neurons, revealed no signif- icant alterations in the action potential firing rate between the two groups (Figure S2). Action potential threshold, amplitude, half- width, afterhyperpolarization (AHP) potential, or time from peak to AHP were also not significantly different between WT and KO. The same was observed for resting membrane potential, input resistance, cell membrane capacitance, and membrane time constant (Table S1).
These results indicate that the loss of Cntnap2 does not affect the intrinsic excitability of L2/3 neurons of the mPFC, but leads to a robust reduction of local excitatory and inhibitory inputs onto these cells.
Decreased Excitatory Neurotransmission in Pyramidal Neurons of Cntnap2 KO Mice
To investigate the specific cellular processes that lead to reduced synaptic responses in KO mice, we performed whole- cell patch-clamp recordings of miniature excitatory and inhibi- tory postsynaptic currents (mEPSCs and mIPSCs, respectively) in mPFC L2/3 neurons. We measured mEPSC and mIPSC ampli- tude, frequency, and kinetics, as changes in amplitude are a reli- able measure of the number of receptors at synapses (quantal size), while frequency correlates with the number of contacts or probability of release (Greer et al., 2010). In agreement with our LSPS findings, we observed a 2-fold decrease in the fre- quency of mEPSCs (Figures 2A and 2B) and a significant decrease in the average amplitude of mEPSCs in Cntnap2 KO pyramidal neurons (Figure 2C). We observed no statistically sig- nificant alterations in the frequency, amplitude, or kinetics of mIPSCs (Figures 2D–2F), despite the marked reduction in inhibi- tion found with LSPS cortical input mapping (Figures 1D and 1E).
This could reflect compensatory changes between synapse number and release probability or altered distribution of proximal and distal inhibitory inputs. In addition, we examined miniature postsynaptic currents in PV+interneurons and found no signifi- cant differences in mEPSCs or mIPSCs (Figures S3A–S3F).
We then asked whether the observed decrease in mEPSC fre- quency on pyramidal neurons could be caused by a disruption in the probability of synaptic vesicle release (Toni et al., 1999; Sorra et al., 1998; Calverley and Jones, 1990). We tested this by stim- ulating long-range axonal projections to mPFC in slices and measuring evoked excitatory currents elicited in L2/3 pyramidal cells (Figure 2G). We observed reduced evoked EPSC ampli- tudes (Figure 2H) and significantly increased EPSC latencies (Figures S3G andS3H) in KO mice compared to controls, corrob- orating our previous findings of reduced excitatory neurotrans- mission. However, we found no significant differences in paired-pulse ratios of evoked currents between WT and KO mice (Figures 2I and 2J), indicating similar excitatory neurotrans- mitter release probabilities.
Finally, we tested whether KO mice had altered, immature, or silent synapses, characterized by the decreased ratio of a-amino-3-hydroxyl-5-methyl-4-isoxazole-propionate to N- methyl-D-aspartate (AMPA/NMDA) receptors (Toni et al., 1999;
Calverley and Jones, 1990; Dani et al., 2005; Gibson et al., 2008). We recorded evoked AMPA and NMDA currents in the
presence of the GABAAreceptor blocker, picrotoxin, by holding the cells at 70 and +40 mV, respectively, in voltage clamp. We found no significant difference in the AMPA:NMDA ratios when comparing WT and KO mice (Figures 2K and 2L), indicating that KO mice do not have more immature or silent synapses.
These results indicate a reduction in the frequency and ampli- tude of excitatory drive onto single pyramidal cells, which cannot be explained by alterations in single synapse maturity or neuro- transmitter vesicle release.
Decreased Dendritic Spine Density in Cntnap2 KO Mice We next asked whether the decrease in excitatory neurotrans- mission was caused by a reduction in the total number of synap- tic inputs, either through decreased dendritic branching or decreased spine density. We performed 3D anatomical recon- structions of L2/3 pyramidal neurons by filling cells with biocytin duringin vitroslice recording experiments and imaged them with confocal microscopy. Sholl analysis did not reveal significant changes in total dendritic length, total number of dendritic branches, or dendritic complexity (Figures 3A and 3B), suggest- ing that L2/3 pyramidal neurons in Cntnap2 KO mice have normal dendritic arborization. In addition, the density of neuronal cell bodies in L2/3 and the density of immunolabeled PV+neu- rons in the prelimbic cortex was similar in Cntnap2 KO mice and controls (Figures S4A andS4B).
To determine whether Cntnap2 KO neurons display a decrease in dendritic spine density, we crossed homozygous Cntnap2 KO (or WT) mice with Thy1-GFP mice, which express GFP in a subset of cortical pyramidal neurons, including sparsely labeled L2/3 mPFC pyramidal cells. The quantification of den- dritic spines in these cells revealed that L2/3 pyramidal neurons in KO mice show a significant decrease in both basal and apical dendritic spine density (Figures 3C and 3D), which may underlie the reduction in functional synaptic inputs that we observed in our electrophysiology experiments.
To further validate this hypothesis, we used electron micro- scopy to examine L2/3 mPFC dendritic spines and synaptic contacts in WT (n = 3) and Cntnap2 KO mice (n = 3) (Figure 3E).
Consistent with our previous findings, we observed a signifi- cant (25%) reduction in the number of both asymmetric (excitatory) and symmetric (inhibitory) synapses in KO mice (Figure 3F). Furthermore, we found no significant changes in spine area or synapse length in the KO mice (Figure 3G). How- ever, Cntnap2 KO mice had a markedly reduced density of multisynapse boutons (MSBs) (Figure 3H), a marker of synap- togenesis (Toni et al., 1999). We also found an increase in perforated synapses in these mice (Figure 3I), which are asso- ciated with increased synaptic turnover (Calverley and Jones, 1990; Sorra et al., 1998), supporting previous reports of increased dendritic spine turnover in Cntnap2 KO mice (Gda- lyahu et al., 2015).
To determine how the loss of CNTNAP2 alters synaptic inputs to the distal apical tufts of excitatory neurons, we also counted asymmetric (putative excitatory) and symmetric (putative inhibi- tory) synapses in L1. Cntnap2 KO mice exhibited significantly decreased asymmetric and symmetric synapse numbers in L1 compared to controls, suggesting impairments in distal dendritic excitation and inhibition in these animals (Figures S4C andS4D).
I WT KO
50 ms 25 ms
100 ms 500 ms
50 ms
100 pA
J
25 50 100 200 500 0.8
1.0 1.2 1.4 1.6 1.8
Stimulus interval (us)
PPR (2nd/1st)
WT KO
-70 mV
L K
+40 mV -70 mV
WT
KO
+40 mV 50 pA20 ms
WT KO
0.0 0.5 1.0 1.5
NMDA/AMPA Ratio
WT KO
G H
M Cg PL IL A
S Stim.
Rec.
2 4 6 8 10
0 100 200 300 400
Stimulus duration (ms)
eEPSC (pA)
WT
KO
mEPSCs
WT
10 pA 100 ms 6 pA KO
5 ms
mIPSCs
WT
KO 30 pA200 ms 10 pA
10 ms WT KO
0 1 2 3
0.0 0.2 0.4 0.6 0.8 1.0
Interevent interval (s)
Cumulative fraction
WTKO
0 100 200 300
0.0 0.2 0.4 0.6 0.8 1.0
Amplitude (pA)
Cumulative fraction
WTKO
1 2 3 4
0.0 0.2 0.4 0.6 0.8 1.0
Interevent interval (s)
Cumulative fraction
WTKO
20 40 60 80 100 0.0
0.2 0.4 0.6 0.8 1.0
Amplitude (pA)
Cumulative fraction
WTKO
A
B
C
D
E
F
WT KO
0 2 4 6 8
Frequency (Hz)
WT KO
0 5 10 15 20 25
Amplitude (pA)
WT KO
0 5 10 15 20 25
Frequency (Hz)
WT KO
0 20 40 60 80
Amplitude (pA)
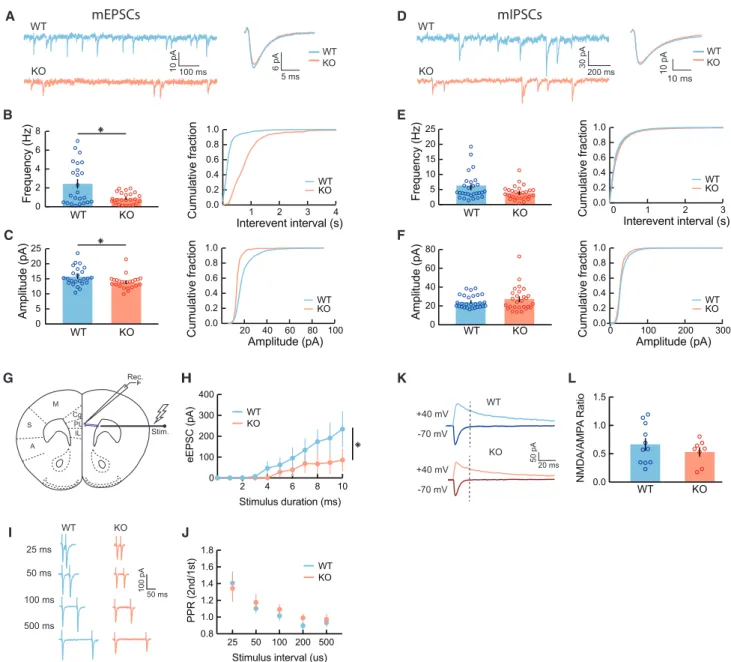
Figure 2. Reduced mEPSC Frequency and Long-Range Excitatory Inputs in Cntnap2 KO Pyramidal Neurons
(A) Representative traces from recorded mEPSCs in Cntnap2 WT and KO pyramidal cells, voltage clamped at 70 mV, with corresponding average unitary events.
(B) Frequency of mEPSCs (WT: 2.42±0.45 Hz, n = 24 cells, 6 mice; KO: 0.89±0.12 Hz, n = 24 cells, 5 mice; Wilcoxon test, *p = 0.0410) is decreased in KO mice.
(C) Amplitude of mEPSCs (WT: 15.73±0.63 pA, n = 24, 6 mice; KO: 13.88±0.45 pA, n = 24 cells, 5 mice; Wilcoxon test, *p = 0.0172) is decreased in KO mice.
(D–F) Same as (A)–(C), but for mIPSCs. There is no significant decrease in frequency (WT: 5.76±0.83 Hz, n = 28 cells, 8 mice; KO: 3.87±0.45 Hz, n = 27 cells, 4 mice; p = 0.1327; Wilcoxon test) or amplitude of mIPSCs (WT: 24.43±1.30 pA, n = 28 cells, 8 mice; KO: 27.21±2.48 pA, n = 27 cells, 4 mice; p = 0.8740, Wilcoxon test) in KO mice compared to WT mice.
(G) A monopolar tungsten electrode was used to stimulate long-range axons (purple), which extend from the anterior forceps of the corpus callosum and project onto a patched excitatory neuron in L2/3 mPFC.
(H) Input-output curves of excitatory responses resulting from a range of increasing stimulus intensities in Cntnap2 WT and KO mice (WT: n = 7 cells, n = 6 mice;
KO: n = 9 cells, n = 5 mice;*p<0.0001, 2-way ANOVA).
(I) Representative current responses from paired pulses given at various interstimulus intervals (ISIs) in WT and KO mice.
(J) Ratio of second to first evoked synaptic response to paired-pulse stimulation at increasing ISIs suggests no significant deficits in the probability of synaptic vesicle release in Cntnap2 KO mice (WT: n = 10 cells, n = 6 mice; KO: n = 8 cells, n = 5 mice; p = 0.8926, 2-way ANOVA).
(K) Evoked AMPA (cells voltage clamped at 70 mV) and NMDA (cells voltage clamped at +40 mV) currents in WT and KO mice. Stimulus artifact was blanked for clarity. Dashed line indicates point where NMDA current amplitudes were measured, immediately after AMPA current decay.
(L) AMPA to NMDA ratios of Cntnap2 KO mice were not significantly altered, compared to WT mice, suggesting no significant changes in synaptic maturity (WT:
0.67±0.10, n = 11 cells, 6 mice; KO: 0.53±0.08, n = 8 cells, 5 mice; p = 0.3471, unpaired t test).
All errors bars indicate the SEM.
A B
C D
E F
G H I
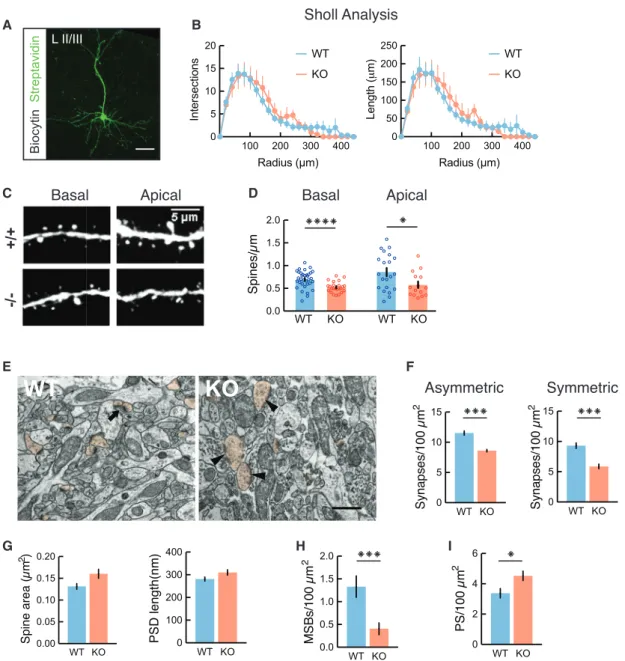
Figure 3. Decreased Dendritic Excitatory and Inhibitory Synapses in Cntnap2 KO Mice
(A) Representative z stack projection of biocytin-filled L2/3 neuron, visualized with a streptavidin-Alexa 488 antibody. Scale bar indicates 100-mm length.
(B) Sholl analysis showing number of intersections (p = 0.0632, 2-way ANOVA) and length (p = 0.9315, 2-way ANOVA) of dendrites is comparable between Cntnap2 WT (n = 8 cells) and KO (n = 9 cells).
(C) Confocal image of L2/3 Thy1-GFP+pyramidal neurons in mPFC, demonstrating representative apical and basal dendrites for WT (+/+) and Cntnap2 KO ( / ) mice.
(D) Summary graphs showing the quantification of average spine density in apical (WT: 0.86±0.09 spines/mm, n = 21 dendrites; KO: 0.57±0.07 spines/mm, n = 15 dendrites) and basal branches (WT: 0.70±0.03 spines/mm, n = 34 dendrites; KO: 0.52±0.02, n = 24 dendrites). *p < 0.05, unpaired t test; ****p < 0.0001, Welch’s t test.
(E) Representative electron micrographs showing neuropils of L2/3 mPFC in WT and Cntnap2 KO mice. Arrow indicates a multisynapse bouton (MSB).
Arrowheads indicate perforated asymmetrical synapses. Spine profiles are pseudo-colored in orange. Scale bar: 500 nm.
(F) Graphs showing the quantification of asymmetric (putative excitatory; WT: 11.53±0.35 synapses/100mm2, n = 80 fields; KO: 8.59±0.21 synapses/100mm2, n = 90 fields; 3 mice per genotype; ***p < 0.0001, Wilcoxon test) and symmetric synapses (putative inhibitory; WT: 9.30±0.46 synapses/100mm2, n = 80 fields;
KO: 5.87±0.38 synapses/100mm2, n = 90 fields; ***p < 0.0001, Wilcoxon test).
(G) Spine and postsynaptic density (PSD) area (WT: 0.1313±0.006mm2, n = 257 spines; KO: 0.1604±0.010mm2, n = 187 spines; p = 0.1142, Wilcoxon test) and length (WT: 281.10±8.89 nm, n = 257 spines; KO: 309.90±11.83 nm, n = 187 spines; p = 0.0709 Wilcoxon test).
(H) Density of MSBs for WT (1.33±0.23 MSBs/100mm2, n = 80 fields) and KO (0.41±0.13 MSBs/100mm2, n = 90 fields) mice; ***p = 0.0002, Wilcoxon test.
(I) Perforated synapses (PSs) for WT (3.38±0.31 PS/100mm2, n = 90 fields) and KO (4.52±0.31 PS/100mm2, n = 80 fields) mice;*p=0.0122, Wilcoxon test.
All errors bars indicate the SEM.
These findings indicate that the loss of Cntnap2 leads to signif- icant defects in both inhibitory and excitatory synaptic density, as well as alterations in markers of synapse plasticity and stability.
AlteredIn VivoNetwork Activity in mPFC of Cntnap2 KO Mice
How does the observed decrease in cortical inputs onto L2/3 py- ramidal neurons of Cntnap2 KO mice affect network activity in vivo? Such a robust decrease in functional synapses could affect the precise temporal coordination of neuronal firing during cortical network oscillations, which is critically dependent on the balance between excitation and inhibition (Sorra et al., 1998; Go- lomb and Hansel, 2000; Dani et al., 2005; Gibson et al., 2008).
To test this hypothesis, we recordedin vivoLFPs and single unit activity in the mPFC of KO and WT mice using multichannel silicon microprobes (Shobe et al., 2015) (Figures 4A and 4B).
Head-fixed mice were free to rest or run on a spherical treadmill during the recordings (Polack et al., 2013), and locomo- tion was monitored. Both mouse groups exhibited similar locomotion characteristics, with a small but non-significant ten- dency for KO mice to have sparser but longer locomotion bouts (Figures S5A–S5F), in support of previous observations of hyper- activity in these animals (Pen˜agarikano et al., 2011). Activity during concatenated locomotion and immobility segments was analyzed separately (Figure 4A).
We recorded 249 single units from 8 WT mice and 145 units from 5 KO mice, which were clustered into wide-spiking (WS), putative excitatory units and narrow-spiking (NS), putative inter- neurons (Figures 4B and 4C). Firing rates of WS neurons had similar distributions between the WT and KO groups (Figures 4D,S5G, and S5H), but NS units from KO mice fired at a signif- icantly higher rate (and consequently with lower inter-spike inter- vals), compared to the WT group, during both locomotion and immobility states (Figures 4E,S5G, and S5H). No differences be- tween the two groups were observed in spiking variability or burst index in either unit type during either state (Figures S5G andS5H), suggesting unaltered intrinsic spiking characteristics in units of KO animals.
Since a decrease in synapse number could affect the coordi- nated synaptic activity that is thought to shape the LFP signal, particularly at low frequencies (Buzsa´ki et al., 2012), we first tested whether the power of low-frequency oscillations was altered in KO mice. We found no significant differences in the average power of the LFP between KO and WT mice in delta (1–4 Hz) or theta (5–11 Hz) oscillations, or even higher fre- quencies (beta 12–30 Hz, slow gamma 30–55 Hz, or high gamma 80–110 Hz), during either locomotion or immobility (Figure 4F), suggesting no major alterations in mPFC oscillatory activity on a broad neuronal population level.
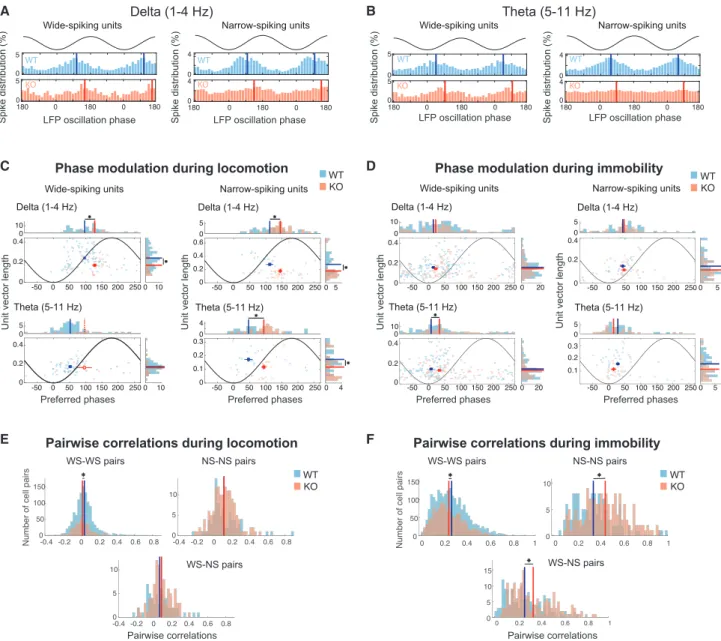
Different neuronal populations are typically recruited to fire selectively at specific phases of ongoing oscillations, creating a dynamic circuit pattern (Klausberger and Somogyi, 2008). To assess how the observed synaptic alterations in KO mice reflect on the spiking modulation of individual units during LFP oscilla- tions, we examined the preferred firing phase of each unit and its phase-locking strength to that phase, focusing again on delta and theta LFP oscillations during locomotion (Figures 5A and 5B)
and immobility separately. We found a significant decrease in the strength of phase locking of WS units to delta oscillations and NS units to delta and theta oscillations in KO animals during locomo- tion, combined with significant shifts in both unit types to later phases in the respective oscillatory cycles (Figure 5C). Extending this analysis over the faster LFP oscillation rhythms mentioned above yielded fewer units that were significantly locked to such frequencies, particularly in KO animals (Figure S6). Notably, we found a decrease in phase locking to beta oscillations in NS units of KO mice, but over a small sample of phase-locked units.
The observed reduction in phase locking in KO animals extended during immobility (Figure 5D), with significant reduc- tions observed mainly for NS units in theta and gamma fre- quency ranges (Figure S6). During theta oscillations, we found a significant shift to later phases in WS units (Figure 5D). Finally, the number of significantly phase-locked units per animal to each frequency was on average comparable in both WT and KO groups (Table S2).
Decreased phase locking of individual units to LFP oscillations suggests a reduction in coordinated population activity during both motion and immobility in Cntnap2 KO animals. To test this, we compared correlations between the firing rates of all pairs of units in WT versus KO mice, during either locomotion or immo- bility, separately for WS-WS, NS-NS, and WS-NS pairs in each mouse (Figures 5E and 5F). Only units with adequate spiking (>200 spikes in each condition) were considered. Correlations be- tween WS units exhibited a small but significant reduction in KO mice during locomotion and immobility. NS units exhibited no sig- nificant difference in locomotion, but they were significantly more correlated in KO animals during immobility, leading to increased WS-NS correlations as well. This finding was not affected by the firing rate binning since it was reproduced with firing rate time bins spanning from 500 (2 Hz, delta frequency; Figures 5E and 5F) down to 25 ms (40 Hz, slow gamma;Figure S7). Again, comparable numbers of units from each mouse group were included in each case (Table S2). Therefore, despite their reduc- tion in phase locking to particular LFP oscillations, NS unit pairs re- mained more strongly correlated in immobile KO animals, despite a prominent desynchronization of WS units in each condition.
These results indicate a disrupted mPFC network in Cntnap2 KO mice, in which both excitatory and inhibitory neurons have less precise firing patterns that are also shifted relative to network activity and yield less coherent network dynamics.
These alterations may lead to severely altered mPFC processing in Cntnap2 KO mice, potentially contributing to altered brain function and the previously described behavioral deficits observed in these mice.
DISCUSSION
Here, we find that the loss of Cntnap2, which causes a syn- dromic form of autism in humans, leads to reduced synaptic in- puts onto L2/3 pyramidal neurons in the mPFC. LSPS mapping revealed a dramatic reduction of both excitatory and inhibitory inputs in this region, and mEPSCs occurred at a lower frequency in neurons. These findings suggest a decrease in the total num- ber of excitatory synapses, which was confirmed with confocal microscopy as a decrease in spine density and the decrease in
both excitatory and inhibitory synapses seen with electron microscopy. In vivo, these changes were associated with decreased phase-locking strength and shifted phase preference of putative excitatory neurons to delta oscillations and of inhibi- tory neurons to delta and theta oscillations during locomotion.
We conclude that the loss of CNTNAP2 has a profound impact
on synaptic connectivity and population dynamics of excitatory and inhibitory neurons in the mPFC.
The observed reduction in functional synaptic connectivity and in the density of synapses in the mPFC of Cntnap2 KO animals is consistent with recent studies showing reduced local and long- range functional connectivity in the prefrontal cortex of these
A B
C D E
F
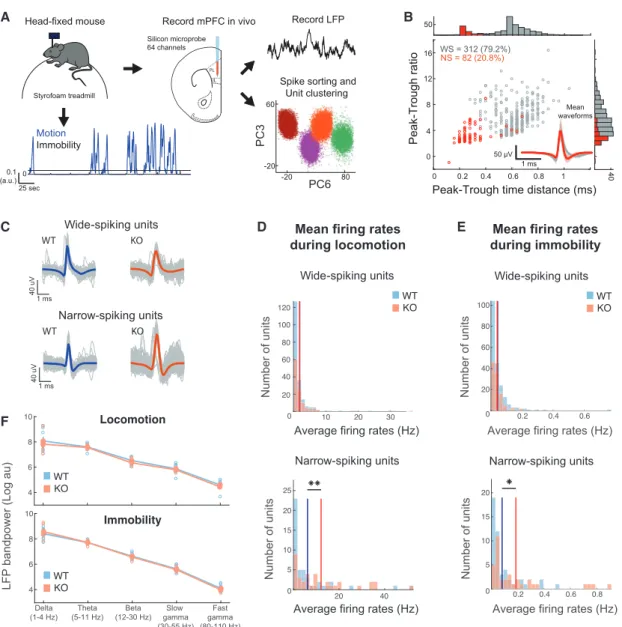
Figure 4. Increased Activity inIn Vivo-Recorded Narrow-Spiking Units of Cntnap2 KO Mice, but Normal LFP Oscillations
(A) Schematic ofin vivorecordings and subsequent analysis of electrophysiological data. Mice were head fixed while free to run on a spherical treadmill.
Extracellular signals were recorded from all layers of the mPFC of both WT (n = 8) and KO mice (n = 5) using multi-electrode silicon microprobes. Spikes were sorted into tentative single units (seeMethod Details). Motion on the treadmill was also recorded, and traces were separated into locomotion and immobility segments.
(B) Distribution and corresponding histograms of mean waveform peak-to-trough ratios versus peak-to-trough time distances for the two unit clusters consisting of WS and NS units. The inset depicts the average waveforms from all units in the two clusters.
(C) Unit spike waveforms averaged over all individual spikes (gray) from two example units from a WT mouse and a KO mouse.
(D and E) Distributions of average firing rates during locomotion (D) and immobility (E) for all WS and NS units in WT versus KO mice. Solid lines indicate the mean rates over all cells in the two groups. No significant difference for WS units. **p < 0.01; two-sample t test; Bonferroni corrected.
(F) Mean LFP bandpower during motion (top) and immobility (bottom) in WT and Cntnap2 KO mice, calculated from a single representative channel per mouse, located in the prelimbic mPFC. No significant differences were observed (p > 0.05, Wilcoxon test).
All errors bars indicate the SEM.
mice (Liska et al., 2018), as well as work in somatosensory cortex, showing reductions in both excitatory and inhibitory input (Antoine et al., 2019). Moreover, work in dissociated neuronal cultures
showed decreased mEPSC and mIPSC frequency after RNAi knockdown of CNTNAP2, which was linked to decreased dendritic arbor complexity and decreased spine head size (Anderson et al.,
A B
C D
E F
Figure 5. Altered Phase Locking to Low-Frequency LFP Oscillations inIn Vivo-Recorded Single Units of Cntnap2 KO Mice
(A) Left: LFP delta frequency phase histograms of spikes (% over all spikes) of two WS units. Two cycles of the oscillation are shown together with a representation of the LFP oscillation for clarity. Solid lines indicate the mean (preferred) phase of each unit. Right: Same as the left, but for two example NS units.
(B) Similar to (A) for theta frequency phase distributions.
(C) Distributions and corresponding histograms of phase-locking strength (mean vector length) versus preferred phases of pooled WS units (left) or NS units (right) from WT and KO mice to delta (top) and theta (bottom) LFP oscillations during locomotion. Only significantly phase-locked units with sufficient spiking are included (seeMethod Details). Filled rectangles and solid lines depict the mean±SE of the distributions and histograms, respectively (circular mean for phase distributions), for the two mouse groups. All of the distributions were significantly non-uniform (p < 0.05; Rayleigh test for non-uniformity; Bonferroni corrected over mouse groups), except for the theta frequency distribution of KO units (indicated by open rectangle and dashed lines accordingly). Asterisks indicate significant differences either in mean vector length (p < 0.05; t test if both distributions are normally distributed according to the Lilliefors test of normality with 5%
significance level, or Wilcoxon test otherwise) or in mean preferred phase accordingly (p < 0.05; parametric Watson-Williams test).
(D) Same as (C) for immobility segments.
(E and F) Correlation coefficient distributions between pairs of wide-spiking units (left), narrow-spiking units (right), and wide-narrow spiking unit pairs (bottom), over all corresponding WT (blue) and KO (red) unit pairs in each mouse. Firing rates were computed during locomotion (E) or immobility segments (F) over 500-ms- long time bins. Lines indicate the means of corresponding distributions. *p < 0.05, Wilcoxon test, Bonferroni corrected over the three unit-type combinations.
All errors bars indicate the SEM.
2012). While in general agreement with our findings, we found no changes in dendritic arborizations in the intact mPFC, despite a clear decrease in spine density. In addition, we found no significant changes in spine size or synapse length as assessed by electron microscopy in L2/3 of the mPFC. These inconsistencies between our findings and previous reports, specifically regarding dendritic morphology and spines, may arise from inherent differences between cultured neurons andin vivopreparations.
Our observed decrease in multisynapse boutons (MSBs) and in- crease in perforated postsynaptic densities (PSDs) further sup- ports the notion that CNTNAP2 may have a complex role at the synaptic cleft. Since both MSBs and perforated PSDs are markers of well-developed synapses, this could also indicate that the loss of Cntnap2 disrupts synapse maturation dynamics via both pre- and postsynaptic mechanisms (Toni et al., 1999; Fiala et al., 2002; Nikonenko et al., 2002; Ganeshina et al., 2004; Geinisman, 1993). Accordingly, recent work in cultured cortical neurons from KO mice reported a decrease in spine density and in localization of the AMPA-subtype glutamate receptor GluA1 in the spines of Cntnap2 KO neurons (Varea et al., 2015), which is consistent with the small decrease in mEPSC amplitude that we observed.
This is also concurrent with recent work, showing that Cntnap2 KO mice have reduced AMPA receptor expression and transmis- sionin vivo(Kim et al., 2019). Our results are also in line with our previous work, reporting increased spine elimination and decreased spine density in apical dendrites of L5 neurons in the somatosensory cortex of Cntnap2 KO mice (Gdalyahu et al., 2015). Therefore, the effects of CNTNAP2 loss on spine density may generalize as decreased spine stability throughout the cortex.
Our observed lack of changes in intrinsic excitability of L2/3 pyramidal neurons or PV+ neurons appears surprising, given that Cntnap2 is important for potassium channel localization in axons (Poliak et al., 2003). Nonetheless, it is likely that Cntnap2 loss affects neurons in a cell type- and projection-specific manner, as supported by recent reports of decreased input resistance and intrinsic excitability of L5 subcortical projecting neurons of the mPFC (Brumback et al., 2018).
Such alterations in synaptic physiology and neurotransmis- sion seem to be a common theme among mouse models of neurodevelopmental disorders. Loss-of-function mutations in Shank3, MECP2, and Ube3a (modeling Phelan-McDermid, Rett, and Angelman syndromes, respectively) result in decreased spine density and excitatory neurotransmission in the cortex (Dani et al., 2005; Belichenko et al., 2009; Wallace et al., 2012; Zhou et al., 2016). Moreover, spine maturation is impaired in fragile X model mice (Cruz-Martı´n et al., 2010), similar to what we find in Cntnap2 KO, and cortical inhibitory neuro- transmission is similarly compromised in a number of these dis- orders (Gibson et al., 2008; Curia et al., 2009; Cea-Del Rio and Huntsman, 2014; Banerjee et al., 2016). This posits the notion that increasing or modulating excitatory and inhibitory synaptic connectivity, especially in a cell type- and projection-specific manner, may be therapeutically relevant.
Concurrently, we find that the loss of excitatory and inhibitory synaptic connectivity in Cntnap2 KO mice is associated with a decrease in the magnitude of phase-locked firing of inhibitory and excitatory neurons to delta oscillationsin vivo. Inhibitory neurons were less phase locked to both theta oscillations, and
they tended to fire later in the oscillatory cycle. These findings were more prominent during locomotion, suggesting that the ef- fects from changes in connectivity can be more prominent during specific conditions or arousal states. Dysfunctional oscillations have often been reported in humans diagnosed with ASD and have been proposed as biomarkers (Rojas and Wilson, 2014;
Simon and Wallace, 2016; Sidorov et al., 2017). Specifically, delta (4 Hz) oscillations in mPFC can entrain other brain regions, such as the amygdala during fear expression and the ventral tegmental area and hippocampus during working memory (Fuji- sawa and Buzsa´ki, 2011). Theta (4–8 Hz) oscillations in the mPFC have been associated with signaling safety under conditions of learned fear (Likhtik et al., 2014). Thus, the phase-locking alter- ations observed in mPFC neurons of Cntnap2 KO mice could be linked to some of the cognitive and affective behavioral dis- ruptions displayed by this mouse model.
The mPFC electrophysiological alterations we observed in Cntnap2 KO mice could underlie some of the autism-related phenotypes in the model, such as deficits in social interactions and communication, as supported by observations that increasing the ratio of excitation to inhibition in the mPFC could disrupt social interactions in WT mice (Yizhar et al., 2011). More- over, an opsin-mediated increase in PV+cell excitability or a decrease in pyramidal neuron activity within the prelimbic mPFC can rescue social behavior and hyperactivity in Cntnap2 KO mice (Selimbeyoglu et al., 2017). Such disruptions in E/I bal- ance could also reflect as broader-scale alterations in oscillatory power and synchrony and could be mechanistically linked to the altered representation of social stimuli in the mPFC of Cntnap2 KO mice (Levy et al., 2018).
Future studies need to dissect the inputs and outputs of the prefrontal cortex in a cell type- and projection-specific manner to uncover whether changes in excitatory and inhibitory connec- tivity are generalized or selectively impaired in specific circuits.
This will require experiments in which Cntnap2 is conditionally deleted in specific cell types using Cre-Lox techniques. Also, it is not known whether the synaptic and population dynamic changes we found can be reversed or ameliorated by restoring Cntnap2 gene expression in adulthood or whether very early in- terventions will be needed. Finally, it will be important to under- stand how the delta and theta phase locking affects the recruit- ment of other connected brain regions, especially in the context of social engagement.
STAR+METHODS
Detailed methods are provided in the online version of this paper and include the following:
d KEY RESOURCES TABLE
d CONTACT FOR REAGENT AND RESOURCE SHARING
d EXPERIMENTAL MODEL AND SUBJECT DETAILS
d METHOD DETAILS B Slice preparation B Electrophysiology B Current-clamp recordings B Voltage-clamp recordings
B Evoked Excitatory Postsynaptic Currents
B Laser Scanning Photostimulation (LSPS) B Immunohistochemistry
B Cell density measurements
B Tissue preparation and electron microscopy
B Surgery, behavioral habituation, and in vivo electro- physiology
B Motion detection
d QUANTIFICATION AND STATISTICAL ANALYSIS B Local Field Potential Analysis
B In vivoUnit Clustering and Analysis
d DATA AND SOFTWARE AVAILABILITY
SUPPLEMENTAL INFORMATION
Supplemental Information can be found online athttps://doi.org/10.1016/j.
celrep.2019.05.006.
ACKNOWLEDGMENTS
P.G., J.T., and M.T.L. were supported by NIH grants 1R01MH101198, U01 NS094286, R01 MH105427, and U54 HD87101. M.T.L. was funded by the UCLA Eugene Cota-Robles Fellowship, NSF-GRFP DGE-0707424, NIMH T32MH073526, a UCLA Neurobehavioral Genetics Training Grant, the UCLA Dissertation Year Fellowship, and NIH grant 5U01NS094286. T.S. was sup- ported by a postdoctoral fellowship from the Epilepsy Foundation. S.M. was supported by NIH DA034178. D.H.G. was supported by NIH grants P50 HD 055784-12 and U01 MH115746-02 and the Simons Foundation Grant 401457. We thank T€unde Magyar and Rena´ta Pop for excellent technical assis- tance. The project is supported by the European Union and co-financed by the European Social Fund (grant agreement no. EFOP-3.6.2-16-2017-0008: The Role of Neuro-inflammation in Neurodegeneration: From Molecules to Clinics).
B.R. was supported by the Ja´nos Bolyai Research Fellowship from the Hun- garian Academy of Sciences and by U´ NKP-18-4 New National Excellence Pro- gram of the Ministry of Human Capacities. Silicon microprobes were sup- ported by NSF Neuronex Award 1707408.
AUTHOR CONTRIBUTIONS
M.T.L., D.H.G., and P.G. designed the experiments. M.T.L. carried out slice re- cordings, neuronal anatomy experiments,in vivoexperiments, and analyzed the data. J.T. analyzedin vivorecordings. T.S. helped with experiment design and built thein vivorecording setup. I.B. performed surgeries,in vivorecord- ings, and immunohistochemistry. T.I. and R.S. performed the LSPS experi- ments and analysis, and X.X. helped with experiment design. G.M.M. and B.R. performed the electron microscopy and analysis. A.M., S.C., and K.Y.C. performed the immunohistochemistry. A.F., R.G., N.S., and D.T. per- formed spike sorting in PyClust and helped within vivorecordings. M.A. per- formed the dendrite tracing. H.D. helped with mouse breeding and genotyp- ing. O.P. contributed to experiment design. S.M. provided custom-built silicon microprobes and helped with setting up thein vivoelectrophysiological recordings. M.T.L., J.T., and P.G. wrote the manuscript.
DECLARATION OF INTERESTS
The authors declare no competing interests.
Received: August 14, 2018 Revised: February 20, 2019 Accepted: April 30, 2019 Published: May 28, 2019 REFERENCES
Alarco´n, M., Abrahams, B.S., Stone, J.L., Duvall, J.A., Perederiy, J.V., Bomar, J.M., Sebat, J., Wigler, M., Martin, C.L., Ledbetter, D.H., et al. (2008). Linkage,
association, and gene-expression analyses identify CNTNAP2 as an autism- susceptibility gene. Am. J. Hum. Genet.82, 150–159.
American Psychiatric Association, . (2013). Diagnostic and Statistical Manual of Mental Disorders, 5th ed. DSM-5 (American Psychiatric Association).
Anderson, G.R., Galfin, T., Xu, W., Aoto, J., Malenka, R.C., and Sudhof, T.C.
(2012). Candidate autism gene screen identifies critical role for cell-adhesion molecule CASPR2 in dendritic arborization and spine development. Proc.
Natl. Acad. Sci. USA109, 18120–18125.
Antoine, M.W., Langberg, T., Schnepel, P., and Feldman, D.E. (2019).
Increased excitation-inhibition ratio stabilizes synapse and circuit excitability in four autism mouse models. Neuron101, 648–661.
Arking, D.E., Cutler, D.J., Brune, C.W., Teslovich, T.M., West, K., Ikeda, M., Rea, A., Guy, M., Lin, S., Cook, E.H., and Chakravarti, A. (2008). A Common Genetic Variant in the Neurexin Superfamily Member CNTNAP2 Increases Familial Risk of Autism. Am. J. Hum. Genet.82, 160–164.
Banerjee, A., Rikhye, R.V., Breton-Provencher, V., Tang, X., Li, C., Li, K., Run- yan, C.A., Fu, Z., Jaenisch, R., and Sur, M. (2016). Jointly reduced inhibition and excitation underlies circuit-wide changes in cortical processing in Rett syndrome. Proc. Natl. Acad. Sci. USA113, E7287–E7296.
Belichenko, N.P., Belichenko, P.V., and Mobley, W.C. (2009). Evidence for both neuronal cell autonomous and nonautonomous effects of methyl-CpG- binding protein 2 in the cerebral cortex of female mice with Mecp2 mutation.
Neurobiol. Dis.34, 71–77.
Brumback, A.C., Ellwood, I.T., Kjaerby, C., Iafrati, J., Robinson, J., Robinson, S., Lee, A.T., Patel, T., Nagaraj, S., Davatolhagh, F., et al. (2018). Identifying specific prefrontal neurons that contribute to autism-associated abnormalities in physiology and social behavior. Mol. Psychiatry23, 2078–2089.
Buzsa´ki, G., Anastassiou, C.A., and Koch, C. (2012). The origin of extracellular fields and currents–EEG, ECoG, LFP and spikes. Nat. Rev. Neurosci.13, 407–420.
Calverley, R.K.S., and Jones, D.G. (1990). Contributions of dendritic spines and perforated synapses to synaptic plasticity. Brain Res. Brain Res. Rev.
15, 215–249.
Cea-Del Rio, C.A., and Huntsman, M.M. (2014). The contribution of inhibitory interneurons to circuit dysfunction in Fragile X Syndrome. Front. Cell. Neuro- sci.8, 245.
Chen, J.A., Pen˜agarikano, O., Belgard, T.G., Swarup, V., and Geschwind, D.H.
(2015). The emerging picture of autism spectrum disorder: genetics and pa- thology. Annu. Rev. Pathol.10, 111–144.
Cruz-Martı´n, A., Crespo, M., and Portera-Cailliau, C. (2010). Delayed Stabiliza- tion of Dendritic Spines in Fragile X Mice. J. Neurosci.30, 7793–7803.
Curia, G., Papouin, T., Se´gue´la, P., and Avoli, M. (2009). Downregulation of tonic GABAergic inhibition in a mouse model of fragile X syndrome. Cereb.
Cortex19, 1515–1520.
Dani, V.S., Chang, Q., Maffei, A., Turrigiano, G.G., Jaenisch, R., and Nelson, S.B. (2005). Reduced cortical activity due to a shift in the balance between excitation and inhibition in a mouse model of Rett syndrome. Proc. Natl.
Acad. Sci. USA102, 12560–12565.
Dantzker, J.L., and Callaway, E.M. (2000). Laminar sources of synaptic input to cortical inhibitory interneurons and pyramidal neurons. Nat. Neurosci. 3, 701–707.
de la Torre-Ubieta, L., Won, H., Stein, J.L., and Geschwind, D.H. (2016).
Advancing the understanding of autism disease mechanisms through ge- netics. Nat. Med.22, 345–361.
Du, J., Blanche, T.J., Harrison, R.R., Lester, H.A., and Masmanidis, S.C.
(2011). Multiplexed, high density electrophysiology with nanofabricated neural probes. PLoS One6, e26204.
Fiala, J.C., Allwardt, B., and Harris, K.M. (2002). Dendritic spines do not split during hippocampal LTP or maturation. Nat. Neurosci.5, 297–298.
Fujisawa, S., and Buzsa´ki, G. (2011). A 4 Hz oscillation adaptively synchronizes prefrontal, VTA, and hippocampal activities. Neuron72, 153–165.
Ganeshina, O., Berry, R.W., Petralia, R.S., Nicholson, D.A., and Geinisman, Y.
(2004). Synapses with a segmented, completely partitioned postsynaptic den- sity express more AMPA receptors than other axospinous synaptic junctions.
Neuroscience125, 615–623.
Gdalyahu, A., Lazaro, M., Penagarikano, O., Golshani, P., Trachtenberg, J.T., and Geschwind, D.H. (2015). Correction: The Autism Related Protein Contac- tin-Associated Protein-Like 2 (CNTNAP2) Stabilizes New Spines: An In Vivo Mouse Study. PLoS One10, e0129638.
Geinisman, Y. (1993). Perforated axospinous synapses with multiple, completely partitioned transmission zones: probable structural intermediates in synaptic plasticity. Hippocampus3, 417–433.
Geschwind, D.H. (2011). Genetics of autism spectrum disorders. Trends Cogn.
Sci.15, 409–416.
Gibson, J.R., Bartley, A.F., Hays, S.A., and Huber, K.M. (2008). Imbalance of neocortical excitation and inhibition and altered UP states reflect network hy- perexcitability in the mouse model of fragile X syndrome. J. Neurophysiol.100, 2615–2626.
Gilman, S.R., Iossifov, I., Levy, D., Ronemus, M., Wigler, M., and Vitkup, D.
(2011). Rare de novo variants associated with autism implicate a large func- tional network of genes involved in formation and function of synapses. Neuron 70, 898–907.
Golomb, D., and Hansel, D. (2000). The number of synaptic inputs and the synchrony of large, sparse neuronal networks. Neural Comput. 12, 1095–1139.
Greer, P.L., Hanayama, R., Bloodgood, B.L., Mardinly, A.R., Lipton, D.M., Flavell, S.W., Kim, T.K., Griffith, E.C., Waldon, Z., Maehr, R., et al. (2010).
The Angelman Syndrome protein Ube3A regulates synapse development by ubiquitinating arc. Cell140, 704–716.
Grossmann, T. (2013). The role of medial prefrontal cortex in early social cogni- tion. Front. Hum. Neurosci.7, 340.
Harrison, R.R., and Charles, C. (2003). A low-power low-noise CMOS amplifier for neural recording applications. IEEE J. Solid-State Circuits38, 958–965.
Iossifov, I., O’Roak, B.J., Sanders, S.J., Ronemus, M., Krumm, N., Levy, D., Stessman, H.A., Witherspoon, K.T., Vives, L., Patterson, K.E., et al. (2014).
The contribution of de novo coding mutations to autism spectrum disorder.
Nature515, 216–221.
Jurgensen, S., and Castillo, P.E. (2015). Selective Dysregulation of Hippo- campal Inhibition in the Mouse Lacking Autism Candidate Gene CNTNAP2.
J. Neurosci.35, 14681–14687.
Kim, J.-W., Park, K., Kang, R.J., Gonzalez, E.L.T., Kim, D.G., Oh, H.A., Seung, H., Ko, M.J., Kwon, K.J., Kim, K.C., et al. (2019). Pharmacological modulation of AMPA receptor rescues social impairments in animal models of autism.
Neuropsychopharmacology44, 314–323.
Klausberger, T., and Somogyi, P. (2008). Neuronal Diversity and Temporal Dy- namics: The Unity of Hippocampal Circuit Operations. Science321, 53–57.
Krishnan, A., Zhang, R., Yao, V., Theesfeld, C.L., Wong, A.K., Tadych, A., Vol- fovsky, N., Packer, A., Lash, A., and Troyanskaya, O.G. (2016). Genome-wide prediction and functional characterization of the genetic basis of autism spec- trum disorder. Nat. Neurosci.19, 1454–1462.
Leppa, V.M., Kravitz, S.N., Martin, C.L., Andrieux, J., Le Caignec, C., Martin- Coignard, D., DyBuncio, C., Sanders, S.J., Lowe, J.K., Cantor, R.M., et al.
(2016). Rare Inherited and De Novo CNVs Reveal Complex Contributions to ASD Risk in Multiplex Families. Am. J. Hum. Genet.99, 540–554.
Levy, D.R., Tamir, T., Kaufman, M., Weissbrod, A., Schneidman, E., and Yiz- har, O. (2018). Dynamics of social representation in the mouse prefrontal cor- tex. bioRxiv.https://doi.org/10.1101/321182.
Likhtik, E., Stujenske, J.M., Topiwala, M.A., Harris, A.Z., and Gordon, J.A.
(2014). Prefrontal entrainment of amygdala activity signals safety in learned fear and innate anxiety. Nat. Neurosci.17, 106–113.
Liska, A., Bertero, A., Gomolka, R., Sabbioni, M., Galbusera, A., Barsotti, N., Panzeri, S., Scattoni, M.L., Pasqualetti, M., and Gozzi, A. (2018). Homozygous Loss of Autism-Risk Gene CNTNAP2 Results in Reduced Local and Long- Range Prefrontal Functional Connectivity. Cereb. Cortex28, 1141–1153.
Nikonenko, I., Jourdain, P., Alberi, S., Toni, N., and Muller, D. (2002). Activity- induced changes of spine morphology. Hippocampus12, 585–591.
O’Roak, B.J., Vives, L., Fu, W., Egertson, J.D., Stanaway, I.B., Phelps, I.G., Carvill, G., Kumar, A., Lee, C., Ankenman, K., et al. (2012). Multiplex targeted sequencing identifies recurrently mutated genes in autism spectrum disorders.
Science338, 1619–1622.
Parikshak, N.N., Luo, R., Zhang, A., Won, H., Lowe, J.K., Chandran, V., Hor- vath, S., and Geschwind, D.H. (2013). Integrative functional genomic analyses implicate specific molecular pathways and circuits in autism. Cell155, 1008–
1021.
Pen˜agarikano, O., Abrahams, B.S., Herman, E.I., Winden, K.D., Gdalyahu, A., Dong, H., Sonnenblick, L.I., Gruver, R., Almajano, J., Bragin, A., et al. (2011).
Absence of CNTNAP2 leads to epilepsy, neuronal migration abnormalities, and core autism-related deficits. Cell147, 235–246.
Polack, P.-O., Friedman, J., and Golshani, P. (2013). Cellular mechanisms of brain state-dependent gain modulation in visual cortex. Nat. Neurosci.16, 1331–1339.
Poliak, S., Gollan, L., Martinez, R., Custer, A., Einheber, S., Salzer, J.L., Trimmer, J.S., Shrager, P., and Peles, E. (1999). Caspr2, a new member of the neurexin superfamily, is localized at the juxtaparanodes of myelinated axons and associates with K+ channels. Neuron24, 1037–1047.
Poliak, S., Gollan, L., Salomon, D., Berglund, E.O., Ohara, R., Ranscht, B., and Peles, E. (2001). Localization of Caspr2 in Myelinated Nerves Depends on Axon–Glia Interactions and the Generation of Barriers along the Axon.
J. Neurosci21, 7568–7575.
Poliak, S., Salomon, D., Elhanany, H., Sabanay, H., Kiernan, B., Pevny, L., Stewart, C.L., Xu, X., Chiu, S.Y., Shrager, P., et al. (2003). Juxtaparanodal clus- tering of Shaker-like K+ channels in myelinated axons depends on Caspr2 and TAG-1. J. Cell Biol.162, 1149–1160.
Poot, M., Beyer, V., Schwaab, I., Damatova, N., Van’t Slot, R., Prothero, J., Holder, S.E., and Haaf, T. (2010). Disruption of CNTNAP2 and additional struc- tural genome changes in a boy with speech delay and autism spectrum disor- der. Neurogenetics11, 81–89.
Redcay, E., Moran, J.M., Mavros, P.L., Tager-Flusberg, H., Gabrieli, J.D., and Whitfield-Gabrieli, S. (2013). Intrinsic functional network organization in high- functioning adolescents with autism spectrum disorder. Front. Hum. Neurosci.
7, 573.
Rojas, D.C., and Wilson, L.B. (2014).g-band abnormalities as markers of autism spectrum disorders. Biomarkers Med.8, 353–368.
Sanders, S.J., Murtha, M.T., Gupta, A.R., Murdoch, J.D., Raubeson, M.J., Will- sey, A.J., Ercan-Sencicek, A.G., DiLullo, N.M., Parikshak, N.N., Stein, J.L., et al. (2012). De novo mutations revealed by whole-exome sequencing are strongly associated with autism. Nature485, 237–241.
Schneider, C.A., Rasband, W.S., and Eliceiri, K.W. (2012). NIH Image to ImageJ: 25 years of image analysis. Nat. Methods9, 671–675.
Scott, R., Sa´nchez-Aguilera, A., van Elst, K., Lim, L., Dehorter, N., Bae, S.E., Bartolini, G., Peles, E., Kas, M.J.H., Bruining, H., and Marı´n, O. (2019). Loss of Cntnap2 Causes Axonal Excitability Deficits, Developmental Delay in Cortical Myelination, and Abnormal Stereotyped Motor Behavior. Cereb. Cor- tex29, 586–597.
Scott-Van Zeeland, A.A., Abrahams, B.S., Alvarez-Retuerto, A.I., Sonnenblick, L.I., Rudie, J.D., Ghahremani, D., Mumford, J.A., Poldrack, R.A., Dapretto, M., Geschwind, D.H., and Bookheimer, S.Y. (2010). Altered Functional Connectiv- ity in Frontal Lobe Circuits Is Associated with Variation in the Autism Risk Gene CNTNAP2. Sci. Transl. Med.2, 56ra80.
Selimbeyoglu, A., Kim, C.K., Inoue, M., Lee, S.Y., Hong, A.S.O., Kauvar, I., Ramakrishnan, C., Fenno, L.E., Davidson, T.J., Wright, M., and Deisseroth, K. (2017). Modulation of prefrontal cortex excitation/inhibition balance rescues social behavior in CNTNAP2 -deficient mice. Sci. Transl. Med.9, eaah6733.
Shi, Y., Nenadic, Z., and Xu, X. (2010). Novel use of matched filtering for syn- aptic event detection and extraction. PLoS One5, e15517.
Shobe, J.L., Claar, L.D., Parhami, S., Bakhurin, K.I., and Masmanidis, S.C.
(2015). Brain activity mapping at multiple scales with silicon microprobes con- taining 1,024 electrodes. J. Neurophysiol.114, 2043–2052.
Sidorov, M.S., Deck, G.M., Dolatshahi, M., Thibert, R.L., Bird, L.M., Chu, C.J., and Philpot, B.D. (2017). Delta rhythmicity is a reliable EEG biomarker in Angel- man syndrome: a parallel mouse and human analysis. J. Neurodev. Disord.9, 17.
Simon, D.M., and Wallace, M.T. (2016). Dysfunction of sensory oscillations in Autism Spectrum Disorder. Neurosci. Biobehav. Rev.68, 848–861.
Sorra, K.E., Fiala, J.C., and Harris, K.M. (1998). Critical assessment of the involvement of perforations, spinules, and spine branching in hippocampal synapse formation. J. Comp. Neurol.398, 225–240.
Strauss, K.A., Puffenberger, E.G., Huentelman, M.J., Gottlieb, S., Dobrin, S.E., Parod, J.M., Stephan, D.A., and Morton, D.H. (2006). Recessive Symptomatic Focal Epilepsy and Mutant Contactin-Associated Protein-like 2. N. Engl. J.
Med.354, 1370–1377.
Toni, N., Buchs, P.A., Nikonenko, I., Bron, C.R., and Muller, D. (1999). LTP pro- motes formation of multiple spine synapses between a single axon terminal and a dendrite. Nature402, 421–425.
Varea, O., Martin-de-Saavedra, M.D., Kopeikina, K.J., Sch€urmann, B., Fleming, H.J., Fawcett-Patel, J.M., Bach, A., Jang, S., Peles, E., Kim, E., and Penzes, P. (2015). Synaptic abnormalities and cytoplasmic glutamate re-
ceptor aggregates in contactin associated protein-like Caspr2 knockout neu- rons. Proc. Natl. Acad. Sci. USA112, 6176–6181.
Voineagu, I., Wang, X., Johnston, P., Lowe, J.K., Tian, Y., Horvath, S., Mill, J., Cantor, R.M., Blencowe, B.J., and Geschwind, D.H. (2011). Transcriptomic analysis of autistic brain reveals convergent molecular pathology. Nature 474, 380–384.
Wallace, M.L., Burette, A.C., Weinberg, R.J., and Philpot, B.D. (2012).
Maternal loss of Ube3a produces an excitatory/inhibitory imbalance through neuron type-specific synaptic defects. Neuron74, 793–800.
Xu, X., Olivas, N.D., Levi, R., Ikrar, T., and Nenadic, Z. (2010). High precision and fast functional mapping of cortical circuitry through a novel combination of voltage sensitive dye imaging and laser scanning photostimulation.
J. Neurophysiol.103, 2301–2312.
Yizhar, O., Fenno, L.E., Prigge, M., Schneider, F., Davidson, T.J., O’Shea, D.J., Sohal, V.S., Goshen, I., Finkelstein, J., Paz, J.T., et al. (2011). Neocortical exci- tation/inhibition balance in information processing and social dysfunction. Na- ture477, 171–178.
Zhou, Y., Kaiser, T., Monteiro, P., Zhang, X., Van der Goes, M.S., Wang, D., Barak, B., Zeng, M., Li, C., Lu, C., et al. (2016). Mice with Shank3 Mutations Associated with ASD and Schizophrenia Display Both Shared and Distinct De- fects. Neuron89, 147–162.