Article
Proximodistal Organization of the CA2 Hippocampal Area
Graphical Abstract
Highlights
d
The CA2 region is organized around the limit of the mossy fibers
d
Heterogeneous pyramidal cell types populate the proximal and distal CA2 region
d
Responses to intra- and extra-hippocampal inputs segregate along this axis
d
CA2 oscillatory activity and spatial coding change proximodistally
Authors
Ivan Fernandez-Lamo, Daniel Gomez-Dominguez,
Alberto Sanchez-Aguilera, ..., Elena Cid, Antal Berenyi, Liset Menendez de la Prida
Correspondence
lmprida@cajal.csic.es
In Brief
The CA2 region of the hippocampus has distinctive molecular, physiological, and connectivity properties. Fernandez-Lamo et al. provide data supporting a
proximodistal functional organization of this region in the rat.
Fernandez-Lamo et al., 2019, Cell Reports26, 1734–1746 February 12, 2019ª2019 The Author(s).
https://doi.org/10.1016/j.celrep.2019.01.060
Cell Reports
Article
Proximodistal Organization of the CA2 Hippocampal Area
Ivan Fernandez-Lamo,1,4Daniel Gomez-Dominguez,1,4Alberto Sanchez-Aguilera,1,4Azahara Oliva,2 Aixa Victoria Morales,1Manuel Valero,1Elena Cid,1Antal Berenyi,3and Liset Menendez de la Prida1,5,*
1Instituto Cajal, CSIC, Ave Doctor Arce 37, Madrid 28002, Spain
2Department of Neuroscience, Zuckerman and Kavli Institutes, Columbia University, 3227 Broadway, New York, NY 10027, USA
3MTA-SZTE ‘‘Momentum’’ Oscillatory Neuronal Networks Research Group, Interdisciplinary Excellence Centre, Department of Physiology, University of Szeged, Szeged 6720, Hungary
4These authors contributed equally
5Lead Contact
*Correspondence:lmprida@cajal.csic.es https://doi.org/10.1016/j.celrep.2019.01.060
SUMMARY
The proximodistal axis is considered a major organi- zational principle of the hippocampus. At the inter- face between the hippocampus and other brain structures, CA2 apparently breaks this rule. The re- gion is involved in social, temporal, and contextual memory function, but mechanisms remain elusive.
Here, we reveal cell-type heterogeneity and a charac- teristic expression gradient of the transcription fac- tor Sox5 within CA2 in the rat. Using intracellular and extracellular recordings followed by neurochem- ical identification of single cells, we find marked proximodistal trends of synaptic activity, subthresh- old membrane potentials, and phase-locked firing coupled to theta and gamma oscillations. Phase- shifting membrane potentials and opposite proximo- distal correlations with theta sinks and sources at different layers support influences from different cur- rent generators. CA2 oscillatory activity and place coding of rats running in a linear maze reflect proxi- modistal state-dependent trends. We suggest that the structure and function of CA2 are distributed along the proximodistal hippocampal axis.
INTRODUCTION
The cornu ammonis 2 (CA2) hippocampal region has distinctive molecular, physiological, and connectivity properties (Dudek et al., 2016). CA2 pyramidal cells respond vigorously to direct en- torhinal inputs from layer II stellate cells (Leroy et al., 2017; Sun et al., 2017). In addition, they receive a direct mossy fiber connection from granule cells and contribute to a parallel trisy- naptic circuit to deep CA1 sublayers (Kohara et al., 2014; Sun et al., 2017). Recurrently associated with CA3, CA2 pyramidal cells project to superficial layers of the medial entorhinal cortex (Rowland et al., 2013).g-Aminobutyric acid-ergic (GABAergic) innervation by local parvalbumin-expressing cells and specific classes of dendritic-targeting interneurons is particularly promi- nent in this region (Botcher et al., 2014; Mercer et al., 2012a,
2012b), supporting strong inhibitory control (Chevaleyre and Siegelbaum, 2010; Piskorowski and Chevaleyre, 2013). CA2 is specifically targeted by hypothalamic fibers releasing vaso- pressin and oxytocin during social interaction (Caldwell et al., 2008; Cui et al., 2013; Smith et al., 2016) and by supramammil- lary glutamatergic cells with a major role in wake-sleep regula- tion (Pedersen et al., 2017; Soussi et al., 2010).
Given recurrent connections with these brain systems, CA2 can be considered a network hub. Not surprisingly, it is involved in a diversity of functions, including spatial and social memory.
Place fields are more abundant but less precise in CA2 than in CA3 and CA1 (Oliva et al., 2016a). Some studies have revealed that CA2 ensemble firing changes prominently over time (Alex- ander et al., 2016; Lee et al., 2015; Lu et al., 2015; Mankin et al., 2015). In contrast, others have reported some cells firing in place during brief exploratory pauses and over sleep (Kay et al., 2016). This leads to the idea that CA2 is specialized in bridging contextual representations, supporting their contribu- tion to episodic memory function (Mankin et al., 2015; Wintzer et al., 2014). When CA2 cells are specifically manipulated, de- fects emerge in contextual habituation to a neutral environment (Boehringer et al., 2017), but not for contextual fear memory or spatial learning (Hitti and Siegelbaum, 2014). Instead, memory for a familiar conspecific is affected. Such a social memory role may reflect not only specific features of CA2 (Leroy et al., 2017) but also downstream effects (Okuyama et al., 2016;
Raam et al., 2017). Possibly, CA2 is instrumental in interfacing among brain systems, but the mechanisms are not known.
The heterogeneous oscillatory behavior of putative CA2 cells was reported using extracellular recordings (Kay et al., 2016;
Oliva et al., 2016b, 2016a). Moreover, in evaluating proximodistal changes of firing similarity between contexts, a significant spatial in-homogeneity was found at the CA3a-CA2 border (Lu et al., 2015). Unfortunately, without morphological confirmation, it is difficult to interpret these results given the miscellaneous composition of this transitional area (Valero et al., 2015). Here, we reveal striking heterogeneity of cell-type-specific molecular markers around dorsal CA2 in rats and use intracellular and extracellularin vivorecordings followed by neurochemical iden- tification to target this region. We found marked proximodistal trends of synaptic activity and theta/gamma oscillations in both subthreshold membrane potentials and phase-locked
firing. Our data disclose opposing entrainment by different cur- rent generators and GABAergic microcircuits across the prox- imal and distal sectors. Moreover, we found that these trends shape CA2 pyramidal cell state-dependent oscillatory activity and place coding.
RESULTS
Characteristic Features of Local Field Potentials around CA2
Local field potentials (LFPs) were recorded with multisite silicon probes around CA2 in 5 awake head-fixed rats. To target CA2 precisely, we learned to identify characteristic evoked responses to stimulation of the ipsilateral perforant pathway (PP) and contralateral CA3 (Figures S1A–S1D) (STAR Methods). Theta os- cillations and sharp-wave ripples were recorded during periods of running and immobility, respectively.
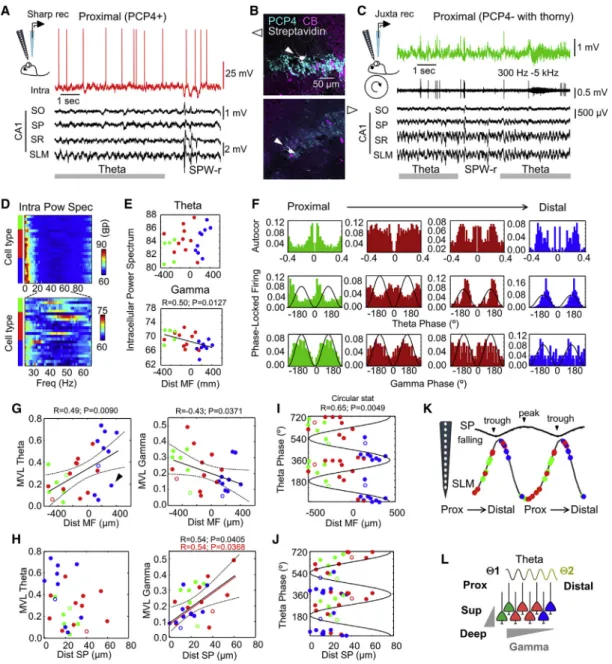
In simultaneous recordings from the stratum pyramidale (SP), we noted attenuation of theta activity and characteristic sharp-
wave ripple patterns around the CA2-CA1 border, as identified by the specific marker PCP4 (Figure 1A, left). Immunostaining against calbindin (CB) helped us to delineate the point at which mossy fibers (MFs) terminate (Figure 1A, arrowhead). Theta- nested gamma oscillations were typically recorded from CA3 (Figure 1A, right). Similar LFP profiles were recorded under ure- thane in 30 rats (Figure 1B), despite spectral differences with the drug-free condition (Figure 1C).
We evaluated LFP features quantitatively using detailed infor- mation on the location of recording sites along SP with respect to anatomical borders. The spectral power of the theta band (3–12 Hz) and the gamma band (30–90 Hz) was plotted as a func- tion of the site distance to MF along the SP contour (n = 13 re- cordings from 5 awake head-fixed rats, n = 52 recordings from 30 anesthetized rats) (Figure 1D) (STAR Methods). We noted representative spatial in-homogeneities of LFP signals around CA2. For theta, positive Pearson correlations were confirmed at both sides of the MF limit in an otherwise-negative global trend (Figure 1D, left; see alsoFigures S1E and S1F). This correlation Figure 1. Characteristic Features of Local Field Potentials around CA2
(A) Representative simultaneous LFP signals recorded at SP in awake head-fixed rats using multisite silicon probes. Probe tracks are identified in sections immunostained against PCP4 and CB. The limit of MF (open arrowhead) is taken as a reference for quantitative analysis.
(B) LFP recordings around CA2 obtained from urethane anesthetized rats.
(C) Representative power spectra during theta activity recorded at SP of CA2, CA3a, and CA1p under urethane (black) and in head-fixed conditions (orange).
(D) Individual spectral area of the theta band (3–12 Hz) and the gamma band (30–90 Hz) plotted as a function of electrode distance to MF. Data are from 52 recording locations from n = 30 urethane anesthetized rats and 13 recordings from n = 5 drug-free rats. Different Pearson correlations were obtained at both sides of MF for theta: R = 0.47, p = 0.0059 from 3 to 0 mm and R = 0.59, p = 0.0088 from 0 to 1 mm. Gamma power exhibited a significant negative correlation (R = 0.65, p < 0.0001).
(E) Grand average spectra of the ripple power recorded at SP (aligned by the sharp-wave peak at SR).
(F) Delay between the ripple power peak and the sharp-wave peak as a function of recording location. Note the earlier ripple peak (negative delays) at the limit with MF (arrowhead).
See alsoFigure S1.
paradox (Julious and Mullee, 1994) was not present in the gamma power, which decreased consistently (Figure 1D, right).
We also confirmed characteristic features of sharp-wave ripples around CA2 by looking at the temporal relationship between the ripple power and the sharp-wave peak (Figure 1E). As described (Oliva et al., 2016b), the maximal ripple power preceded sharp- wave peaks at CA2 (Figure 1F;Figures S1G and S1H). Indepen- dent of whether these features reflect volume-conducted and/or microcircuit effects, they represent characteristic LFP signatures of the CA2 region.
Molecular and Electrophysiological Cell-Type-Specific Heterogeneity around CA2
We next characterized cellular diversity around CA2. Immu- noreactivity against PCP4,a-Actinin2, CB, and Wfs1 allowed for classification of different cell types (STAR Methods). Us- ing the MF limit as a natural morphological landmark, we defined the proximal and distal sectors of CA2 (Figure 2A, discontinuous line), corresponding to CA2a and CA2b subre- gions (Dudek et al., 2016). We noted many cells positive for PCP4 distributed at both sides of the MF limit in rats (Fig- ure 2A), in contrast to mice that exhibit a narrower distal CA2 (Figure 2B) (Dudek et al., 2016; Kohara et al., 2014).
We also noted some PCP4+ cells in deep layers of CA3a in both species (Figures 2A and 2B, arrowheads). Similar to CA2 cells, they co-expressed PCP4 and a-Actinin2 (Fig- ure S2A). Many Wfs1+ CA1 pyramidal cells interspersed witha-Actinin2+ cells at distal CA2 (Figure 2A, right). Accord- ing to our estimates, CA2 spans about 250mm around the MF limit in the rat dorsal hippocampus (bregma 2.9 to
3.7 mm).
Using VGAT-VenusA transgenic rats to exclude interneurons, we quantified the distribution of pyramidal cells with cell-type- specific immunostaining (Figure S2B). Double immunostaining againsta-Actinin2/PCP4 (n = 6 sections from 3 rats) anda-Acti- nin2/Wfs1 (n = 6 sections from 3 rats) supported cellular hetero- geneity within CA2 (Figure 2C). At proximal CA2, most cells were PCP4+/a-Actinin2+ (65%), and some were negative for both markers (15%). These cells were VGAT , indicating they had a glutamatergic phenotype. In double immunostaining against a-Actinin2/Wfs1, we found a minority of Wfs1+ cells at proximal CA2 (<5%). In contrast, at distal CA2, many Wfs1+/a-Actinin2 cells (35%) intermingled with a-Actinin2+ cells (50%). The remaining Wfs1 /a-Actinin2 cells were VGAT+. Thus, hetero- geneous cell types intermix with CA2 pyramidal cells at the proximal and distal sectors. Similar features were seen in coronal and sagittal sections, confirming they did not depend on the orientation.
To identify cell types more precisely, we obtained in vivo intracellular recordings in urethane anesthetized rats, in combi- nation with 16-channel silicon probes (Figure 2D). We targeted pyramidal cells around the CA2 region using characteristic LFP features to guide sharp electrode penetrations (Figure S1B).
After recordings, cells were filled with Neurobiotin, visualized with streptavidin, and tested against PCP4,a-Actinin2, Wfs1, and CB immunoreactivity. Cell morphology was examined at 633magnification under the confocal microscope to look for thorny excrescences typical of CA3 pyramidal cells.
A total of 24 pyramidal cells were impaled in 24 rats. We found n = 5 a-Actinin2 or PCP4 cells with thorny excrescences classified as CA3 cells (Figure 2D, green), n = 10 cells express- ing PCP4 being classified as CA2 pyramidal cells (red), and n = 9 Wfs1+ CA1 pyramidal cells (blue). PCP4+ and Wfs1+ cells did not exhibit thorny excrescences. We recorded the proximodis- tal position of cell somata with respect to MF and confirmed the heterogeneous cellular composition of the CA2 region (Figure 2E). Electrophysiologically, we found no significant dif- ferences in the resting membrane potential (RMP), but we did find proximodistal trends for the maximal firing rate and sag in response to current pulses, confirmed by Pearson correlation (Figure 2E). We also noted some differences in the after-hyper- polarization (AHP) following an action potential (Figure 2E).
Some of these features were describedin vitrofor CA3a and CA2 pyramidal cells (Srinivas et al., 2017; Sun et al., 2017).
While differences in input resistance and difficulties to evaluate intrinsic propertiesin vivomay complicate interpretation, data suggest interaction between cell type and proximodistal loca- tion (Table S1).
We next looked for markers that may help in further identifying a proximodistal axis within CA2. Regionalized gene expression has been described along the transverse hippocampal axis and is exploited to define borders between regions along the Cornu Ammonis(Cembrowski et al., 2016). While working with Sox5, a transcription factor involved in several aspects of neuronal development, including cell fate determination (Quir- oga et al., 2015), we noted increasing proximodistal expression along CA3-CA2 in adult mice (Figures S2C and S2D). This re- gion- and cell-type-specific trend was cross-validated using RNA sequencing (RNA-seq) mouse data from Hipposeq (Cem- browski et al., 2016) (Figure S2E). In rats, we found a similar gradient of Sox5 expression (Figure 2F; Figure S2F) and confirmed regional trends by segmenting SP along CA3a-CA2 (one-way ANOVA, F(24) = 4.7, p = 0.008) (Figure 2G). Next, we asked whether Sox5 was differentially expressed across single cells within CA2 using co-localization witha-Actinin2 (Figure 2H, top). Quantification of the mean intensity of Sox5 expression in a-Actinin2+ cells showed a characteristic maximum around the point at which MF terminate (Figure 2H, bottom). Consistently, the expression dynamics of Sox5 reversed around this point, as tested separately at proximal and distal sectors (Figures 2H and 2I). Thus, in addition to different cell-type heterogeneity at proximal and distal sectors, the CA2 pyramidal cell population exhibits proximodistal molecular gradients around the MF border.
Cell-Type-Specific Differences of Theta and Gamma Firing Modulation around CA2
Next, we asked for functional proximodistal variations. Intracel- lular recordings obtained simultaneously to multisite LFP signals allowed us to evaluate oscillatory behavior of identified cell types around CA2 (n = 24 cells) (Figures 3A and 3B). Juxtacellularly labeled cells recorded simultaneously to LFPs in awake head- fixed rats were also obtained (n = 3 cells) (Figures 3B and 3C) (STAR Methods). Although theta under urethane (4 Hz) may differ from running theta (6–8 Hz), we aimed to compare modu- latory influences across and within cell types.
Under urethane, the power spectrum of intracellular mem- brane potential oscillations suggested a significant proximodis- tal gradient of the gamma power (30–90 Hz), but not the theta po- wer (4–12 Hz) (with similar trends for slow and fast gamma bands: R = 0.61, p = 0.0014, and R = 0.67, p = 0.0003, respectively) (Figures 3D and 3E). Phase-locked firing of single cells to LFP signals from the stratum lacunosum moleculare
(SLM) exhibited opposite behavior for theta and gamma (Fig- ure 3F). Theta-firing modulation increased toward distal CA2, while gamma modulation reversed, as quantified by the mean vector length (MVL) (Figure 3G). For this analysis, we included juxtacellularly labeled cells, which fit into the distribution (Fig- ure 3G, open dots). We noted a separated cluster of poorly theta-modulated cells, especially some distal Wfs1+ and Figure 2. Cell-Type-Specific Heterogeneity around CA2
(A) Immunoreactivity against PCP4,a-Actinin2, CB, and Wfs1 allowed evaluating cell-type heterogeneity around CA2. Images show co-localization among different markers (3 confocal optical sections). Some PCP4+ cells were identified in deep layers of CA3a and in CA1 (open arrows). MF was used to define the proximal (close to CA3a) and distal (close to CA1) sectors of CA2.
(B) PCP4 and CB expression in the mouse CA2.
(C) Quantification of pyramidal cell types around CA2, as examined in double immunostaining againsta-Actinin2/PCP4 (n = 6 sections from 3 rats) anda-Actinin2/
Wfs1 (n = 6 sections from 3 rats). Individual data points are shown, together with mean±SD.
(D) Intracellular recordings of CA2 pyramidal cells obtainedin vivofrom urethane anesthetized rats. Cells with thorny excrescences (open arrowheads) and lacking immunoreactivity for PCP4 ora-Actinin2 were classified as CA3 (green, n = 5). Cells positive to Wfs1 either CB+ or CB were classified as CA1 (blue, n = 9). Cells immunoreactive to PCP4 ora-Actinin2 without thorny excrescences were classified as CA2 cells (red, n = 10).
(E) Intrinsic properties of the different cell types plotted as a function of their distance to MF. Proximodistal gradients were confirmed by a Pearson correlation, as indicated. Intrinsic properties were measured at the resting membrane potential (RMP). Sag and firing rate were calculated in response to±0.3 nA current pulses.
AHP was calculated from the first spike in response to +0.2 nA.
(F) Immunohistochemical expression of Sox5 in a representative section of the rat dorsal hippocampus co-localized witha-Actinin2 (1 confocal section).
(G) Quantification of Sox5 expression per region (normalized by background at 0) along the proximodistal axis of CA3 to CA2 (n = 5 sections from 4 rats).
Significant one-way ANOVA, F(24) = 4.7, p = 0.008. Post hoc Tukey test, **p < 0.001. Error bars show mean±SD.
(H) Expression of Sox5 in CA2 cells as a function of the cell distance to MF (1 confocal section). A Pearson correlation R index was evaluated for proximal ( 250 to 0mm) and distal (0 to 250mm) sectors separately. *p < 0.05, **p < 0.001. One representative section is shown.
(I) Mean group data (±SD) of the Pearson correlation and mean normalized intensity for proximal and distal CA2 cells. Data from n = 7 sections from 4 rats. Paired Student’s (two-tailed) t tests, **p < 0.01, ***p < 0.0001.
See alsoFigure S2andTable S1.
PCP4+ cells (Figure 3G, arrowheads), resembling spatial LFP in- homogeneities.
Given the deep-superficial gradients reported in CA1 and CA2 (Oliva et al., 2016b; Valero et al., 2015), we looked for the distri- bution of modulatory strength as a function of the cell distance within SP. We found significant correlation with the deep-super- ficial position for gamma modulation of all cells together and within the PCP4+ group alone (superficial is at 0) (Figure 3H). A different modulatory index, looking for pairwise phase consis- tency (PPC) (Vinck et al., 2012), captured similar correlations (Figures S3A and S3B). Comparable effects were seen for the slow and fast gamma bands separately (Figure S3C). However, because of the typical expansion of the cell layer around CA2, the deep-superficial and proximodistal axes may interact. A generalized linear model (GLM) accounting for cell types and proximodistal and deep-superficial influences confirmed inter- actions (Table S2).
Cells recorded around CA2 exhibited phase-locked firing (z = 6.3, p = 0.0049, Rayleigh test) (Figure 3I). Significant prox- imodistal gradients of the preferred theta phase were confirmed with circular-linear statistics (R = 0.78, p < 0.0001, for all cells and R = 0.63, p = 0.0348, for CA2 cells alone) (Figure 3I). No sta- tistical effects were found as a function of deep-superficial loca- tion (Figure 3J). These results did not depend on proximodistal differences of LFP signals caused by penetrations of the silicon probe along CA2 to CA1 (no correlation with probe position;
Table S2).
Altogether, our data suggest CA2 firing is organized proximo- distally during theta oscillations. Considering the reversal profile of theta cycles around SP of CA1, our data suggest proximal PCP4+ pyramidal cells tend to fire along the falling phase, together with CA3 cells, while distal cells fire in phase with CA1 pyramidal cells near the theta trough (Figure 3K). Thus, firing from CA2 pyramidal cells consistently shifts in phase from proximal to distal. Complex mechanisms accounting for these functional effects could include local microcircuit factors and the influence of different theta generators (Figure 3L).
CA2 Pyramidal Cells May Couple to Different Proximodistal Theta Generators
We sought to evaluate the contribution of different mechanisms with additional analysis. We focused on n = 10 PCP4+ CA2 cells recorded intracellularly to avoid cell-type effects. We examined membrane oscillations at different holding potentials during theta recorded extracellularly (Figure 4A). Current source density (CSD) signals allowed identification of theta-associated local transmembrane sinks and sources (Figure 4A, color map) (STAR Methods). Theta current generators were localized at the stratum oriens (SO), stratum radiatum (SR), and SLM layers as described previously (Montgomery et al., 2009).
The frequency of intracellular theta oscillations was indepen- dent of the holding potential (Figure 4A), but the oscillatory power reached a minimum between 80 and 60 mV in different cells (Figure 4B, arrowhead). For a given cell, the intracellular theta power depicted a characteristic U-shaped curve with minimal power potential (Figure 4C). When plotted as a function of the cell position with respect to MF, the minimal power potential ex- hibited a significant proximodistal correlation for all PCP4+ cells
(no deep-superficial correlation, p = 0.79) (Figure 4D). This min- imal power potential reflects the equilibrium potential for mixed excitatory and inhibitory synaptic drives contributing to intracel- lular oscillations (Soltesz and Desch^enes, 1993) and suggests proximodistal trends of theta currents. At RMP, the phase of intracellular oscillatory peaks showed a significant proximodistal shift with respect to LFP (Figure 4E). Thus, CA2 pyramidal cells experienced different theta current drives along the proximodis- tal axis, with depolarizing peaks consistently shifting in phase from proximal (Figure 4Fa) to distal (Figure 4Fb).
To complement this analysis, we chose only those PCP4+
cells recorded simultaneously to CA2 extracellular LFPs (n = 5).
By evaluating coherence between intracellular membrane po- tential and local CSD signals, we aimed to quantify the influences of transmembrane currents at different strata during theta oscil- lations. We also included in this analysis one CA3 cell and one Wfs1+ CA1 pyramidal cell recorded simultaneously to LFP sig- nals from CA2 to control for cell-type-specific effects. To circum- vent issues arising from the complex hippocampal geometry, we limited the analysis to penetrations going through SO, SR, and SLM of distal CA2 (Figure 4A, inset). One PCP4+ cell was excluded due to the more proximal location of SLM penetration.
We found opposing proximodistal correlations between intra- cellular theta oscillations and CSD signals at SO and SR for all cells and for PCP4+ cells alone (Figure 4G), suggesting that transmembrane currents flowing though basal and apical den- drites contributed differently along the proximodistal axis. More- over, correlation between intracellular and local CSD signals at SLM was significant only for PCP4+ pyramidal cells (Figure 4G, bottom), consistent with their responsiveness to entorhinal in- puts (Srinivas et al., 2017; Sun et al., 2017).
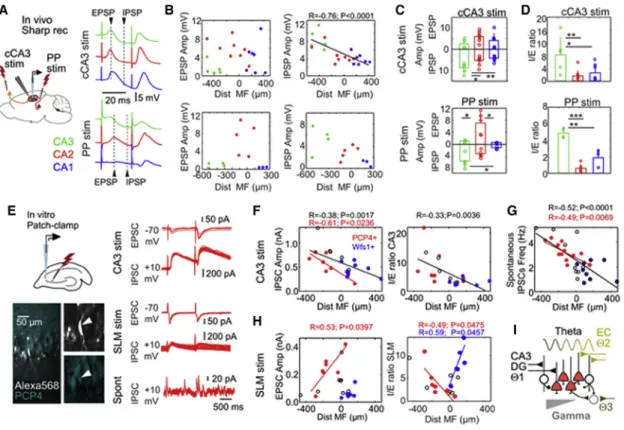
Different Proximodistal Influences of Intra- and Extra-hippocampal Inputs to CA2
Next, we examine microcircuit determinants of proximodistal gradients within CA2 with stimulation of input pathwaysin vivo (Figure 5A). Intracellular synaptic responses were evaluated at different latencies in current-clamp configuration for paired- pulse stimulation of the contralateral CA3 (n = 20 cells) and ipsi- lateral entorhinal inputs (n = 12 cells). Responses to electrical stimulation of entorhinal inputs were validated optogenetically (Figure S1B).
We found no proximodistal trends for the amplitude of excit- atory postsynaptic potentials (EPSPs) but found significant cor- relation for di-synaptic inhibitory postsynaptic potentials (IPSPs) in response to contralateral CA3 stimulation (Figure 5B, upper plots). For entorhinal inputs, we noted clear EPSP responses only in PCP4+ cells (Figure 5B, lower plots), consistent with our results on theta coherence and previous datain vitro(Srini- vas et al., 2017; Sun et al., 2017). Mean group responses per cell type reflected these differences (Figure 5C). An inhibitory/
excitatory (I/E) ratio confirmed cell-type differences (also for the excitatory/inhibitory [E/I] ratio, data not shown) (Figure 5D).
No effect was found for paired-pulse stimulation.
To exclude cell-type-specific effects and to examine synaptic currents more precisely, we performed voltage-clamp patch- clamp recordingsin vitro(Figure 5E, left) (STAR Methods). Cells in the vicinity of CA2 were recorded and filled with Alexa 568 for
Figure 3. Proximodistal Differences of Theta and Gamma Activity of CA2 Pyramidal Cells
(A) Intracellular recordings obtained simultaneously to multisite LFP signals allowed evaluation of oscillatory behavior of different cell types around CA2. Note the poor theta rhythmicity of spontaneous firing in a proximal PCP4+ CA2 cell but consistent phase-locking preference with theta cycles at SLM. Note also clear hyperpolarization during sharp-wave (SPW) ripples.
(B) Neurochemical classification of cells shown in (A) and (C).
(C) Single-cell and LFP recordings from head-restrained rats.
(D) Power spectrum of the intracellular membrane potential recorded during LFP theta in different cell types. Cells are ranked according to their proximodistal location within each group. Data from n = 5 CA3 cells (green), n = 10 CA2 cells (red), and n = 9 CA1 cells (blue).
(E) Individual single-cell data of theta and gamma power of membrane potential oscillations.
(F) Representative examples of single-cell autocorrelation and phase-locking firing to theta and gamma waves recorded at SLM. Cells are ranked according to their proximodistal location.
(G) Proximodistal distribution of the modulatory strength for theta and gamma for cells recorded under urethane (filled circles; 24 cells) and in drug-free conditions (open circles; 3 cells). The discontinuous line indicates the 95% confidence interval. Note the separate cluster of poorly modulated cells (arrowhead).
(H) Distribution of the modulatory strength as a function of the cell distance within SP (0 is the superficial limit).
(I) Theta phase firing preference of single cells measured against the SLM signal. The circular distribution significance is indicated.
(J) Theta phase firing preference of cells plotted as a function of their deep-superficial location.
(K) Phase firing preference of single cells represented against the CA1 SP signal (note the reversal of the theta wave along the CA1 layers).
(L) Potential mechanisms may include proximodistal and deep-superficial microcircuit organization and the influence of different theta generators.
See alsoFigure S3andTable S2.
neurochemical identification. Evoked excitatory postsynaptic currents (EPSCs) and inhibitory postsynaptic currents (IPSCs) were evaluated in response to CA3 and SLM stimulation (Fig- ure 5E, right). We confirmed similar population responses for electrical and optogenetic stimulation of SLM (Figure S1D). In a preliminary set of experiments, we noted a significant effect of recording duration and access resistance in immunoreactivity against PCP4+, presumably due to cell dialysis (Figure S4).
Thus, we reduced patching time to the minimum to gain in neuro- chemical characterization. Cells were tested first against PCP4 and subsequently for Wfs1. Cells without thorny excrescences and negative to both markers were left unclassified.
Consistent within vivodata, we found significant trends for the amplitude of IPSCs upon stimulation of CA3 for all cells and within PCP4+ cells alone (Figure 5F, no difference for EPSCs;
Figure S5A) (n = 7 PCP4+, n = 8 Wfs1+, n = 6 not-confirmed cells). The I/E ratio reflected similar global correlation with the cell distance to MF (Figure 5F, similar trends for E/I: R = 0.34, p = 0.0081;Figure S5C, left). The frequency of spontaneous IPSCs measured in all cells, but not that of EPSCs, exhibited sig- nificant proximodistal correlation (Figure 5G;Figure S5D).
In contrast, responses to entorhinal inputs at SLM were more complex. First, we found significant proximodistal trends for the EPSC amplitude only in PCP4+ cells (n = 7 PCP4+, n = 6 Wfs1+, n = 7 not-confirmed cells) (Figure 5H, left) and no differences for IPSCs (Figure S5B). Second, an I/E ratio showed opposing corre-
lations for PCP4+ CA2 and Wfs1+ CA1 pyramidal cells around the MF limit (Figure 5H, right, similar for the E/I ratio;Figure S5C, right).
We found no clear evidence of deep-superficial gradients in syn- aptic potentials along CA2 in response to either pathway (Fig- ure S6). Finally, we confirmed previous reports of cell-type-spe- cific responses to MF stimulation (Sun et al., 2017), with smaller EPSCs in PCP4+ CA2 cells compared with CA3a cells (Figure S7).
Thus, our data support different influences from input pathways along CA2. Accordingly, different intra-hippocampal (e.g., CA3) and extra-hippocampal (e.g., entorhinal cortex) theta current gen- erators (Buzsa´ki, 2002; Montgomery et al., 2009) may influence CA2 cells along the proximodistal axis (Figure 5I).
Proximodistal Differences of Oscillatory Activity and Spatial Coding of CA2 Cells
We reasoned that a proximodistal distribution of CA2 activity should be reflected in functional operations within this hippo- campal region. To investigate this point, we looked at data on large-scale simultaneous recordings of pyramidal cells from the CA3a, CA2, and proximal CA1 regions in rats during spatial navigation in a linear maze and subsequent sleep (Oliva et al., 2016a). We identified 6 rats with penetrations at different proxi- modistal locations along CA2 (Figure 6A). A total of 688 pyrami- dal cells were sorted (387 from rats 6, 7, and 8 at proximal loca- tions and 301 from rats 2, 4, and 5 at distal locations). Theta signals recorded from the CA1 SLM served as reference.
Figure 4. Influence of Different Proximodistal Theta Drives along CA2
(A) Intracellular membrane oscillations recorded at different holding potentials simultaneously to extracellular LFP signals in one PCP4+ pyramidal cell. CSD local sinks and sources are shown, together with LFPs (color map). Note attenuated theta oscillations around 70 mV in this cell, near the reversal potential of g-aminobutyric acid a (GABAa) receptors. LFP and CSD signals were recorded simultaneously to the 70 mV trace. The inset shows validation of probe penetration through the distal CA2 region.
(B) Power spectrum of membrane potential oscillations of traces shown in (A). Note the reduced theta power for a holding potential near 70 mV.
(C) Relationship between theta power of membrane potential oscillations and holding potential for the cell shown in A. A minimum theta power is estimated at 70 mV (arrowhead). The thick line shows the best polynomial fit.
(D) Significant gradients of minimal power potential along the proximodistal axis. Data from n = 10 PCP4+ CA2 cells.
(E) Phase relationship between the membrane oscillation peak at RMP and the proximodistal location of CA2 cells.
(F) Example of a proximal PCP4+ CA2 cell (a). Note the maximal depolarization and firing at the falling phase of theta recorded at SP. Example of a distal cell (b) with maximal depolarization and firing at the SP theta trough. In both cases, LFP signals were recorded from the distal CA2.
(G) Proximodistal distribution of theta coherence between membrane potential oscillations at RMP and the local CSD signal at SO, SR, and SLM from the distal CA2 region. Data from cells recorded simultaneously to CA2 extracellular LFP signals (n = 1 CA3, n = 5 CA2, n = 1 CA1). In one CA2 cell, the SLM CSD signal did not meet the inclusion criteria.
Consistent with data reported above, the preferred theta phase of CA2 pyramidal cells shifted along the proximodistal axis during both running (RUN) and rapid-eye-movement (REM) sleep (Fig- ure 6B) (data from each rat shown independently). A one-way ANOVA confirmed proximodistal trends across cell types (RUN:
F = 25.4, p < 0.0001; REM: F = 22.5, p < 0.0001) (Figure 6C).
No difference of theta modulation was detected around CA2 (Fig- ure 6D); however, neurons in CA3b and CA3c regions were found in an earlier study to be slightly more phase locked to theta (Oliva et al., 2016b). During RUN, we found stronger cross-correlations between firing from proximal CA2 and firing from CA3a pyramidal cells (p = 0.0111), whereas distal CA2 cells were better correlated with CA1p pyramidal cells (p = 0.0303) (Figure 6E). During REM
sleep, firing of proximal and distal CA2 pyramidal cells was differ- ently modulated by slow (30–60 Hz) and fast (60–90 Hz) gamma (Figure 6F). The proximodistal trend for the slow gamma band was consistent with data shown earlier under urethane. Finally, we also examined whether place coding properties distributed differently across the proximodistal axis in CA2. As reported earlier, spatially modulated CA2 pyramidal cells from the proximal and distal sectors may exhibit more than one place field (Fig- ure 6G). We found more spatially modulated cells with larger selectivity and carrying more information content per spike at distal than at proximal sectors (Figure 6H). Altogether, these data support different state-dependent oscillatory dynamics and place coding along the proximodistal axis in CA2.
Figure 5. Proximodistal Gradients of Synaptic Responses along CA2
(A) Intracellular responses to contralateral CA3 (cCA3) and PP stimulation were examinedin vivo. The amplitudes of evoked EPSPs and IPSPs were evaluated at different latencies from stimulation (arrowheads). Cell types are identified by colors.
(B) Synaptic responses to cCA3 stimulation (n = 20 cells) and PP stimulation (n = 12 cells). Data are plotted as a function of the cell distance to MF.
(C) Mean group responses (±SD) and individual data per cell type. Because of their location, cell-type differences reflect a proximodistal gradient along CA2. cCA3 stimulation: EPSP is non-significant; IPSP F(19) = 9.1, p = 0.011, one-way ANOVA; *p < 0.05, **p < 0.005, post hoc Tukey test. PP stimulation: EPSP F(11) = 8.9, p = 0.007; IPSP F(11) = 6.1, p = 0.021; *p < 0.05, post hoc Tukey test.
(D) I/E ratio of different cell types. cCA3 stimulation: F(19) = 6.5, p = 0.008, one-way ANOVA; *p < 0.05, **p < 0.005, post hoc Tukey test. PP simulation:
F(11) = 41.1, p < 0.0001; **p < 0.005, ***p < 0.0001, post hoc Tukey test.
(E)In vitrorecordings were obtained to evaluate synaptic currents in response to CA3 or SLM stimulation. Cells were filled with Alexa 568 for posterior identi- fication. Evoked excitatory postsynaptic currents (EPSCs) and inhibitory postsynaptic currents (IPSCs) from the PCP+ pyramidal cell are shown.
(F) Synaptic currents evoked by CA3 stimulation. Wfs1+ CA1 cells (n = 8) and PCP4+ CA2 cells (n = 7) are shown in blue and red, respectively. Cells not confirmed neurochemically are indicated in black (n = 6). Significant proximodistal trend for IPSC and the I/E ratio are indicated.
(G) Spontaneous IPSC frequency from n = 12 PCP4+, n = 9 Wfs1+, and n = 9 not confirmed.
(H) Synaptic currents evoked by stimulation of entorhinal inputs at SLM (n = 7 PCP4+ CA2 cells, n = 6 Wfs1+ CA1 cells, n = 7 not-confirmed cells).
(I) Schematic representation of a proximodistal microcircuit organization of CA2. Intra-hippocampal (CA3 and dentate gyrus [DG]) and extra-hippocampal input pathways (entorhinal cortex [EC] and possibly septum or the supramammillary nucleus) relay different theta current generators at different layers along the proximodistal axis of CA2. Local GABAergic inputs also exhibit a proximodistal distribution, consistent with gamma oscillations.
See alsoFigures S4–S7.
DISCUSSION
Our data suggest that within CA2, opposite influences from different input pathways and local gradients of the E/I ratio shape neuronal firing. Intra-hippocampal inputs from CA3 (and dentate gyrus [DG]) converge proximally to modulate CA2 pyramidal cell
firing in phase with CA3a cells during theta oscillations. In contrast, at distal sectors, extra-hippocampal activity operates maximally at SO and SLM to shift CA2 pyramidal cell firing to- ward CA1. Proximodistal effects on CA2 oscillatory activity oper- ate differently across states (awake, REM sleep, and urethane).
The depth of theta modulation increases toward distal CA2 Figure 6. Proximodistal Organization of CA2 Activity in Time and Space
(A) High-density multisite silicon probes (256 channels) allowed simultaneous recordings of CA3, CA2, and CA1 unit activity from 6 rats running (RUN) in a linear maze and subsequently sleeping (REM) (Oliva et al., 2016a).
(B) Mean theta phase modulation from pyramidal cells from the 6 rats organized from proximal to distal penetrations through CA2. A total of 688 CA2 pyramidal cells were isolated: 87 from rat 2, 126 from rat 4, 88 from rat 5, 65 from rat 6, 188 from rat 7, and 134 from rat 8. The reference for theta cycles was taken at SLM of CA1, with the theta peak at zero. Data from RUN and REM episodes are shown separately.
(C) Proximodistal group difference of the preferred theta phase for RUN (F = 25.4, p < 0.0001) and REM (F = 22.5, p < 0.0001). Note the statistical differences for proximal and distal CA2. Data are from 262 pyramidal cells in CA3a, 387 pyramidal cells in proximal CA2, 301 pyramidal cells in distal CA2, and 389 pyramidal cells in proximal CA1. *p < 0.05 from post hoc t test.
(D) No statistical effects were found between groups in the strength of theta modulation.
(E) Cross-correlation between pyramidal cells from proximal and distal CA2 with CA3 and with CA1. Proximal CA2 neuronal firing is more correlated with CA3 firing, whereas distal CA2 cells tend to better correlate with CA1, especially during RUN periods. Data are shown as mean±SEM.
(F) Proximodistal differences of slow and fast gamma modulation.
(G) Representative examples of CA2 place cells recorded from the proximal and distal sectors.
(H) Proximodistal differences of spatial coding properties of CA2 place cells.
under urethane, while slow and fast gamma influences are differ- entially modulated during REM sleep. CA2 place cells exhibited different selectivity along the proximodistal axis. Therefore, the CA2 output dissociates proximodistally in the dorsal hippo- campus of the rat.
The transverse axis is central to hippocampal function. Initially identified in single CA3 pyramidal cells projecting to CA1 (Ishizuka et al., 1990; Li et al., 1994), a proximodistal topography quickly emerged as a major organizational principle of intra-hip- pocampal connectivity (Witter et al., 2000). Proximal CA3c cells (near DG) project distally to CA1, whereas distal CA3a project proximally. Analogous connectivity was identified for the CA1 projections to subiculum, where strong proximodistal gradients support functional dissociation (Amaral and Witter, 1989; Cem- browski et al., 2018). The medial and lateral entorhinal inputs separate proximodistally in CA1 (Witter et al., 2000), and this is reflected in the organization of place fields (sharper at proximal CA1 and unspecific at distal CA1) (Henriksen et al., 2010). Similar functional segregation is present at CA3 (Lu et al., 2015). Given differences in recurrent connectivity (Ishizuka et al., 1990; Li et al., 1994), the ability of the CA3 network to separate patterns degrades toward CA3a, where more recurrent collaterals favor pattern completion (Lee et al., 2015).
Using PCP4, a-Actinin2, and Wfs1 as cell-type-specific markers, we found sharply organized variations of cellular composition around the CA2 transitional region. CA3a and CA1 pyramidal cells interspersed distinctly in CA2 at the proximal and distal sectors. Yet they all retain their different input prefer- ences with intra- and extra-hippocampal inputs. The transcrip- tion factor Sox5 showed a marked proximodistal expression from CA3 to CA2, consistent with transcriptomic variability among hippocampal cell types (Cembrowski et al., 2016). How- ever, Sox5 also reflects proximodistal variabilities within CA2 py- ramidal cells, with distal cells expressing lower levels of Sox5 compared with proximal cells and a sharp inflection gradient at the point where MFs terminate. This is consistent with the idea of distinct functionalities emerging from graded genetic varia- tions (Cembrowski and Menon, 2018) and supports molecular heterogeneity within CA2. Sox5 is not likely to characterize CA2 cells specifically; rather, it appears to correlate with the functional organization around the MF border. Inter-species dif- ferences of CA2 may arise around this border as noted previ- ously (Dudek et al., 2016).
Our electrophysiological data reveal that different proximo- distal microcircuits determine functional properties within CA2 pyramidal cells as well. Distal CA2 cells receive stronger ento- rhinal inputs and lower di-synaptic inhibition in response to both CA3 and PP stimulation. We found that during sponta- neous theta activity, the peak and reversal of membrane poten- tial oscillations shifted in phase, consistent with different phase-locking preferences at proximal and distal sectors.
Other report also noted different theta modulation in pyramidal cells recorded around CA2 in mouse, but neurochemical confir- mation was not available (Matsumoto et al., 2016). Three inde- pendent analyses provided additional support to this functional distribution along the transverse axis. First, somatic membrane potential oscillations were more influenced by SLM and SO theta currents in distal CA2 cells, whereas proximal cells
followed SR currents. Given the known layered organization of entorhinal, septal, and supramammillary inputs at SLM and SO (Joshi et al., 2017; Soussi et al., 2010), our data suggest distal CA2 cells may be more biased toward extra-hippocampal theta generators, while proximal CA2 cells may follow intra-hip- pocampal influences (Buzsa´ki, 2002; Montgomery et al., 2009).
Proximodistal differences of I/E balance and distinctive plas- ticity properties of different pathways may further contribute (Dasgupta et al., 2017; Leroy et al., 2017; Nasrallah et al., 2017; Piskorowski and Chevaleyre, 2013; Sun et al., 2017).
A second observation reinforced the idea of a proximodistal distribution of CA2 function. Gamma activity, particularly slow gamma (30–60 Hz), interfered largely with theta in proximal cells, as confirmed in both subthreshold membrane potential oscillations and neuronal firing. A confounding deep-superficial trend interacted with proximodistal variations of feedforward in- hibition, possibly reflecting diverse interneuronal connectivity (Botcher et al., 2014; Mercer et al., 2012a, 2012b). These data do not contradict previous findings of strong inhibition around CA2 (Chevaleyre and Siegelbaum, 2010; Piskorowski and Che- valeyre, 2013; Valero et al., 2015); they just support a proximo- distal organization along the transverse axis, consistent with other reports (Sun et al., 2017). Axons from bistratified CA2 inter- neurons are shown to arborize distally, while SP-SR interneurons innervate locally in proximal CA2 and CA3a (Mercer et al., 2012a, 2012b). All these complex interactions along the transverse axis, together with volume-conduction effects, may contribute to characteristic LFPs around CA2. While the gamma power measured at SP consistently decreased, theta power exhibited a strong in-homogeneity at the point where MF terminates. In addition, parallel extracellular dipoles from interspersed CA3a and CA1 pyramidal cells will contribute distinctly to LFP signals.
Possibly, MF inputs recruiting preferentially CA3 versus CA2 cells (Kohara et al., 2014; Sun et al., 2017) and SLM inputs doing the opposite (Srinivas et al., 2017) will reinforce geometrical asymmetries in the area. Ripples preceding the local sharp- wave peak in proximal locations strengthen the idea of complex local LFPs explained by microcircuit mechanisms (Oliva et al., 2016b; Valero et al., 2015).
Finally, large-scale recording of pyramidal cells with high-den- sity silicon probes confirmed relevant proximodistal trends within CA2 in rats RUN in a linear maze and during subsequent REM sleep. In this independent dataset (Oliva et al., 2016a, 2016b), we found distribution similar to that in urethane for the preferred theta phase in the proximal and distal CA2 region dur- ing RUN and REM sleep. These gamma modulatory influences segregated during sleep, with proximal CA2 cells experiencing stronger modulation by slow gamma and distal CA2 cells exhib- iting stronger influences by fast gamma. Given the pathway de- pendency of slow and fast theta-gamma coupling, this suggests different control of spike timing of proximal and distal CA2 cells by CA3a and entorhinal inputs (Ferna´ndez-Ruiz et al., 2017). The opposite trends of firing cross-correlation between proximal and distal CA2 cells with CA3a and CA1p, together with the more spatial selectivity of distal CA2 cells, support this view.
Spatial and non-spatial memories, as well as the ability for pattern separation, segregate along the transverse CA3-CA2 axis (Hunsaker et al., 2008; Lee et al., 2015; Nakamura et al.,
2013). Place field similarity between contexts changes abruptly 200–250 mm from the CA2 border (Lu et al., 2015). This fits perfectly with the proximal CA2 region, where PCP4+ cells fire in phase with CA3a. At this border, oxytocin receptor signaling plays a role in discriminating social stimuli (Raam et al., 2017).
Given recurrent interactions between CA3a and CA2 pyramidal cells (Li et al., 1994; Wittner and Miles, 2007), a proximodistal integration of social and contextual information may be respon- sible for more flexible representations (DeVito et al., 2009;
Pagani et al., 2015; Raam et al., 2017; Wintzer et al., 2014). In contrast, distal CA2 cells fired in phase with proximal CA1 pyra- midal neurons and a lower I/E balance suggest different compu- tational operations compared with the proximal sector (Guzman et al., 2016; Sun et al., 2017). Our findings that distal CA2 cells are more driven by entorhinal inputs and have stronger fast gamma modulation than proximal cells suggest the circuit can accommodate additional functionalities (Jones and McHugh, 2011; Valero and de la Prida, 2018). Social contexts can modify spatial fields in CA2 (Alexander et al., 2016), possibly due to cell- type-specific interactions (Kohara et al., 2014; Okuyama et al., 2016).
In summary, we propose that CA2 operates along the proxi- modistal axis, similar to other hippocampal regions, and that this segregation is critical to better understanding its functional role.
STAR+METHODS
Detailed methods are provided in the online version of this paper and include the following:
d KEY RESOURCES TABLE
d CONTACT FOR REAGENT AND RESOURCE SHARING
d EXPERIMENTAL MODEL AND SUBJECT DETAILS
d METHOD DETAILS
B Juxtacellular and LFP recordings in head-fixed rats B Intracellular and LFP recordings under urethane B In vitroelectrophysiology
B Tissue processing and inmunohistochemistry B Analysis of Sox5 expression
B Optogenetics
B Analysis of LFP signals
B Analysis of intracellular recordings B Analysis of juxtacellularly labeled cells
B Analysis of large-scale recordings of pyramidal cells during RUN and sleep
d QUANTIFICATION AND STATISTICAL ANALYSIS
d DATA AND SOFTWARE AVAILABILITY
SUPPLEMENTAL INFORMATION
Supplemental Information includes seven figures and two tables and can be found with this article online athttps://doi.org/10.1016/j.celrep.2019.01.060.
ACKNOWLEDGMENTS
This work was supported by grants from the Spanish Ministerio de Economı´a y Competitividad (BFU2015-66887-R to L.M.d.l.P. and SAF2017-85717-R to A.V.M.), the Fundacio´n Tatiana Perez de Guzman el Bueno (to L.M.d.l.P.), an
ERC starting grant, and the Momentum II grant of the Hungarian Academy of Sciences and the Ministry of Human Capacities, Hungary (20391-3/2018/
FEKUSTRAT to A.B.). D.G.-D. and M.V. were supported by PhD fellowships from the Spanish Ministry of Economy (BES-2013-064171) and from the Min- istry of Education, Culture and Sports (FPU12/03776), respectively. A.O. is supported by an EMBO fellowship. We thank Gyo¨rgy Buzsa´ki and Antonio- Ferna´ndez Ruiz for their generous support and suggestions. We also thank the Karl Deisseroth lab for sharing optogenetic constructs, Ledia H. Hernandez for helping with optogenetics, and Ester Lara and Lingling Li for technical sup- port. VGAT-Venus transgenic rats were generated by Drs. Y. Yanagawa, M.
Hirabayashi, and Y. Kawaguchi at the National Institute for Physiological Sci- ences (Okazaki, Japan) using pCS2-Venus provided by Dr. A. Miyawaki. VGAT line progenitors were provided by the National Bioresource Project Rat (Kyoto, Japan).
AUTHOR CONTRIBUTIONS
L.M.d.l.P. designed the study. I.F.-L., A.S.-A., E.C., M.V., A.O., A.B., and A.V.M. obtained data. D.G.-D., I.F.-L., A.S.-A., M.V., E.C., A.O., A.V.M., and L.M.d.l.P. analyzed and interpreted the data. L.M.d.l.P. wrote the paper.
DECLARATION OF INTERESTS The authors declare no competing interests.
Received: May 15, 2018 Revised: October 25, 2018 Accepted: January 15, 2019 Published: February 12, 2019 REFERENCES
Alexander, G.M., Farris, S., Pirone, J.R., Zheng, C., Colgin, L.L., and Dudek, S.M. (2016). Social and novel contexts modify hippocampal CA2 representa- tions of space. Nat. Commun.7, 10300.
Amaral, D.G., and Witter, M.P. (1989). The three-dimensional organization of the hippocampal formation: a review of anatomical data. Neuroscience31, 571–591.
Boehringer, R., Polygalov, D., Huang, A.J.Y., Middleton, S.J., Robert, V., Wint- zer, M.E., Piskorowski, R.A., Chevaleyre, V., and McHugh, T.J. (2017). Chronic loss of CA2 transmission leads to hippocampal hyperexcitability. Neuron94, 642–655.
Botcher, N.A., Falck, J.E., Thomson, A.M., and Mercer, A. (2014). Distribution of interneurons in the CA2 region of the rat hippocampus. Front. Neuroanat.8, 104.
Buzsa´ki, G. (2002). Theta oscillations in the hippocampus. Neuron 33, 325–340.
Caldwell, H.K., Wersinger, S.R., and Young, W.S., 3rd. (2008). The role of the vasopressin 1b receptor in aggression and other social behaviours. Prog.
Brain Res.170, 65–72.
Cembrowski, M.S., and Menon, V. (2018). Continuous variation within cell types of the nervous system. Trends Neurosci.41, 337–348.
Cembrowski, M.S., Wang, L., Sugino, K., Shields, B.C., and Spruston, N.
(2016). Hipposeq: a comprehensive RNA-seq database of gene expression in hippocampal principal neurons. eLife5, e14997.
Cembrowski, M.S., Phillips, M.G., DiLisio, S.F., Shields, B.C., Winnubst, J., Chandrashekar, J., Bas, E., and Spruston, N. (2018). Dissociable structural and functional hippocampal outputs via distinct subiculum cell classes. Cell 173, 1280–1292.
Chevaleyre, V., and Siegelbaum, S.A. (2010). Strong CA2 pyramidal neuron synapses define a powerful disynaptic cortico-hippocampal loop. Neuron 66, 560–572.
Cui, Z., Gerfen, C.R., and Young, W.S., 3rd. (2013). Hypothalamic and other connections with dorsal CA2 area of the mouse hippocampus.
J. Comp. Neurol.521, 1844–1866.
Dasgupta, A., Baby, N., Krishna, K., Hakim, M., Wong, Y.P., Behnisch, T., Soong, T.W., and Sajikumar, S. (2017). Substance P induces plasticity and synaptic tagging/capture in rat hippocampal area CA2. Proc. Natl. Acad.
Sci. USA114, E8741–E8749.
DeVito, L.M., Konigsberg, R., Lykken, C., Sauvage, M., Young, W.S., 3rd, and Eichenbaum, H. (2009). Vasopressin 1b receptor knock-out impairs memory for temporal order. J. Neurosci.29, 2676–2683.
Dudek, S.M., Alexander, G.M., and Farris, S. (2016). Rediscovering area CA2:
unique properties and functions. Nat. Rev. Neurosci.17, 89–102.
Ferna´ndez-Ruiz, A., Oliva, A., Nagy, G.A., Maurer, A.P., Bere´nyi, A., and Buzsa´ki, G. (2017). Entorhinal-CA3 dual-input control of spike timing in the hip- pocampus by theta-gamma coupling. Neuron93, 1213–1226.
Guzman, S.J., Schlo¨gl, A., Frotscher, M., and Jonas, P. (2016). Synaptic mech- anisms of pattern completion in the hippocampal CA3 network. Science353, 1117–1123.
Henriksen, E.J., Colgin, L.L., Barnes, C.A., Witter, M.P., Moser, M.B., and Moser, E.I. (2010). Spatial representation along the proximodistal axis of CA1. Neuron68, 127–137.
Hitti, F.L., and Siegelbaum, S.A. (2014). The hippocampal CA2 region is essen- tial for social memory. Nature508, 88–92.
Hunsaker, M.R., Rosenberg, J.S., and Kesner, R.P. (2008). The role of the den- tate gyrus, CA3a,b, and CA3c for detecting spatial and environmental novelty.
Hippocampus18, 1064–1073.
Ishizuka, N., Weber, J., and Amaral, D.G. (1990). Organization of intrahippo- campal projections originating from CA3 pyramidal cells in the rat. J. Comp.
Neurol.295, 580–623.
Jones, M.W., and McHugh, T.J. (2011). Updating hippocampal representa- tions: CA2 joins the circuit. Trends Neurosci.34, 526–535.
Joshi, A., Salib, M., Viney, T.J., Dupret, D., and Somogyi, P. (2017). Behavior- dependent activity and synaptic organization of septo-hippocampal GABAergic neurons selectively targeting the hippocampal CA3 area. Neuron96, 1342–
1357.e5.
Julious, S.A., and Mullee, M.A. (1994). Confounding and Simpson’s paradox.
BMJ309, 1480–1481.
Kay, K., Sosa, M., Chung, J.E., Karlsson, M.P., Larkin, M.C., and Frank, L.M.
(2016). A hippocampal network for spatial coding during immobility and sleep.
Nature531, 185–190.
Kohara, K., Pignatelli, M., Rivest, A.J., Jung, H.-Y., Kitamura, T., Suh, J., Frank, D., Kajikawa, K., Mise, N., Obata, Y., et al. (2014). Cell type-specific genetic and optogenetic tools reveal hippocampal CA2 circuits. Nat. Neurosci.17, 269–279.
Lee, H., Wang, C., Deshmukh, S.S., and Knierim, J.J. (2015). Neural population evidence of functional heterogeneity along the CA3 transverse axis: pattern completion versus pattern separation. Neuron87, 1093–1105.
Leroy, F., Brann, D.H., Meira, T., and Siegelbaum, S.A. (2017). Input-timing- dependent plasticity in the hippocampal CA2 region and its potential role in so- cial memory. Neuron95, 1089–1102.
Li, X.-G., Somogyi, P., Ylinen, A., and Buzsa´ki, G. (1994). The hippocampal CA3 network: anin vivointracellular labeling study. J. Comp. Neurol.339, 181–208.
Lu, L., Igarashi, K.M., Witter, M.P., Moser, E.I., and Moser, M.B. (2015). Topog- raphy of place maps along the CA3-to-CA2 axis of the hippocampus. Neuron 87, 1078–1092.
Mankin, E.A., Diehl, G.W., Sparks, F.T., Leutgeb, S., and Leutgeb, J.K. (2015).
Hippocampal CA2 activity patterns change over time to a larger extent than between spatial contexts. Neuron85, 190–201.
Matsumoto, N., Okamoto, K., Takagi, Y., and Ikegaya, Y. (2016). 3-Hz sub- threshold oscillations of CA2 neuronsin vivo. Hippocampus26, 1570–1578.
Mercer, A., Eastlake, K., Trigg, H.L., and Thomson, A.M. (2012a). Local circuitry involving parvalbumin-positive basket cells in the CA2 region of the hippocampus. Hippocampus22, 43–56.
Mercer, A., Botcher, N.A., Eastlake, K., and Thomson, A.M. (2012b). SP-SR in- terneurones: a novel class of neurones of the CA2 region of the hippocampus.
Hippocampus22, 1758–1769.
Montgomery, S.M., Betancur, M.I., and Buzsa´ki, G. (2009). Behavior-depen- dent coordination of multiple theta dipoles in the hippocampus. J. Neurosci.
29, 1381–1394.
Nakamura, N.H., Flasbeck, V., Maingret, N., Kitsukawa, T., and Sauvage, M.M.
(2013). Proximodistal segregation of nonspatial information in CA3: preferen- tial recruitment of a proximal CA3-distal CA1 network in nonspatial recognition memory. J. Neurosci.33, 11506–11514.
Nasrallah, K., Piskorowski, R.A., and Chevaleyre, V. (2017). Bi-directional interplay between proximal and distal inputs to CA2 pyramidal neurons. Neu- robiol. Learn. Mem.138, 173–181.
Okuyama, T., Kitamura, T., Roy, D.S., Itohara, S., and Tonegawa, S. (2016).
Ventral CA1 neurons store social memory. Science353, 1536–1541.
Oliva, A., Ferna´ndez-Ruiz, A., Buzsa´ki, G., and Bere´nyi, A. (2016a). Spatial coding and physiological properties of hippocampal neurons in the cornu ammonis subregions. Hippocampus26, 1593–1607.
Oliva, A., Ferna´ndez-Ruiz, A., Buzsa´ki, G., and Bere´nyi, A. (2016b). Role of hippocampal CA2 region in triggering sharp-wave ripples. Neuron91, 1342–
1355.
Pagani, J.H., Zhao, M., Cui, Z., Avram, S.K., Caruana, D.A., Dudek, S.M., and Young, W.S. (2015). Role of the vasopressin 1b receptor in rodent aggressive behavior and synaptic plasticity in hippocampal area CA2. Mol. Psychiatry20, 490–499.
Pedersen, N.P., Ferrari, L., Venner, A., Wang, J.L., Abbott, S.B.G., Vujovic, N., Arrigoni, E., Saper, C.B., and Fuller, P.M. (2017). Supramammillary glutamate neurons are a key node of the arousal system. Nat. Commun.
8, 1405.
Piskorowski, R.A., and Chevaleyre, V. (2013). Delta-opioid receptors mediate unique plasticity onto parvalbumin-expressing interneurons in area CA2 of the hippocampus. J. Neurosci.33, 14567–14578.
Quiroga, A.C., Stolt, C.C., Diez del Corral, R., Dimitrov, S., Pe´rez-Alcala´, S., Sock, E., Barbas, J.A., Wegner, M., and Morales, A.V. (2015). Sox5 controls dorsal progenitor and interneuron specification in the spinal cord. Dev. Neuro- biol.75, 522–538.
Raam, T., McAvoy, K.M., Besnard, A., Veenema, A.H., and Sahay, A. (2017).
Hippocampal oxytocin receptors are necessary for discrimination of social stimuli. Nat. Commun.8, 2001.
Rowland, D.C., Weible, A.P., Wickersham, I.R., Wu, H., Mayford, M., Witter, M.P., and Kentros, C.G. (2013). Transgenically targeted rabies virus demon- strates a major monosynaptic projection from hippocampal area CA2 to medial entorhinal layer II neurons. J. Neurosci.33, 14889–14898.
San Antonio, A., Liban, K., Ikrar, T., Tsyganovskiy, E., and Xu, X. (2014).
Distinct physiological and developmental properties of hippocampal CA2 sub- field revealed by using anti-Purkinje cell protein 4 (PCP4) immunostaining.
J. Comp. Neurol.522, 1333–1354.
Smith, A.S., Williams Avram, S.K., Cymerblit-Sabba, A., Song, J., and Young, W.S. (2016). Targeted activation of the hippocampal CA2 area strongly en- hances social memory. Mol. Psychiatry21, 1137–1144.
Soltesz, I., and Desch^enes, M. (1993). Low- and high-frequency membrane potential oscillations during theta activity in CA1 and CA3 pyramidal neurons of the rat hippocampus under ketamine-xylazine anesthesia. J. Neurophysiol.
70, 97–116.
Soussi, R., Zhang, N., Tahtakran, S., Houser, C.R., and Esclapez, M. (2010).
Heterogeneity of the supramammillary-hippocampal pathways: evidence for a unique GABAergic neurotransmitter phenotype and regional differences.
Eur. J. Neurosci.32, 771–785.
Srinivas, K.V., Buss, E.W., Sun, Q., Santoro, B., Takahashi, H., Nicholson, D.A., and Siegelbaum, S.A. (2017). The dendrites of CA2 and CA1 pyramidal neurons differentially regulate information flow in the cortico-hippocampal cir- cuit. J. Neurosci.37, 3276–3293.
Sun, Q., Sotayo, A., Cazzulino, A.S., Snyder, A.M., Denny, C.A., and Siegel- baum, S.A. (2017). Proximodistal heterogeneity of hippocampal CA3 pyrami- dal neuron intrinsic properties, connectivity, and reactivation during memory recall. Neuron95, 656–672.
Uematsu, M., Hirai, Y., Karube, F., Ebihara, S., Kato, M., Abe, K., Obata, K., Yoshida, S., Hirabayashi, M., Yanagawa, Y., and Kawaguchi, Y. (2008). Quan- titative chemical composition of cortical GABAergic neurons revealed in trans- genic venus-expressing rats. Cereb. Cortex18, 315–330.
Valero, M., and de la Prida, L.M. (2018). The hippocampus in depth: a sublayer- specific perspective of entorhinal-hippocampal function. Curr. Opin. Neuro- biol.52, 107–114.
Valero, M., Cid, E., Averkin, R.G., Aguilar, J., Sanchez-Aguilera, A., Viney, T.J., Gomez-Dominguez, D., Bellistri, E., and de la Prida, L.M. (2015). Determinants
of different deep and superficial CA1 pyramidal cell dynamics during sharp- wave ripples. Nat. Neurosci.18, 1281–1290.
Vinck, M., Battaglia, F.P., Womelsdorf, T., and Pennartz, C. (2012). Improved measures of phase-coupling between spikes and the local field potential.
J. Comput. Neurosci.33, 53–75.
Wintzer, M.E., Boehringer, R., Polygalov, D., and McHugh, T.J. (2014). The hip- pocampal CA2 ensemble is sensitive to contextual change. J. Neurosci.34, 3056–3066.
Witter, M.P., Wouterlood, F.G., Naber, P.A., and Van Haeften, T. (2000).
Anatomical organization of the parahippocampal-hippocampal network.
Ann. N Y Acad. Sci.911, 1–24.
Wittner, L., and Miles, R. (2007). Factors defining a pacemaker region for syn- chrony in the hippocampus. J. Physiol.584, 867–883.
STAR + METHODS
KEY RESOURCES TABLE
CONTACT FOR REAGENT AND RESOURCE SHARING
Further information and requests for reagents and resources should be directed to and will be fulfilled by the Lead Contact, Dr. Liset M. de la Prida (lmprida@cajal.csic.es).
REAGENT or RESOURCE SOURCE IDENTIFIER
Antibodies
Rabbit anti-calbindin D-28k Swant Swant CB-38; RRID:AB_10000340
Mouse anti-calbindin D-28k Swant Swant 300; RRID:AB_10000347
Mouse anti-NeuN Millipore Cat# MAB377; RRID:AB_2298772
Rabbit anti-Wfs1 Proteintech Cat# 11558-1-AP; RRID:AB_2216046
Mouse Anti-a-Actinin2 Sigma Cat#: A-7811; RRID: AB_476766
Rabbit anti-PCP4 Sigma Cat#: HPA5792; RRID: AB_1855086
Mouse anti-Sox5 In house (Figures S2C and S2D) N/A
Goat anti-rabbit Alexa Fluor633 IgG Invitrogen Cat# A21070;RRID:AB_2535731
Goat anti-mouse Rhodamine Red IgG Jackson Immunoresearch Cat# 115-295-003; RRID:AB_2338756 Alexa Fluor488-conjugated streptavidin Jackson Immunoresearch Cat# 016-540-084; RRID:AB_2337249 Bacterial and Virus Strains
AAV5-CaMKIIa-hChR2(H134)-EYFP University of North Caroline (UNC Vector Core)
N/A
Chemicals, Peptides, and Recombinant Proteins
Bisbenzimide H33258 Sigma-Aldrich Cat# B2883; CAS: 23491-45-4
Neurobiotin tracer Vector Labs Cat# SP-1120
Experimental Models: Organisms/Strains
Rat: Wistar Instituto Cajal Animal facility N/A
Rat: VGAT-VenusA National Bioresource Project Japan.
University of Kyoto
Cat#: 0554
Mouse: C57BL/6 Instituto Cajal Animal facility N/A
Software and Algorithms
MATLAB 2016b Mathworks https://www.mathworks.com
Ethovision v1.90 Noldus http://www.noldus.com/animal-behavior-
research/
ImageJ NIH Image https://imagej.net/ImageJ
Recording software Molecular devices ClampFit
MiniAnalysis Software v5 Synaptosoft http://www.synaptosoft.com/MiniAnalysis/
NeuroExplorer v4.135 Nex Technologies http://www.neuroexplorer.com/
Other
Silicon probes: 16-channel linear; 100mm inter-spacing; 413mm2 electrode area
Neuronexus A1x16-5mm-100-413
Silicon probes: 32-channel 2x16 linear;
100mm inter-spacing; 413mm2 electrode area; 200mm inter-shank
Neuronexus A2x16-10mm-200-413
Silicon probes: Prida 16ch-comb; 413mm2 electrode area; 100mm inter-shank
Neuronexus A16x1-5mm-100-413
Tapered optic fibers Optogenix Lambda-B