Investigation of Glutamatergic Synaptic Transmission in Hippocampal Pyramidal Cells
Ph.D. thesis
Éltes Tímea M.D.
János Szentágothai Doctoral School of Neurosciences Semmelweis University
Supervisor: Zoltán Nusser, DVM, D.Sc.
Official reviewers: Zelles Tibor, Ph.D.
Mátyás Ferenc, Ph.D.
Head of the Final Examination Committee: Ligeti Erzsébet, D.Sc.
Members of the Final Examination Committee:
Wittner Lucia, Ph.D.
Köles László, Ph.D.
Budapest
2019
1 TABLE OF CONTENTS
1. ABBREVIATIONS ... 4
2. INTRODUCTION ... 6
2.1. Glutamatergic synaptic transmission in the central nervous system ... 6
2.2. The hippocampus ... 7
2.2.1. The intrinsic organization of the hippocampus ... 8
2.2.2. The hippocampal circuit ... 10
2.3. Glutamatergic synaptic transmission ... 12
2.3.1. Anatomical and molecular structure of the synapse ... 12
2.3.2. Synaptic release ... 14
2.4. Diversity of synaptic properties ... 17
2.4.1. Postsynaptic target cell type-dependent differences in synaptic properties ... 18
2.5. Diverse synaptic properties shaping network activity and behavior ... 20
2.6. Limitations of methods exploring synaptic transmission in vivo ... 21
2.6.1 In vivo electrophysiological recordings ... 22
2.6.2. In vivo optical recordings ... 22
2.6.3. Inference of spiking activity from fluorescence transients ... 24
3. OBJECTIVES ... 27
4. MATERIALS AND METHODS ... 30
4.1. Animal Care ... 30
4.2. PART I: Investigation of the mechanism of target cell-type dependent differences in neurotransmitter release probability... 30
4.2.1. Slice preparation and electrophysiological recordings of CA3 PCs and INs ... 30
4.2.2. In vitro two-photon [Ca2+] imaging of CA3 PC axon terminals ... 31
4.2.3. Identification of the postsynaptic target of the imaged boutons ... 33
4.3. PART II. Investigation of variability in GCaMP6f Ca2+ transients, its relationship with GCaMP6f expression level and their impact on spike inference accuracy ... 34
4.3.1. Stereotaxic viral delivery of GCaMP6f to the CA1 region of the hippocampus ... 34
4.3.2. Imaging window implant for in vivo [Ca2+] imaging ... 34
4.3.3. In vivo two-photon [Ca2+] imaging and data analysis ... 35
2
4.3.4. Slice preparation for electrophysiological recordings in CA1 hippocampal region from
adult mice ... 35
4.3.5. In vitro two-photon [Ca2+] imaging of somatic GCaMP6f signals and data analysis ... 36
4.3.6. Tissue processing for post hoc identification of the imaged GCaMP6f expressing cells 38 4.3.7. Immunohistochemistry and quantification of nativeGCaMP6f and anti-GFP intensities38 4.3.8. Simulations ... 39
4.4. Statistical analysis... 41
5. RESULTS ... 42
5.1. PART I. Target cell type-dependent differences in Ca2+ channel function underlie distinct release probabilities at hippocampal glutamatergic terminals ... 42
5.1.1. Distinct short-term plasticity of EPSCs in different IN types of the hippocampal CA3 region ... 42
5.1.2. Target cell type-dependent differences in Ca2+ inflow in axon terminals ... 47
5.2. PART II. Improved spike inference accuracy by estimating the peak amplitude of unitary [Ca2+] transients in weakly GCaMP6f expressing hippocampal CA1 pyramidal cells ... 53
5.2.1. Variability in the amplitude of GCaMP6f [Ca2+] transients ... 53
5.2.2. Variability in the GCaMP6f expression level ... 56
5.2.3. Variability of unitary [Ca2+] transients among cells with similar GCaMP6f expression level ... 58
5.2.4. Supralinear temporal summation of GCaMP6f [Ca2+] transients ... 68
5.2.5. Cell-to-cell variability of the peak amplitude of unitary [Ca2+] transients underlies spike inference error rate ... 72
5.2.6. Reduction of spike inference error by fitting with the estimated peak amplitudes of unitary [Ca2+] transients ... 77
6. DISCUSSION ... 82
7. CONCLUSION ... 92
8. SUMMARY ... 94
9. ÖSSZEFOLGALÓ ... 95
10. BIBLIOGRAPHY ... 96
11. LIST OF OWN PUBLICATIONS ... 111
11.1. Publications that formed the basis of the dissertation: ... 111
11.2. Other publications: ... 111
3
12. ACKNOWLEDGMENTS ... 112
4 1. ABBREVIATIONS
+ positive
* p < 0. 05
2P two-photon
3D 3-dimensional AP action potential AU arbitrary unit AZ active zone Bkgrd background CA Cornu Ammonis CV coefficient of variation DG dentate gyrus
duA ‘detected unitary’ amplitude EC Entorhinal Cortex
Elfn1 extracellular leucine-rich repeat fibronectin-containing protein 1 EM electron microscopic
EPSC excitatory postsynaptic current EPSP excitatory postsynaptic potential ER error rates
Fv felszabadulási valószínűség FOV field of view
FS fast-spiking
FWHM full width at half-maximal amplitude GABA gamma aminobutyric acid
GEVI genetically encoded voltage indicators
IN interneuron
IQR interquartile ranges ISI inter spike interval
mGluR1α metabotropic glutamate receptor 1α MW U Mann-Whitney U test
5 NA numerical aperture
NGS normal goat serum O-Bi oriens-bistratified
O-LM oriens-lacunosum moleculare PB phosphate buffer
PC pyramidal cell PFA paraformaldehyde pnonlin nonlinearity parameter Pr release probability PS piramissejt
PSD postsynaptic density PSP postsynaptic potential
puA ‘presumed unitary’ amplitude PV parvalbumin
ROI region of interest
SDS-FRL sodium dodecylsulphate- digested freeze-fracture replica labeling SNR signal to noise ratio
SOM somatostatin
str. l-m stratum lacunosum-moleculare str. luc. stratum lucidum
str.ori. stratum oriens str. rad. stratum radiatum SV synaptic vesicle TBS Tris-buffered saline
VGCC voltage-gated Ca2+ channels
6 2. INTRODUCTION
2.1. Glutamatergic synaptic transmission in the central nervous system
Regulated control of synaptic transmission is essential for gating the information flow through neuronal circuits. Functional parameters such as neurotransmitter release probability (Pr), size of postsynaptic response, short- and long-term plasticity and efficacy are different depending on the identity of the pre- and postsynaptic neurons. Moreover, different axon terminals of a cell can have different release probabilities resulting in a context-dependent activation of the postsynaptic cells by the same presynaptic cell (reviewed in Nusser, 2018).
A depressing synapse with high initial transmitter release probability is more efficacious at low frequencies, whereas a facilitating synapse with low initial release probability will be more efficacious at high frequencies, and can serve as presynaptic burst detector (Blackman et al., 2013). The fact that such a mechanism is present in spite of the necessity of a signaling mechanism between the pre-and postsynaptic cells, suggests that this form of diversity is potentially crucial for the information processing in the mammalian brain (Blackman et al., 2013).
Understanding the rules of formation of synapses with diverse properties is crucial for elucidating how neuronal circuits are built up from individual neurons, which are then responsible for the emergence of complex behaviors and memory formation. The mechanism underlying the differential regulation of synaptic properties however, remains elusive. In the next sections, after introducing the studied brain region, I will summarize our current knowledge about the anatomical and molecular features and the functional properties of synapses. Then, in the first part of my results section I will present my experiments, which extended our current knowledge about the mechanisms of target cell-type dependent differences in release probability (Éltes et al., 2017).
Recent results provide evidence that the heterogeneity of principal cells, in concert with the heterogeneity of synaptic properties, can constitute several distinct, nonuniform parallel circuit modules underlying the diverse downstream effects of circuit activity (Soltesz and Losonczy, 2018). In order to observe the extent of the influence of synaptic diversity on information processing, storage and retrieval, it is necessary to simultaneously and chronically record the activity of large ensembles of neurons in behaving animals that are
7
anatomically and biochemically identifiable. In vivo electrophysiological recordings have the required temporal resolution, but they allow the monitoring of the activity of a relatively modest number of cells for short periods and provide limited information about the identity of the recorded cells (Buzsáki, 2004). Investigating neuronal activity using genetically encoded Ca2+ indicators in behaving animals has become a widely used technique. However, inferring the spiking activity from fluorescent traces, is still a formidable challenge due to the different expression levels and the highly nonlinear nature of the most widely used genetically encoded Ca2+ indicators (Jercog et al., 2016; Lin and Schnitzer, 2016). In the Introduction I will detail the limitations of the current state of the art optical imaging techniques, and in the second part of my results section I will explore how the amount of GCaMP6f in the cells affects the amplitude, kinetics and temporal summation of [Ca2+] transients, and I will also elucidate the effect of indicators expression level and of the variability of the unitary fluorescence signals on the spike inferring performance. Finally I will offer a reliable spike inference strategy with a superior accuracy compared to currently available methods (Éltes et al., 2019).
2.2. The hippocampus
The hippocampal formation, located within the temporal lobe of the brain, forms a computational unit that includes the dentate gyrus, hippocampus proper (Cornu Ammonis, CA), subiculum, presubiculum, parasubiculum, and entorhinal cortex (EC) (Andersen et al., 2007). The hippocampus attracted the attention of neuroscientists due to its implications in mnemonic processes and episodic memory; and because of its phylogenetically highly preserved and simplified structure, with cell bodies, inputs and outputs ordered in distinct layers (Andersen et al., 2007). The first evidence pointing towards its role in memory retrieval has emerged in the 1950’s when Scoville and Milner reported that patient H.M.
suffered anterograde memory impairment due to a bilateral hippocampal removal surgery (Scoville and Milner, 1957). Since then, the hippocampal formation has been associated with several other conditions, such as epilepsy and Alzheimer’s disease (Green, 1964). Beside its significance in different pathologies hippocampal neurons can encode spatial locations (O’Keefe and Dostrovsky, 1971) and time (Pastalkova et al., 2008; Kraus et al., 2013;
8
MacDonald et al., 2013). Hippocampal neurons can also recognize the position of conspecifics (Omer et al., 2018), possibly playing a role in social interactions; they are able to code constant landmarks of changing environments (Geiller et al., 2017), and locomotion or immobile periods of a task (Arriaga and Han, 2017). Some hippocampal neurons increase their activity in reward zones during reverse replays in accordance with the relative amount of the reward (Ambrose et al., 2016). Aronov et al hypothesize and provide evidence that the spatial representations are just examples of a general mechanism for encoding any arbitrary continuous variables that are relevant to an animal (Aronov et al., 2017). Due to these intriguing implications and its simplified structure the hippocampus became a model system for neuroanatomical and electrophysiological studies relating to the synaptic organization of the brain. Therefore, I have chosen to investigate glutamatergic synaptic transmission in this brain region.
2.2.1. The intrinsic organization of the hippocampus
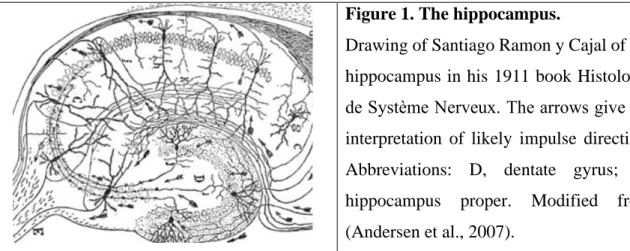
The hippocampus is devided to four main regions: dentate gyrus, area CA3, CA2, and CA1 of the hippocampus proper. The dentate gyrus consists of three layers: 1) the molecular layer where the apical dendrites of the granule cells receive their input; 2) the granule cell layer in which the somata of principal cells, the granule cells are located in a tightly packed manner; 3) a polymorphic layer/ hilus which is comprised of polymorphic cells and the efferent fibers of the dentate gyrus (Figure 1) (Andersen et al., 2007).
Figure 1. The hippocampus.
Drawing of Santiago Ramon y Cajal of the hippocampus in his 1911 book Histologie de Système Nerveux. The arrows give his interpretation of likely impulse direction.
Abbreviations: D, dentate gyrus; C, hippocampus proper. Modified from (Andersen et al., 2007).
The principal cells from the three areas of the hippocampus proper are also organized in a single layer; however, the size of their somata are different along the proximodistal axis
9
(Figure 1) (Andersen et al., 2007). All these principal cells release L-glutamate from their axon terminals.
Additionally to the laminar division of the neuronal elements of the hippocampus, the pyramidal cells (PCs) of the CA1 region are morphologically, molecularly and functionally (physiological properties, connectivity) heterogeneous along a radial axis, that is perpendicular to the PC layer (reviewed in Soltesz and Losonczy, 2018). The superficial CA1 PCs are immunopositive for a Ca2+ binding protein calbindin, which may function as an intra- neuronal Ca2+ buffering system (Baimbridge et al., 1991). Moreover, another study demonstrated transcriptional gradients along the radial axis (Cembrowski et al., 2016), which could manifest in differences in protein expression and functional properties (reviewed in Soltesz and Losonczy, 2018). The heterogeneity along the radial axis is complemented with spatial gradients in the dorsoventral axis (reviewed in Strange et al., 2014) and proximodistal axis (reviewed in Igarashi et al., 2014). The PCs located in dorsal hippocampus show more precise place fields compared with the more diffuse place fields of ventral hippocampal place cells (Jung et al., 1994; reviewed in Basu and Siegelbaum, 2015). CA1 PCs also differ in their dendritic morphology (Bannister and Larkman, 1995), connectivity with INs (Lee et al., 2014), activity during theta oscillations (Mizuseki et al., 2011) and sharp-wave ripples (Valero et al., 2015) in vivo.
The inhibitory neurons of the hippocampus, which release gamma aminobutyric acid (GABA) from their terminals, are even more diverse with respect to their functional, anatomical properties and neurochemical content (Klausberger and Somogyi, 2008;
Somogyi, 2010). Distinct types of interneurons (INs) provide subcellular domain-specific GABAergic innervation to PCs, allowing the coordination of multiple glutamatergic inputs through their temporally distinct activity (Somogyi et al., 2014). The two populations of INs that are of interest to my study are the fast-spiking (FS) parvalbumin-positive (PV+) and the somatostatin (SOM) and metabotropic glutamate receptor 1α (mGluR1α) expressing INs.
SOM and mGluR1α-expressing, oriens-lacunosum moleculare (O-LM) and oriens- bistratified (O-Bi) INs of the CA1 area have their soma and dendrites located in stratum oriens and receive facilitating excitatory postsynaptic currents (EPSCs) (Losonczy et al., 2002; Biro, 2005). In contrast, the somata of PV-expressing INs (basket, axo-axonic,
10
bistratified cells) are located in stratum pyramidale. Due to the expression of Kv3.1b K+ channel subunit, these cells are able to fire at very high frequencies (Du et al., 1996). Their inputs from PCs display short-term depression (Losonczy et al., 2002). The synaptic outputs of these cells also differ, PV+ cells innervate the perisomatic region of the PCs, whereas mGluR1α+ cells innervate the distal dendritic compartments; therefore the two cell classes can exert their inhibitory effects on different afferent pathways.
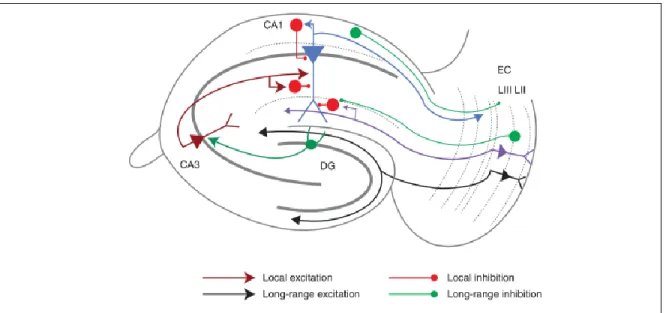
2.2.2. The hippocampal circuit
The afferents and efferents of the hippocampus are organized in layers in a topographical manner. The main hippocampal input is formed by fibers from the layer II and III of the entorhinal cortex, which form synapses on the dendrites of dentate gyrus granule cells and CA3 PCs; and on the apical dendrites of CA1 PCs respectively (Figure 2) (Andersen et al., 2007). These two pathways, the Perforant Path (indirect) and the Temporoammonic Path (direct) transfer different information from the medial and lateral entorhinal cortices: spatial (Zhang et al., 2013) and nonspatial (Hargreaves et al., 2005), or context- and content-related (Knierim et al., 2014) information, respectively (reviewed in Basu and Siegelbaum, 2015). This information is then further processed in the hippocampus (Figure 2). The axon terminals of granule cells, the Mossy Fibers, form synapses onto complex spines, the so-called thorny excrescences on the apical dendrites of the CA3 PCs in stratum lucidum. The CA3 PCs form a dense network of reciprocal connections and innervate heavily the dendrites of PCs of the CA2 and CA1 regions in the stratum radiatum and oriens (via the Schaffer Collateral Pathway). They also send axons to the contralateral hippocampus via the anterior commissure (Associational Commisural Pathway) (Andersen et al., 2007;
Basu and Siegelbaum, 2015). Recent results provide evidence for additional excitatory inputs of CA1 PCs directly from layer II of medial EC (Kitamura et al., 2014) and also from the CA2 region (Chevaleyre and Siegelbaum, 2010). The CA2 neurons in turn receive similar direct and indirect inputs as CA1 PCs from the EC, a weaker input from dentate gyrus granule cells through the Mossy Fibers (Kohara et al., 2014), and additional inputs from a number of subcortical regions (Cui et al., 2013; Hitti and Siegelbaum, 2014)
11
Several types of INs of the hippocampus are innervated by the direct pathway from EC layer III which provides strong feedforward inhibition onto CA1 pyramidal neurons. An important GABAergic input to INs arrives from the medial septum, which was proposed to contribute to the coordination of network activity through parallel, target area- and cell type- selective projections (Unal et al., 2018).
Figure 2. The classical hippocampal circuit.
Perforant path: direct pathway to CA1 PCS: purple; indirect to dentate gyrus (DG) granule cells: black; Mossy fibers: dark green; Schaffer collateral: dark red; CA1 output: blue;
long-range inhibitory projections: green; local GABAergic INs and their local projections:
red. Arrowheads indicate the direction of information transfer. Modified from Basu and Siegelbaum, 2015.
The major output of the hippocampus is provided by the axons of CA1 PCs (Figure 2) which innervate a number of brain regions, including subiculum, medial and lateral EC, perirhinal cortex, prefrontal cortex, restrosplenial cortex, amygdala, nucleus accumbens, the anterior thalamic nuclei, the medial mammillary nucleus, the lateral septum (reviewed in Basu and Siegelbaum, 2015). The GABAergic outputs of some projecting INs innervate the local INs (Melzer et al., 2012) of subiculum and medial EC, medial septum (Jinno et al., 2007; Fuentealba et al., 2008), retrosplenial cortex, indusium gresium (Jinno et al., 2007), striatum (Melzer et al., 2012). In has been suggested that long-range inhibitory projections
12
may be important for coordinating the timing between the hippocampus and its cortical targets (Buzsáki and Chrobak, 1995; reviewed in Basu and Siegelbaum, 2015).
2.3. Glutamatergic synaptic transmission
Synapses are specialized sites where neurons communicate in a spatially and temporally precise manner. Currently, two major types of synapses are known to exist:
electrical and chemical. Electrical synapses provide instantaneous signal transmission via gap junctions; most synapses are however, chemical and are capable of highly complex signaling (Kandel et al., 2013). I will present in more details the chemical synaptic transmission.
2.3.1. Anatomical and molecular structure of the synapse
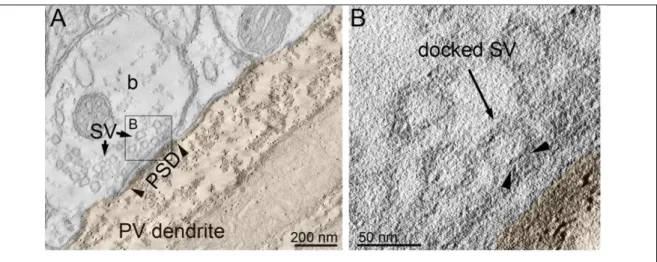
Chemical synapses (hereafter synapses) are close appositions of specialized regions of the plasma membranes of the pre- and postsynaptic cells (Figure 3), containing electron- lucent synaptic vesicles (SV), of a size of ~40 nm (Palay and Palade, 1955) which store the neurotransmitters. The vesicles are intercalated in a hexagonal grid of dense projections anchored to an actin scaffold by synapsin (Akert et al., 1972; Pfenninger et al., 1972;
reviewed in Südhof, 2012). Those vesicles that are in contact with the plasma membrane are called docked vesicles (Figure 3); they seem to localize randomly over the AZ area (Schneggenburger et al., 2012) and are believed to be set for fusion and release of the neurotransmitter.
The synaptic vesicle exocytosis is spatially restricted to the active zone (AZ), marked by an electrodense material at the precise opposition of the plasma membranes (Gray, 1963;
reviewed in Südhof, 2012). This is surrounded by the perisynaptic zone which is the site of synaptic vesicle endocytosis, contains presynaptic receptors (e.g.: GABAB, group III metabotropic glutamate receptors - which can regulate synaptic activity) and proteins involved in membrane trafficking and recycling of synaptic vesicles.
13
Figure 3. Electron tomograph of an excitatory synapse.
(A) Electron tomographic subvolume of a CA3 PC axon terminal establishing asymmetric synaptic contact (arrowheads demarcate the edges of the synapse) on a PV+ dendrite (labeled with preembedding peroxidase reaction). (B) Higher-magnification view of the boxed area showing a docked vesicle. Abbreviations: SV, synaptic vesicle; PSD, postsynaptic density. Modified from Éltes et al., 2017, experiment of Noemi Holderith.
The AZs are composed of specialized, evolutionarily conserved proteins: RIM (central organizers of the AZ), Munc13 (mediates vesicle priming), RIM-BP (links Ca2+
channels to RIM), α-liprin, ELKS (synapse formation), piccolo and bassoon (provide presynaptic skeleton) which are part of the secretory apparatus, and transsynaptic cell- adhesion molecules (e.g. neurexins). Components of the release machinery (SNARE complex, Munc18) are also present; however, these are not enriched in the AZs but distributed all over the plasma membrane (reviewed in Südhof, 2012; Kandel et al., 2013).
The AZs contain P/Q- (Cav2.1) and N-type (Cav2.2) Ca2+ channels, which are responsible for the release, and also R-type (Cav2.3) Ca2+ channels (Holderith et al., 2012; Parajuli et al., 2012; Schneggenburger et al., 2012; reviewed in Südhof, 2012; Althof et al., 2015; Lenkey et al., 2015; Éltes et al., 2017). The P/Q- and N-type channels are enriched at the AZs of hippocampal glutamatergic and GABAergic, and calyx of Held terminals (Kulik et al., 2004;
Holderith et al., 2012; Althof et al., 2015; Lenkey et al., 2015; Nakamura et al., 2015; Éltes et al., 2017). Their density in the CA3 PC terminals correlates linearly with the AZ area
14
(Holderith et al., 2012; Althof et al., 2015) and they are distributed nonuniformly, arranged in clusters (Südhof, 2012a; Althof et al., 2015; Nakamura et al., 2015).
The presynaptic membrane communicates with the postsynaptic membrane through a 20-40 nm synaptic cleft, where the neurotransmitters are released. The postsynaptic membrane contains postsynaptic receptors (e.g.: AMPA, NMDA in excitatory, GABAA and GABAB, GlyR in inhibitory synapses) and several regulatory proteins embedded in the postsynaptic density (Kandel et al., 2013).
2.3.2. Synaptic release
Synaptic transmission is initiated by an action potential (AP), that depolarizes the presynaptic membrane, and therefore opens the voltage-gated Ca2+ channels (VGCC) (Del Castillo and Katz, 1954; Borst and Sakmann, 1996). Due to the low intracellular concentration of Ca2+ at rest and due to effective [Ca2+] buffering capabilities (mobile buffers, intracellular stores), Ca2+ ions are very efficient chemical signals (Kandel et al., 2013). The transient increase in its concentration induces exocytosis of the synaptic vesicles (Katz and Miledi, 1967; reviewed in Sudhof, 2004) in a highly cooperative manner (Dodge and Rahamimoff, 1967). The ultrafast speed of neurotransmitter release, not much slower then the actual opening of the VGCC (~ 100 μs), indicates that a release machinery must exist in a primed and ready state (Sabatini and Regehr, 1999; reviewed in Südhof, 2012b, 2013a, 2013b).
Synaptic vesicle proteins, such as synapsins target the vesicles to release sites;
whereas the Ca2+ channels are recruited to the release sites by the collaboration of two families of evolutionary conserved active-zone proteins, RIMs and RIM-BPs (binds Ca2+
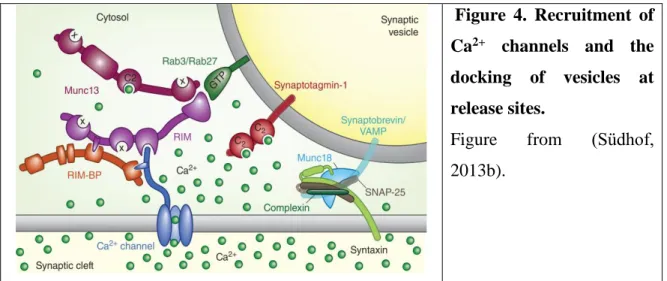
channels). The interaction of RIM with Munc13 and vesicular Rab3/ Rab27 GTPases results in the docking of synaptic vesicles (Figure 4). Additionally, Munc13 serves as a catalyzer of priming of vesicles for fusion (Wang et al., 1997; Kaeser et al., 2011; reviewed in Südhof, 2013a, 2013b). Recent results demonstrated a role of Munc13-3 in the regulation of developmental localization of Cav2.1 (P/Q-type) and Cav2.2 (N-type) Ca2+ channels and of the coupling distance between release sensors and Ca2+ channels at parallel fiber-to-Purkinje neuron synapses (Kusch et al., 2018).
15
Figure 4. Recruitment of Ca2+ channels and the docking of vesicles at release sites.
Figure from (Südhof, 2013b).
In the first step of the priming, two proteins located on the plasma membrane (syntaxin and SNAP-25) form a complex (the SNARE complex) with the synaptic vesicle protein synaptobrevin (Söllner et al., 1993a). The zippering of the SNARE complexes forces the two membranes into close proximity, destabilizes their hydrophilic surfaces and initiates fusion (Priming I on Figure 5). The sensors of the Ca2+ ions, the synaptotagmins also bind to syntaxin-1 of the SNARE complexes (Bennett et al., 1992; Söllner et al., 1993b; Li et al., 1995; reviewed in Südhof, 2013b, 2013a). Then, the calcium-activated synaptotagmin displaces complexin (a co-factor for synaptotagmin which functions both as a clamp and as an activator of calcium- triggered fusion (McMahon et al., 1995; Maximov et al., 2009)), and tiggers fusion-pore opening (Priming II on Figure 5). Binding of Munc18-1 protein to syntaxin (full trans-SNARE complex) opens the fusion pore (Hata et al., 1993; Dulubova et al., 1999; reviewed in Südhof, 2013b, 2013a).
Fusion-pore expansion transforms the initial trans-SNARE complexes into cis- SNARE complexes (Fusion completion on Figure 5) that are disassembled by the specialized ATPase NSF. During the multiple cycles of association and dissociation, the function of the SNARE complex is maintained by chaperones: cysteine string proteins and synucleins. The continued association of Munc18-1 to SNARE complexes throughout their assembly/
disassembly cycle is essential for fusion (Khvotchev et al., 2007; reviewed in Südhof, 2013b, 2013a; Zhou et al., 2013)
16
Figure 5. Key proteins regulating priming of synaptic vesicles, fusion of the membranes, pore opening and neurotransmitter release.
(a) Overview of the protein complex assembly for synaptic release. (b) Expanded view of the primed vesicle fusion complex. Figure from (Südhof, 2013b).
The pioneering work of Katz revealed that neurotransmitter release (at the end-plate of frog muscle) results in a postsynaptic response that is composed of several postsynaptic potentials (PSPs) of a fixed size which are released in an all-or-none manner (Del Castillo and Katz, 1954). In most neurons however not all APs, but only 10 - 20% of them, are able
17
to trigger the neurotransmitter release (Goda and Südhof, 1997; reviewed in Sudhof, 2004).
The Pr depends on the number of release ready vesicles, the Ca2+ concentration in the terminal, and the coupling of Ca2+ and vesicle fusion. Because these factors can be modulated by several mechanisms (e.g.: regulation of Ca2+ channel function, modulation of release machinery proteins, regulation of Ca2+ entry by the AP waveform or by different Ca2+
buffering capabilities, different composition of Ca2+ channels), the Pr can differ widely between different connections and even from bouton to bouton of the same axon (Atwood and Karunanithi, 2002; Nusser, 2018). The variability in the number of successfully released quanta in concert with the variability in the number of synaptic contacts and the quantal size (size of the postsynaptic depolarization caused by the release of a single quanta) results in the varying amplitude of the PSP (Katz and Miledi, 1967; reviewed in: Sudhof, 2004; Branco and Staras, 2009; Kandel et al., 2013). Moreover, the Pr defines the way a synapse adapts to dynamic inputs by being able to change with short-term activity. The PSP at a synapse with high initial Pr will decrease upon short-term repetitive activation (short-term depression), whereas at low initial Pr synapses the amplitude will increase (short-term facilitation) (reviewed in Branco and Staras, 2009).
The hypothesis that these differences in synaptic properties are underlied by distinct molecular mechanisms is currently generally accepted. The multiple isoforms of Ca2+ sensors (synaptotagmins), the four presynaptic VGCC subtypes, additionally the several isoforms of other synaptic proteins can potentially form thousands of combinations of presynaptic functional properties (Nusser, 2018).
2.4. Diversity of synaptic properties
Assessing the efficacy and reliability of synaptic transmission in a dynamic system, in which a plethora of connection types respond differently to diverse patterns of presynaptic firing activity, are crucial to understand the ongoing information transfer. Synapses formed by heterogeneous, or even apparently homogeneous pre- and postsynaptic cells demonstrate remarkable diversity regarding their synaptic properties (Nusser, 2018). A special form of this diversity is the so-called target cell type-dependent form, which results in the transmission of different aspects of information coded in a complex spike train to distinct
18
postsynaptic cell types by the same PC axon (Markram et al., 1998b, 1998a; Reyes et al., 1998; Pouille and Scanziani, 2004; Koester and Johnston, 2005).
2.4.1. Postsynaptic target cell type-dependent differences in synaptic properties
Release probability and the paired-pulse ratio have been demonstrated to show inverse correlation. Therefore, performing short-term plasticity experiments and calculating the paired pulse ratio between the postsynaptic responses evoked by the first and last APs in a train will allow the estimation of the release probability of those synapses. The first evidence for target cell-type dependent diversity of synaptic properties was revealed in the early 1970s in case of motoneuron synapses, which innervated multiple muscles with differing release probabilities and short-term plasticity (Parnas, 1972; Robitaille and Tremblay, 1987; Katz et al., 1993). Two decades later, Thomson reported a similar observation in the neocortex, where PC-to-PC connections showed paired-pulse depression, whereas PC-to certain IN synapses displayed robust short-term facilitation (Thomson, 1997).
Later, a similar phenomenon was found in the hippocampus (Ali and Thomson, 1998; Ali et al., 1998; Scanziani et al., 1998; Losonczy et al., 2002), where combined functional and molecular neuroanatomical approaches led to the identification of the postsynaptic IN types.
SOM and mGluR1α-expressing, O-LM and O-Bi INs of the CA1 area receive facilitating EPSCs with low initial Pr, whereas synaptic inputs onto FS PV-expressing INs (e.g., basket, axo-axonic, bistratified cells) display short-term depression and have high initial Pr (Atwood and Karunanithi, 2002; Losonczy et al., 2002; Biró et al., 2005; Koester and Johnston, 2005;
Mercer et al., 2012).
A candidate protein bestowing different Pr and short-term plasticity to axon terminals was mGluR7, a metabotropic glutamate receptor that shows postsynaptic target cell type- dependent differences in its presynaptic density (Shigemoto et al., 1996). However, a group III mGluR-specific antagonist failed to abolish the differences in short-term plasticity of synapses expressing or lacking mGluR7 (Losonczy et al., 2003). More recently, Sylwestrak and Ghosh (Sylwestrak and Ghosh, 2012) identified the extracellular leucine-rich repeat fibronectin-containing protein 1 (Elfn1) as a key molecule in regulation of short-term facilitation. This protein is selectively expressed postsynaptically in O-LM cell somata and
19
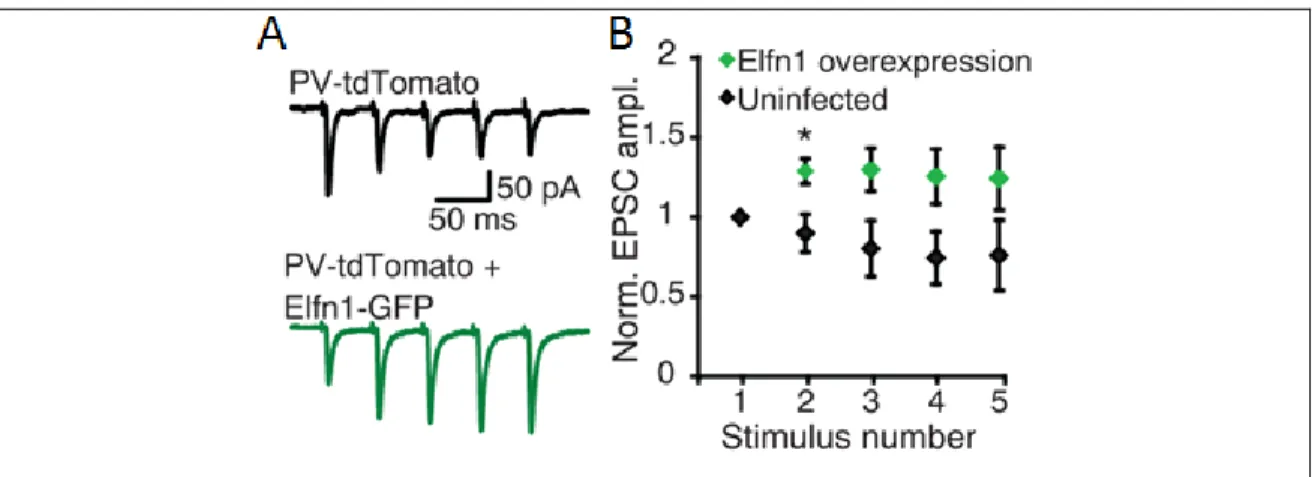
dendrites. When Sylwestrak et al. overexpressed it in PV+ INs, the short-term properties of PC-to-PV IN synapses was converted from short-term depression to short-term facilitation (Figure 6). Their results provide evidence that Elfn1 imposes facilitating neurotransmitter release to the presynaptic axon terminals (Sylwestrak and Ghosh, 2012).
Figure 6. Overexpression of Elfn1 in PV+ INs converts the short-term synaptic properties of PC-to-PV IN synapses.
(A) Response of control and Elfn1-expressing PV+ neurons to five stimuli delivered to the alveus at 20 Hz. (B) Quantification of short-term plasticity in Elfn1 overexpressing PV+ cells. Modified from Sylwestrak and Ghosh, 2012.
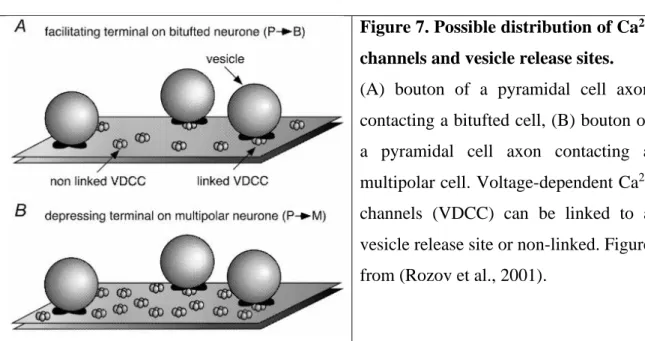
There is little data available regarding the mechanisms through which such proteins as Elfn1 can regulate the low initial Pr of PC-to-O-LM cell facilitating synapses, and high initial Pr of PC-to-PV IN depressing synapses. In 2001 Rozov et al. put forward an elegant hypothesis based on their experiments involving fast and slow Ca2+ buffers (Rozov et al., 2001). Intracellular loading of pyramidal neurons with the fast and slowly acting Ca2+
buffers, BAPTA and EGTA respectively, differentially reduced transmitter release in these two types of terminals. Unitary excitatory postsynaptic potentials (EPSPs) evoked by PC stimulation were reduced by presynaptic EGTA to 50% by much lower concentrations of buffers in case of bitufted neurons compared to multipolar neurons. The lower effectiveness of the buffers suggest a longer diffusional distance between release sites and Ca2+ channels at PC-to multipolar IN synapses. Therefore, they postulated that the low initial Pr of facilitating cortical PC synapses can be explained by a larger coupling distance between VGCC and Ca2+ sensors on the docked vesicles compared with the high Pr PC synapses on
20
FS INs (Figure 7). Assuming similar Ca2+ sensors and docked vesicle distributions, this would suggest a lower average Ca2+ channel density within the AZs of low Pr synapses (Rozov et al., 2001).
Figure 7. Possible distribution of Ca2+
channels and vesicle release sites.
(A) bouton of a pyramidal cell axon contacting a bitufted cell, (B) bouton of a pyramidal cell axon contacting a multipolar cell. Voltage-dependent Ca2+
channels (VDCC) can be linked to a vesicle release site or non-linked. Figure from (Rozov et al., 2001).
2.5. Diverse synaptic properties shaping network activity and behavior
Target cell-type dependent activation of INs results in differences in information processing, due to the different recruitment at low and high frequencies of short-term depressing and facilitating synapses, respectively (Blackman et al., 2013). The INs, due to their diverse morphological, functional, molecular, properties have been proposed to play a key role in shaping network activity (Isaacson and Scanziani, 2011; Kepecs and Fishell, 2014) and neuronal assembly formation (reviewed in Holtmaat and Caroni, 2016). Recent results provide evidence that distinct cognitive functions can be based on heterogeneous parallel circuit modules, and not random synaptic connections between homogeneous populations of neurons (Soltesz and Losonczy, 2018). One such example is that of deep CA1 PCs, which receive stronger excitatory input from MEC and from hippocampal area CA2, weaker excitatory input from CA3 PCs, and larger inhibitory currents from PV+ basket cells, compared to the superficially located CA1 PCs (Figure 8) (Lee et al., 2014; reviewed in Soltesz and Losonczy, 2018). These deep CA1 PCs are more active and more likely to form place fields than superficial neurons (Mizuseki et al., 2011) and their place cell representation
21
of the goal, during a goal-oriented learning task, was found to be more predictive of performance compared to the superficial neurons (Danielson et al., 2016; reviewed in Soltesz and Losonczy, 2018). This different relationship of CA1 PC subpopulations to behavior is hypothesized to be due to the distinct perisomatic inhibitory interactions between separate output channels (Figure 8) (Soltesz and Losonczy, 2018).
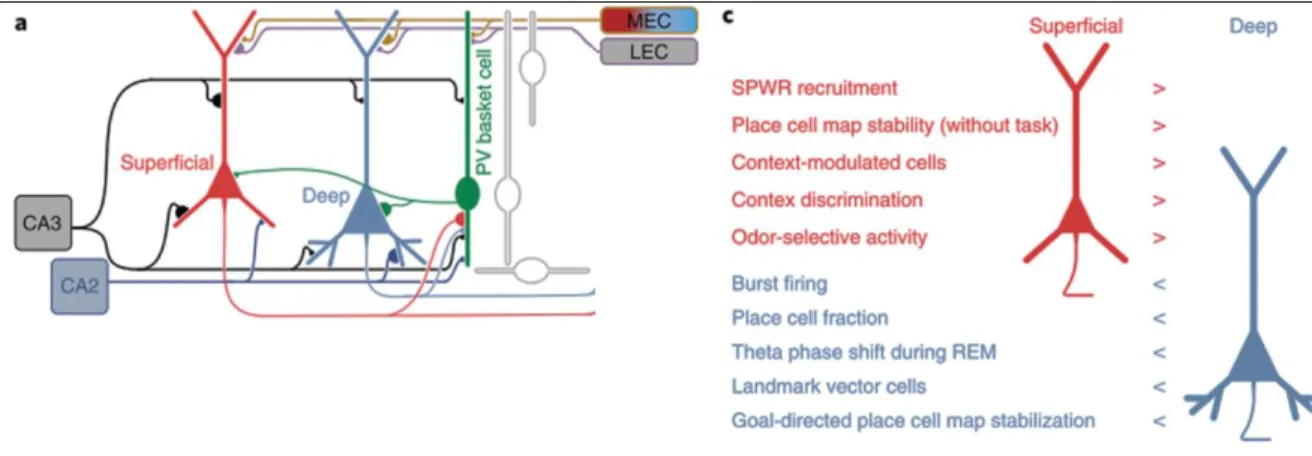
Figure 8. Different connectivity and synaptic properties of radially defined CA1 PC subpopulations can potentially result in their different recruitment during behavior.
(A) Biased microcircuits and afferent-efferent connectivity of superficial and deep CA1PCs. (C) Differential behavioral functions of radially defined CA1PCs subpopulations. Abbreviations: MEC, Medial Entorhinal Cortex Modified; LEC, Lateral Entorhinal Cortex. Modified from (Soltesz and Losonczy, 2018).
Understanding the extent to which diverse synaptic properties shape neuronal circuits, is critical to elucidate how neuronal activity is transformed into mnemonic processes and complex behaviors. For this neuroscientists must track the dynamics of large ensembles of morphologically and neurochemically identifiable cells in behaving animals, over timescales equivalent with long-term memory formation (Jercog et al., 2016). However, the methods currently available for exploring synaptic transmission in vivo are limited.
2.6. Limitations of methods exploring synaptic transmission in vivo
The ideal in vivo recording method is expected to monitor simultaneously the activity of large populations of neurons and to capture the temporal dynamics of their spiking activity during complex behaviors. In order to understand the function of neuronal networks the
22
recording method should also grant the morphological and molecular identification of neurons.
2.6.1 In vivo electrophysiological recordings
In vivo single cell electrophysiological recordings (i.e.: intracellular, cell attached, juxtacellular) have the required temporal resolution, and permit the post hoc identification and molecular analysis of the cells, but they allow the monitoring of the activity of only a relatively modest number of cells and only for short periods. Moreover, single cell recordings do not provide the opportunity to investigate the simultaneous activity of neuronal populations, which is necessary in order to decipher how the combination of their activity is coding an environment or a certain behavior. Electrical recordings of large numbers of neurons – populations that are statistically representative - is currently feasible by using tetrodes, silicon probes or multi-shank probes (Buzsáki, 2004). These techniques are invasive and cause local tissue damage. These large-scale electrophysiological recordings provide limited information about the identity of the recorded cells and face further limitations, such as difficulties in spike sorting (Buzsáki, 2004).
2.6.2. In vivo optical recordings
The introduction of two-photon (2P) microscopy (Denk et al., 1990) in concert with improvement of the signal to noise ratio (SNR) of the fluorescent probes revolutionized the field of optical imaging promoting the real-time investigation of biological processes (Helmchen and Denk, 2005; Svoboda and Yasuda, 2006). Optical imaging techniques have the advantage of monitoring AP-evoked fluorescent changes simultaneously in a large number of individual neurons and in a chronic manner, allowing the examination of activity changes during the course of learning, life experience, brain development, or disease progression. Moreover, the genetically encoded activity indicators enable selective interrogation of genetically defined neuronal subtypes, or of cells with specific patterns of anatomical connectivity permitting the sophisticated analyses of ensemble neural activity (reviewed in Broussard et al., 2014; Jercog et al., 2016; Lin and Schnitzer, 2016). The neuronal damage can also be minimized in case of superficially located areas, such as the
23
neocortex, because most optical preparations are minimally invasive and offer the possibility of placing the probe millimeters away from the area of interest.
The most ideal optical method would be the direct imaging of voltage changes, the primary signal of interest, using genetically encoded voltage indicators (GEVI). However, the fast nature of the voltage signal requires an indicator with very fast kinetics and high sensitivity to secure an acceptable signal to noise ratio. The necessary membrane targeting of the voltage sensitive molecules causes additional difficulties in the implementation of this imaging method (Broussard et al., 2014). Sensors with response dynamics that are compatible with recording of millisecond timescale computations are available in cultured cells; however, their use for in vivo imaging at single cell resolution is still sporadic, due to critical shortcomings such as low brightness, imperfect membrane localization, or low signal to noise ratio (Broussard et al., 2014; Knöpfel et al., 2015).
Neuronal spiking activity can also be indirectly monitored by recording AP-evoked [Ca2+] changes with Ca2+ indicators. The intracellular [Ca2+] is determined by the balance between calcium influx and efflux as well as by the exchange of calcium with internal stores and buffers, and in most neurons is ~50 - 100 nM. During electrical activity, the influx of Ca2+ through VGCC results in a transient increase of [Ca2+] to levels that are ten to hundred times higher (Berridge et al., 2000; Schwaller, 2010; reviewed in Grienberger and Konnerth, 2012). The large concentration difference makes monitoring [Ca2+] a potent measure of neuronal activity. The first high affinity, high signal to noise ratio genetically encoded Ca2+
indicator was developed by Nakai et al. in 2000 (Nakai et al., 2001) and was named G-CaMP.
This probe contains a circularly permutated GFP (cpGFP) that is connected to the M13 fragment of the myosin light chain kinase (a target sequence of calmodulin), and to calmodulin. Upon Ca2+ binding to calmodulin, a chain of conformational changes leads to an increase of cpEGFP fluorescence intensity (Nakai et al., 2001). The palette of genetically encoded Ca2+ indicators was expanded in the following years with indicators demonstrating improved affinity, kinetics; and with the addition of blue and red hues (Tian et al., 2009;
Zhao et al., 2011; Akerboom et al., 2012; Ohkura et al., 2012; Chen et al., 2013; Badura et al., 2014; Podor et al., 2015; Lin and Schnitzer, 2016) . The use of red indicators was expected to improve the maximal imaging depth and allow parallel optical manipulation of neuronal
24
activity, however they show photoswitching behavior or partial saturation at high number of APs, and accumulation in lysosomes which reduces the signal to noise ratio for in vivo imaging (Dana et al., 2016; Lin and Schnitzer, 2016). Other promising genetically encoded Ca2+ indicator candidates are the ratiometric indicators. Ratiometric imaging with Förster resonance energy transfer-based indicators have the advantage to enable the reduction of motion related artefacts during in vivo measurements. Their sensitivity only recently became comparable to that of synthetic dyes (Twitch family), however still show slower decay kinetics (Thestrup et al., 2014; Lin and Schnitzer, 2016).
The GCaMP family of genetically encoded Ca2+ indicators underwent successive structure-guided mutagenesis over the past decade to improve sensitivity, dynamic range, SNR and brightness, resulting in the GCaMP6 family with sensitivities comparable to those of synthetic Ca2+ indicators (Nakai et al., 2001; Tian et al., 2009; Akerboom et al., 2012;
Chen et al., 2013). Even though more recent developments yielded more sensitive (GCaMP7) or faster (GCaMP6fRS09, GCaMP6f91) indicators, these show more pronounced nonlinearity and saturate at lower Ca2+ levels; or have lower sensitivity, respectively (Ohkura et al., 2012; Badura et al., 2014; Podor et al., 2015). Thus, GCaMP6f became the most widely used genetically encoded Ca2+ indicator in behaving animals because it combines high sensitivity and large dynamic range with fast kinetics (Jercog et al., 2016).
2.6.3. Inference of spiking activity from fluorescence transients
Despite the improved properties of indicators, APs cannot be directly inferred from the fluorescent transients with millisecond temporal resolution (Jercog et al., 2016; Lin and Schnitzer, 2016). To overcome this limitation, several approaches have been developed to determine the AP firing underlying the fluorescent traces: template-matching (Greenberg et al., 2008; Grewe et al., 2010; Oñativia et al., 2013), deconvolution (Yaksi and Friedrich, 2006; Park et al., 2013), approximate Bayesian inference (Vogelstein et al., 2009;
Pnevmatikakis et al., 2016) and supervised learning techniques (Sasaki et al., 2008; Theis et al., 2016), but the accuracy of estimation for high frequency events is still < 40-60% (Lin and Schnitzer, 2016; Theis et al., 2016). Deneux et al. improved spike estimation performance by introducing a baseline drift and nonlinearity of the indicator (Deneux et al.,
25
2016). They define baseline drifts as low frequency, large amplitude baseline fluctuations, which probably reflect slow changes in [Ca2+] which are unrelated to the cell’s firing activity.
The nonlinearity parameters are: saturation γ, Hill exponent n or polynomial coefficient.
MLspike software uses a maximum-likelihood approach to find the most likely underlying spike train (Figure 9.).
Figure 9. ML spike physiological model and algorithm: Upon emission of s(t) spikes, intracellular [Ca2+] C(t) is driven by an increase A (the unitary calcium response) X s(t), then decays to the resting value with time constant τ. The measured fluorescence F(t) is the product of a drifting baseline fluorescence B(t) with a nonlinear function of C(t) accounting for dye saturation and GCaMP nonlinearities; a noise term is added.
(b) ‘MLspike’ algorithm illustrated on a schematic example without baseline drift. (top and middle) The probabilities (white-green colour code) of ‘best trajectories’ originating from all possible calcium values (y axis, for display purposes same scale as fluorescence) at time t (x axis) are calculated, iteratively for decreasing time. Figure and explanation from (Deneux et al., 2016)
Most of these algorithms are based on the estimation of the model parameters from a limited number of available simultaneous optical and electrical recordings, which might not capture the full range of the key parameters (Deneux et al., 2016; Theis et al., 2016).
The spike inferring accuracy is known to depend on peak amplitude and decay kinetics of single AP-evoked (unitary) [Ca2+] transients, SNR, baseline fluctuations and the
26
nonlinear nature of genetically encoded Ca2+ indicators (Wallace et al., 2008; Lütcke et al., 2013; Wilt et al., 2013; Rose et al., 2014; Deneux et al., 2016). These parameters not only vary among different cell types, preparations and optical recording conditions, but also among individual cells of the same type (Mao et al., 2008; Tian et al., 2009; Akerboom et al., 2012; Ohkura et al., 2012; Zheng et al., 2015). A key factor that determines many of these parameters is the concentration of the Ca2+ indicator: low concentrations of indicators provide signals with higher peak amplitudes, lower SNR and faster kinetics (Hires et al., 2008; Broussard et al., 2014; Dana et al., 2014; Rose et al., 2014). Unfortunately, the concentration/expression of the genetically encoded Ca2+ indicators cannot be controlled and made uniform among the transfected cells when they are expressed with viral vectors, leaving an inherent source of error for transforming the fluorescent traces to spike trains.
Understanding the exact relationship of indicator expression level and variability of unitary [Ca2+] transients, their SNR and nonlinearity, and how these parameters influence the performance of spike inferring algorithms is crucial to achieve higher accuracy.
27 3. OBJECTIVES
The general aim of my PhD work is to investigate glutamatergic synaptic transmission.
In the first part of my PhD thesis I pursue to answer the question of what mechanism underlies the target cell type-dependent differences in release probability (Éltes et al., 2017).
For this I specifically addressed the following questions:
1. What is the short-term plasticity of CA3 PC-to-PV+ or -mGluR1α+ IN synapses?
2. Does the postsynaptic presence of Elfn1/2 determine the short-term plasticity at PC-to-mGluR1α+ INs?
3. Are there target cell type-dependent differences in the [Ca2+] transients in axon terminals synapsing onto these two populations of INs?
4. Do presynaptic kainite receptors contribute to the [Ca2+] transients in the mGluR1α+ dendrite-targeting boutons?
5. Is the contribution of P/Q and N type VGCCs to the Ca2+ influx different in these two populations of axon terminals?
6. Is the degree of [Ca2+] buffering similar in the PV+- or mGluR1α+-dendrite targeting boutons?
Investigation of these properties and their functional consequences on network activity and during behavior is hampered by the inaccurate spike inference from the optically recorded fluorescent transients. Therefore, in the second part of my PhD work I aimed to understand the relationship between the expression level of the most widely used genetically encoded Ca2+ indicator, GCaMP6f and the variability in [Ca2+] transients, their signal to noise ratio and nonlinearity. I also aimed to elucidate which of these parameters is a key source of error in spike inference and to develop a procedure that improves the spike estimation (Éltes et al., 2019). For this, I asked the following specific questions:
1. How large is the variability in the unitary [Ca2+] transients and in the GCaMP6f expression level in CA1 hippocampal PCs?
2. What is the relationship of the GCaMP6f expression level and the peak amplitude of unitary [Ca2+] transients?
28
3. Is there a cell-to-cell variability in the temporal summation of GCaMP6f [Ca2+] transient? What is the relationship of the supralinearity and of the expression level, or the size of unitary responses?
4. How does variability in the amplitude, kinetics and supralinearity affect the precision of spike estimation?
5. Can we estimate the peak amplitude of the unitary [Ca2+] signals? Can spike inference performance be improved by using the peak amplitude of an estimated unitary [Ca2+] transient in the spike inferring algorithm?
Contributions:
In the first part of my thesis, the short-term plasticity measurements of CA3 PC and PV+/mGluR1α+ INs, and the [Ca2+] imaging from boutons of CA3 PCs are pooled from my recordings and that of my collaborator, Noémi Holderith’s (for exact contribution see Table 1; Figures 1 and 2 from Éltes et al., 2017). The Neurolucida reconstructions were performed by Borbála Bolonyai.
In the second part of my thesis the simulations were conducted together with my collaborator, Miklós Szoboszlay. He implemented the MLspike algorithm (Deneux et al., 2016) and performed initial simulations and analysis. My collaborator, Szigeti Katalin performed anti-GFP immunoreactions and quantified native GCaMP6f and anti-GFP intensities. She also performed 3-dimensional (3D) reconstructions of the somata of a subselected population of the recorded cells, measured their surface-to-volume ratios and helped with the post hoc identification of some recorded cells (Éltes et al., 2019).
29
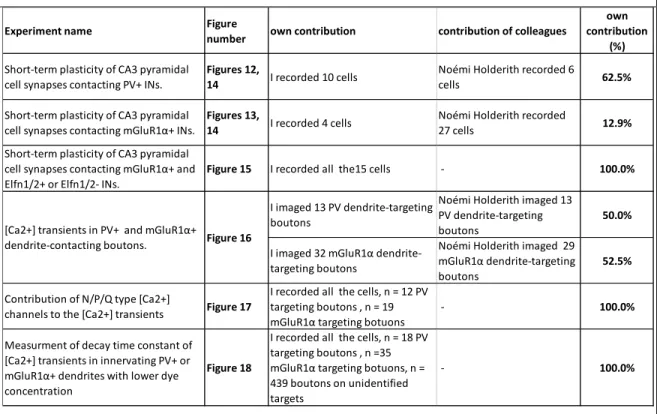
Table 1. Details of my contribution in the pooled data in the Part I of the thesis.
Experiment name Figure
number own contribution contribution of colleagues
own contribution
(%) Short-term plasticity of CA3 pyramidal
cell synapses contacting PV+ INs.
Figures 12,
14 I recorded 10 cells Noémi Holderith recorded 6
cells 62.5%
Short-term plasticity of CA3 pyramidal cell synapses contacting mGluR1α+ INs.
Figures 13,
14 I recorded 4 cells Noémi Holderith recorded
27 cells 12.9%
Short-term plasticity of CA3 pyramidal cell synapses contacting mGluR1α+ and Elfn1/2+ or Elfn1/2- INs.
Figure 15 I recorded all the15 cells - 100.0%
I imaged 13 PV dendrite-targeting boutons
Noémi Holderith imaged 13 PV dendrite-targeting boutons
50.0%
I imaged 32 mGluR1α dendrite- targeting boutons
Noémi Holderith imaged 29 mGluR1α dendrite-targeting boutons
52.5%
Contribution of N/P/Q type [Ca2+]
channels to the [Ca2+] transients Figure 17
I recorded all the cells, n = 12 PV targeting boutons , n = 19 mGluR1α targeting botuons
- 100.0%
Measurment of decay time constant of [Ca2+] transients in innervating PV+ or mGluR1α+ dendrites with lower dye concentration
Figure 18
I recorded all the cells, n = 18 PV targeting boutons , n =35 mGluR1α targeting botuons, n = 439 boutons on unidentified targets
- 100.0%
[Ca2+] transients in PV+ and mGluR1α+
dendrite-contacting boutons. Figure 16
30 4. MATERIALS AND METHODS
4.1. Animal Care
All experiments were conducted in accordance with the Hungarian Act of Animal Care and Experimentation (1998, XXVIII, section 243/1998) and with the ethical guidelines of the Institute of Experimental Medicine Protection of Research Subjects Committee. All experimental protocols were approved by the Protection of Research Subjects Committee of the Institute of Experimental Medicine. Animals were housed within the vivarium of the Institute in a normal 12 h/ 12h light/dark cycle with food and water available ad libitum.
Young experimental rats were kept in a cage with their mothers and were used before weaning; whereas, adult mice from the same litter were kept together in the same cage. The environment of mice was enriched with Sizzle-Pet and cardboard tubes as play tunnels (Akronom).
4.2. PART I: Investigation of the mechanism of target cell-type dependent differences in neurotransmitter release probability
4.2.1. Slice preparation and electrophysiological recordings of CA3 PCs and INs Male Wistar rats (n = 97, 14 - 17 days old) were killed by decapitation and acute hippocampal slices were prepared as described previously (Holderith et al., 2012; Éltes et al., 2017). Briefly, after decapitation, the brain was quickly removed and placed into an ice-cold cutting solution containing the following (in mM): sucrose, 205.2; KCl, 2.5; NaHCO3, 26;
CaCl2, 0.5; MgCl2, 5; NaH2PO4, 1.25; and glucose, 10, saturated with 95% O2 and 5%
CO2. Then, 300 µm-thick horizontal slices were cut from the ventral part of the hippocampus using a Leica Vibratome (VT1200S). Slices were incubated in an interface-type holding chamber in ACSF containing the following (in mM): NaCl, 126; KCl, 2.5; NaHCO3, 26;
CaCl2, 2; MgCl2, 2; NaH2PO4, 1.25; and glucose, 10; saturated with 95% O2 and 5% CO2, pH 7.2 - 7.4, at 36°C that was gradually (~1 hour) cooled down to room temperature (22 - 24°C). Experiments were performed at 22 - 24°C up to 6 h after slicing.
Cells were visualized using a Femto2D microscope equipped with oblique illumination and a water-immersion lens (25X, numerical aperture (NA) = 1.05, Olympus,
31
or 25X, NA = 1.1, Nikon). Whole-cell voltage- or current-clamp recordings were performed from CA3 PCs or INs located in the strata oriens and pyramidale using MultiClamp 700A and B amplifiers (Molecular Devices). Recorded traces were filtered at 3 - 4 kHz and digitized online at 20 kHz. Patch pipettes (resistance 3 - 6 MΩ) were pulled from thick-walled borosilicate glass capillaries with an inner filament. Intracellular solution contained the following (in mM): K-gluconate, 110; KCl, 5; creatine phosphate, 10; HEPES, 10; ATP, 2;
GTP, 0.4; and biocytin, 5, pH 7.3; 290 - 300 mOsm. For voltage-clamp recordings of evoked EPSCs in INs, the intracellular solution contained picrotoxin (0.6 - 0.8 mM). For current- clamp recordings and Ca2+ imaging in PC axons, 100 or 300 µM Fluo5F (Invitrogen) and 20 µM Alexa Fluor 594 (Invitrogen) were added to the intracellular solution. The firing pattern of the INs was determined with a series of 500 ms long hyperpolarizing and depolarizing current pulses with amplitudes of 125 - 500 pA. A cell was considered fast spiking if the average firing frequency exceeded 70 Hz. For extracellular stimulation, a unipolar stimulating electrode was placed in the stratum oriens at least 100 µm away from the soma.
INs were held at -70 mV and 5 stimuli (0.2 - 0.3 ms duration, 20 - 200 pA) at 40 or 50 Hz with 30 s interstimulus interval (15 - 70 repetitions) were applied. Data from 40 and 50 Hz stimulations were pooled (see Figure 14). Series resistance was monitored and was <
20 MΩ. Pyramidal cells were held at -70 mV (with a maximum of -100 pA DC current) and single APs at 0.05 - 0.016 Hz were evoked with 2- to 4-ms-long depolarizing current pulses (1 - 1.2 nA). Peak amplitude and full width at half-maximal amplitude (FWHM) of the APs were monitored and cells were rejected if any of these parameters changed > 10%.
4.2.2. In vitro two-photon [Ca2+] imaging of CA3 PC axon terminals
Experiments were performed with a Femto2D (Femtonics) laser scanning microscope equipped with a MaiTai femtosecond pulsing laser tuned to 810 nm (described in (Holderith et al., 2012). Electrophysiological data and image acquisition were controlled with software written in MATLAB (The MathWorks). Cells were filled for 2 h with a Ca2+-insensitive (20 µM Alexa Fluor 594) and a Ca2+-sensitive fluorophore (100 or 300 µM Fluo5F). Boutons were selected at 150 - 300 µm distances from the soma on the second- and third order collaterals of the main axon in the stratum oriens at 35 - 80 µm slice depth. They were imaged
32
in line scan mode (scan duration 500 or 1200 ms at 1 kHz, 1 - 3 per minute repetition, 2 - 3 scans averaged for each bouton) with a laser intensity of 2 - 6 mW at the back aperture of the objective lens. Single AP-evoked changes in fluorescence were quantified during the recording as deltaG/R(t) = (Fgreen(t) - Frest, green)/(Fred - Idark, red) where Fgreen(t) represents the green fluorescence signal as a function of time, Frest, green is the green fluorescence before stimulation, and Idark, red is the dark current in the red channel (Figure 10).
Figure 10. In vitro two-photon [Ca2+] imaging of CA3 PC axon terminals.
(A) A single AP was evoked by a 2 - to 4 ms long depolarizing current pulse. Inset shows the scanned bouton (white line, scanline for background; yellow line, scanline on bouton). (B) Fluorescence intensities in the red (Alexa Fluor 594), green (Fluo-5F) channels, and overlay respectively. Note the abrupt fluorescence change in the green channel upon the AP, and the lack of fluorescence change in the red channel. (C) Raw [Ca2+] trace (from the green channel).
All panels are on the same timescale as A and are aligned accordingly. Abbreviations:
Bkgrd, background.
To normalize data across batches of dyes, Gmax/R values were measured by imaging a sealed (tip melted and closed by heating) pipette filled with intracellular solution containing 10 mM CaCl2 for each cell at the same position where the boutons were imaged. DeltaG/R measurements from boutons were divided by Gmax/R, yielding the reported values of G/Gmax. The effects of 1 µM ω-CTX MVIIC (diluted in 1 mg/ml BSA; Tocris Bioscience and Alomone Laboratories) were tested by comparing the peak amplitudes of presynaptic [Ca2+]
33
transients in individual boutons, averaged from two to three consecutive scans, in control conditions, and after 30 min (for ω -CTX MVIIC) of wash-in of the drug.
4.2.3. Identification of the postsynaptic target of the imaged boutons
At the end of the recordings a high resolution image stack of the measured boutons was acquired; after which the slices were fixed in a solution containing 4% paraformaldehyde (PFA), 0.2% picric acid in 0.1 M phosphate buffer (PB), pH 7.4, at 4°C for either 12- 36 h (PV or mGluR1α immunolabeling) or 1 - 3 h (for Elfn1/2 labeling). Slices containing filled PCs were incubated in 10% and 20% sucrose as a cryoprotectant, repeatedly freeze-thawed above liquid nitrogen, embedded in agarose (2%), and resectioned at 70 – 90 µm thickness.
Slices containing filled INs were immunolabeled without resectioning.
Sections/slices were washed in 0.1 M PB and blocked in normal goat serum (NGS, 10%) for 1 h made in Tris-buffered saline (TBS; pH 7.4), incubated in the following primary antibodies: mouse anti-PV (1:1000, RRID:AB_10000343; Swant); rabbit anti-PV (1:1000, RRID:AB_1210396; Synaptic Systems), guinea pig anti-mGluR1α (1:1000, RRID:AB_2531897; Frontier Institute; Mansouri et al., 2015), or rabbit anti-Elfn1/2 (1:500, RRID:AB_1079280; Sigma-Aldrich) diluted in TBS containing 2% NGS. After several washes, the following secondary antibodies were applied: Alexa Fluor 488- or Cy5- conjugated goat antimouse or goat anti-rabbit and Cy3-conjugated donkey anti-guinea pig IgGs. Biocytin was visualized with Alexa Fluor 488-conjugated (Invitrogen) or Cy5- conjugated (Jackson Laboratories) streptavidin (1:500). Sections were mounted in Vectashield (Vector Laboratories). Image stacks including the measured axon segment were acquired with an Olympus FV1000 confocal microscope with 20X and 60X (oil-immersion) objectives. The measured boutons were then identified based on superposition of the 2P and post hoc acquired confocal image stacks. Contacts between PC boutons and IN dendrites were considered as putative synapses if they had no apparent gap between them in the focal plane.

![Figure 9. ML spike physiological model and algorithm: Upon emission of s(t) spikes, intracellular [Ca 2+ ] C(t) is driven by an increase A (the unitary calcium response) X s(t), then decays to the resting value with time constant τ](https://thumb-eu.123doks.com/thumbv2/9dokorg/1370293.112245/26.918.128.796.280.580/figure-physiological-algorithm-emission-intracellular-increase-response-constant.webp)