Villages on the Edge of Extinction - the Hungarian Situation
Zsófia ILCSIKNÉ MAKRA1, Péter BAJMÓCY1, András BALOGH2
1 University of Szeged, Department of Economic and Social Geography, Szeged, HUNGARY
2 Eötvös Loránd University, Savaria University Centre, Szombathely, HUNGARY
E-mail: makra.zsofia@geo.u-szeged.hu, bajmocy@geo.u-szeged.hu, balogh.andras@sek.elte.hu
DOI: 10.24193/JSSP.2018.1.04 https://doi.org/10.24193/JSSP.2018.1.04
K e y w o r d s: small villages, Hungary, depopulated settlements, regional differences, urbanization, functionality loss
A B S T R A C T
1. INTRODUCTION
One of the most interesting settlement types in Hungary is the small village, that is the village with less than 500 inhabitants. One third of the Hungarian settlements are small villages, but they include only 3%
of the total population. Their disadvantageous situation is well-known because of the lack of public services, low-quality infrastructure, poor traffic connections, and old or deprived and declining population. The smaller a village is the worse its situation becomes. Because of these unfavourable processes, some of the Hungarian villages are today at the edge of extinction. However, some of these villages have been refurbished in the last two decades with new functions (tourism, suburbanization, eco-village). Therefore, we argue that while some villages are in a very disadvantaged position other villages are in much better situation today. First
we summarize those factors, which determine the past and present situation and development of small villages in Hungary. Than we try to classify the Hungarian extremely small villages by population changing trends and analysing the geographic location of these groups to find the different ways of development of small villages nowadays. The future of the extremely small villages is not pre-determined; rather their future evolution will depend on their location, functions, local elite, ethnicity, etc.
2. THEORY AND METHODOLOGY 2.1. A general view of small villages
In the Hungarian settlement geography we use the term ’small village’ for the villages with less than 500 inhabitants [1], [2], [3], [4]. In Hungary one third Centre for Research on Settlements and Urbanism
Journal of Settlements and Spatial Planning
J o u r n a l h o m e p a g e: http://jssp.reviste.ubbcluj.ro
Urbanization trends in Hungary have been similar during the last decades to those of other Central and Eastern European countries.
After 40-50 years of mass-urbanization the phase of suburbanization started. We could see out-migration from villages, especially from small ones. Because of this large-scale out-migration the residual population of these villages became older, so we can see that out- migration and natural decrease are parallel nowadays. In some cases the population decline of these small villages became critical; the population of more than 40 villages in Hungary is less than 25, according to the census of 2011. Because of the changing administrative structure, we can see those villages which were independent administrative units by the 1910 Hungarian Census irrespectively of these villages are administrative units (some of the Hungarian small villages) or not (the other part of Hungarian villages) nowadays. The area of investigation is Hungary. We could have a look at the ways and the types of decline by the reason of underpopulation, by clusters of population change and by size of these settlements. Most of the villages had steep decline of population during the last century, but in some of them we could see that the trends are changing. Because of the natural increase and the new functions (eco-village, tourism, suburbanization, counter-urbanization), the population is stable or increasing now. By the clusters of these villages we could create clear types of small villages and their geographic distribution is also understandable.
of all settlements are small villages. The small villages form complex areas, representing altogether 8% of the total territory of Hungary. On the other hand, in Hungary less than 3% of the total population lives in small villages. Small villages can be found especially in the regions where the number of other low populated villages is significant, that is especially in Western and Southern Transdanubia and in the Northern Hungarian counties. This fact highlights the possible extension areas. It may also prove that the increase in the number of these villages has been caused by the decrease of population of villages between 500 and 1000 inhabitants. We can find most of the small villages in West Hungary (Vas and Zala counties), Southwest Hungary (Baranya and Somogy counties) and North Hungary (Borsod-Abaúj-Zemplén and Szabolcs- Szatmár-Bereg counties). When examining the state of supply, transport, economy, jobs and age-structure, it could be argued that most of these villages are in a disadvantaged situation. As the number of small villages has been constantly increasing for decades, the number of geographical researches in this field has been growing as well, not only in Hungary but also in other post-socialist countries. A number of these studies called attention to the negative consequences of the former state development policy [5], [6], [7], [8].
Several other studies were conducted about unfavourable demographic processes [1], [9], [10], and depopulation in Hungary and other Central and Eastern European countries [11], [12], [13]. Further, a lot of studies were carried out about the types of settlements in general [4], [14], [15], and the differentiation process of villages using quantitative methods [16], [17], [18].
Previous studies also highlighted the local social problems [3], [19], [20], [21], [22], the negative features of social, institutional [23], [24], [25] and traffic systems [26], or the disadvantageous situation all together [6], [27], [28]. The political regime change had a great effect on the villages due to the economic changes like unemployment [29], [30], relationship of settlements [8], [31] and the decreasing importance of agriculture [32], [33]. Finally, a great number of publications examined the functions of local authorities and tourism in small villages [34], [35], [36].
Most of the studies deal with small villages as a homogeneous group. But this group of settlements has never been homogeneous [2], [37], [38]. The extent of difference has changed a lot during its short history and the importance and order of the factors that caused changes, too. In the 1950s and 1960s the basis of difference was the economic function, however in the 1970s and 1980s it depended on the measurement of settlements and other joint factors like fundamental provision and advanced stage. After the political regime change lots of areas of society and economy have changed, forming consequently the spatial and settlement structures. It means that the geographical
location has become more important than the measurement of settlements. The inducing factors of the increasing inequalities among settlements were the following: general recession of economy, increasing unemployment and inactive households, changes in the job market and the emergence of new forms of poverty [39], [40].
2.2. The evolution of small villages over the last few decades
Before giving an illustration about results of these studies, it’s necessary to look into the recent history of small villages, with special regards to development policy, economy and life conditions. It is well-known that small villages have been the most disadvantageous elements of the Hungarian settlement system during the last fifty years [10], [14], [21]. Their unfavourable situation has originated not only from their measurement, but also from their negative discrimination by the development policy. The socialist village model of the fifties in Hungary classified them as non-viable settlements and later, in 1971, the National Settlement Network Development Concept essentially labelled small villages as ”settlements without functions”. Moreover, municipal action plans referred to small villages as a category of settlements either disappearing or to be phased out. Bordering small villages had been organized to collective councils in Hungary, and had been decreasing their sources of income continuously. In Hungary in 1985, parliamentary decision stopped the functional distinction of settlements. The finances were to be more proportionately distributed between towns and villages.
The first collectivization of agriculture came to light in 1948-1949 in Hungary. Consequently, the agricultural workers and the unproductive small landowners became collective farmers at first [8].
The average territories and livestock of collective farms were very small. In the 1960s the most important process in agriculture was the reorganization of large-scale production and the strengthening of farming, so large number of former agricultural workers left the villages. In the 1970s agriculture recorded the most dynamic growth. Wages in this sector grew during the next decade. Some rural development was continuing after the war. Life conditions and infrastructural conditions (electrification, road- building, culture centre and library-building, etc.) were getting better in the 1960s in Hungary. During the next years in Hungary, household plots were used for subsistence, while the rural population commuted to urban settlements for salaried work. By the 1970s, rural incomes almost matched those in urban areas thanks to the growth of the agricultural sector. But, by the mid 1980s conditions for small villages became intolerable, and many were on the verge of physical disintegration.
The economic problems of Hungary (running into debt, over-employment, faulty economic policy, crisis of agriculture) had all risen to the surface.
The change of the economic and political system introduced a local governmental system with great freedom of decision at the municipal level in Hungary. In the euphoria of the regime change everybody expected rapid and positive changes.
However, the socialist agriculture collapsed and many commuter workers lost their jobs due to the crisis also affecting the manufacturing industry. Many rural inhabitants sank into poverty. Public institutions were forced to scale down on the basic services. Nowadays, the local economic power of small villages is insignificant; their regional integrative and contact- making ability is also moderate. So, in reality, small villages are rather the losers than the winners of transition [41], [42].
Similar urbanization trends are visible in other countries in Central Europe. Because of the small population, the infrastructure tends to be underdeveloped in the small villages. This has led to a rapid out-migration of rural population after 1945. Most villages are characterized today by declining functions, older population, lack of jobs and inadequate transport conditions. The situation in the smallest villages is the worst. These problems are not peculiar to Hungary; the situation is very similar in other Eastern and Southern European countries [12], [43], [44], [45]. Often under population is critical as villages could die out in time [46], [47].
There are great regional differences in the development of small villages in Hungary. The most developed small villages can be found near Lake Balaton where they can make profit from tourism and in the more prosperous Middle- and West Transdanubia where the job market and salary conditions are excellent. There is another group of settlements, namely the ones that lie near big cities and consequently they are geographically easily accessible.
These are becoming suburban settlements.
The least prosperous 20 small villages can be found in Borsod-Abaúj-Zemplén and Baranya counties.
They are of two main types: 1) the least populated, with an aging population (these villages have the worst values in all the indexes) and 2) the gradually rejuvenating settlements where the most of the young population belong to a gipsy community [48]. Their local governments face numerous problems. Most of their budget is spent on social benefits and institutional costs, and they can only rely on financial support from the state [2], [14].
2.3. Methods
The local administrative structure of Hungary is special. In Hungary, usually all the settlements
(towns and villages) are administrative units. On the other hand, in Hungary within an administrative unit we have population data of the core settlement (village or town), other inner parts and the outskirts. Other inner parts are usually those small villages, which were sometimes administrative units before, but joined to a larger settlement. Anyway more than 80% of the administrative units in Hungary in the early years of the 20th century were still administrative units [49].
As a common base for the research we chose the settlement system of Hungary at the time of the census of 1910. We included those settlements (villages) which were administrative units at the time of the 1920 census in Hungary, regardless of their status today.
Therefore, the area of our research is the whole territory of Hungary. Altogether we had 3453 settlements. We used the population data of settlements by the census in 1910, 1920, 1930, 1941, 1949, 1960, 1970, 1980, 1990, 2001 and 2011. We used the demographic data and also websites, literature and carried out some fieldwork. Of special interest for us were those villages with less than 25 inhabitants. For better understanding we compared these extremely small settlements (under 25 inhabitants) with those villages which have a population of less than 250.
In order to compare the settlements, we run a cluster analysis of population changes for the smallest settlements in Hungary between the censuses mentioned above. Using cluster analysis to specify village types is relatively common, but most of these analyses generally employ social and economic indicators [2], [16], [17], [18]. We used the population change data of villages between 1910-1949, 1949-1970, 1970-1990 and 1990-2011 to classify the villages, which is a novel idea. We gathered all the data for the 652 settlements with population less than 250 between 1910 and 2011. We used SPSS 20 and Mapinfo 10.5 in this part of the research.
3. RESULTS AND DISCUSSION
3.1. Number and population change of the smallest villages in Hungary
There are 652 villages in Hungary where the population dropped under 250 inhabitants sometimes during the 20th or the 21st century, including 41 where it dropped under 25 (Table 1).
Among them there are four special villages, where the population has actually increased over the last two decades, and their population exceeds now 25 inhabitants. The multiplying number of very small villages is also common in other regions of Central- Europe [51].
In Hungary most of these villages (under 25) are in the counties of Zala (11), Baranya (11), Borsod- Abaúj-Zemplén (7) and Vas (4) (Table 2).
Table 1. Number of villages recording a population of less than 25 individuals during the 20th century in Hungary.
Census Nr. of villages
1949 1
1960 1
1970 2
1980 12
1990 23
2001 29
2011 37
Source: Own calculation based on data provided by KSH (Hungarian Central Statistical Office, HCSO) [50].
Table 2. Number of villages recording a population of less than 25 and 250 individuals during the 20th century in Hungary, by counties.
Administrative units Under 25
Under 250
Baranya 11 154
Bács-Kiskun 0 2
Békés 0 3
Borsod-Abaúj-Zemplén 7 92
Csongrád 0 0
Fejér 1 4
Győr-Moson-Sopron 1 25
Hajdú-Bihar 0 3
Heves 0 4
Jász-Nagykun-Szolnok 0 1
Komárom-Esztergom 0 2
Nógrád 1 21
Pest 0 1
Somogy 0 60
Szabolcs-Szatmár-Bereg 1 17
Tolna 2 16
Vas 4 77
Veszprém 2 52
Zala 11 118
Total 41 652
Source: Own calculation based on data provided by KSH (Hungarian Central Statistical Office, HCSO) [50]
There are almost no such villages in the Hungarian Plain (Bács-Kiskun, Csongrád, Békés, Jász- Nagykun-Szolnok, and Hajdú-Bihar counties) or in Central-Hungary (Pest, Fejér, Heves, and Komárom- Esztergom counties). Most of these extremely small villages are in hilly areas, in the small regions of Őrség, Hetés, Göcsej, Zselic, East-Mecsek Hills, Aggtelek- Karszt and Cserehát (Fig. 1). Most of the villages with less than 250 inhabitants have local governments
except for 95 of them which have not. These villages lost the local government function sometime between 1900 and 1990.
Fig. 1. Settlements recording a population of less than 250 individuals in the 20th century in Hungary, by status (small - less than 250 individuals, extra small – less than 25 individuals). Source: Own calculation based on data provided by KSH (Hungarian Central Statistical Office, HCSO) [50].
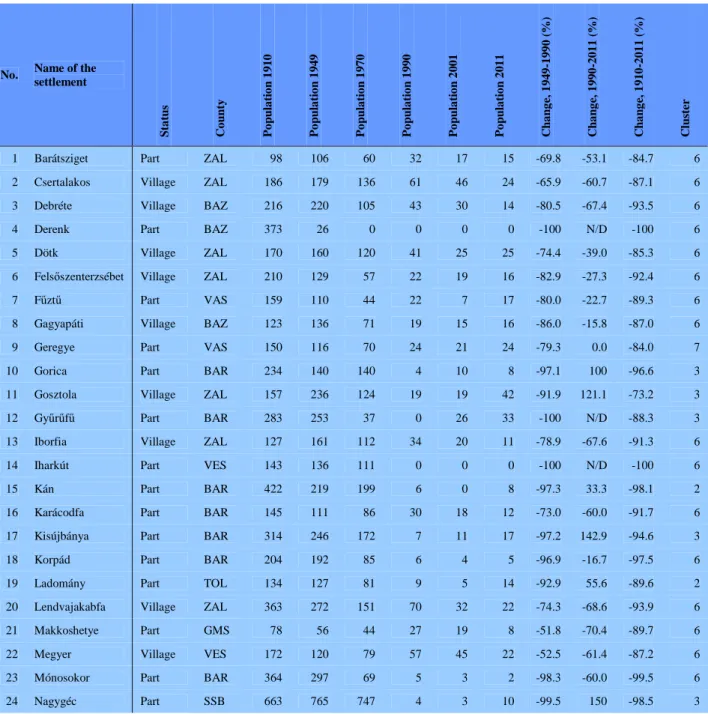
In 1910 all villages in Hungary had a population greater than 50. The least populated villages in 1910 were Simaháza (Vas) in Hungary with 54 inhabitants, followed by Makkoshetye (Győr-Moson- Sopron, 78). It is interesting that the distance between the two smallest settlements (Simaháza and Makkoshetye) is only 1.3 km. The increase in the number of extremely small villages was slow until the 1970’s. At the end of the 1960’s there were only two such small villages in Hungary. Because of the mass- urbanization in Hungary the number of the extremely small villages started to grow rapidly in the 1970’s (Table 1). At the end of the 1970’s there were 12, at the end of 1980’s 23, at the end of 20th century 29 and in 2011 37 extremely small villages in Hungary. There are 41 villages in Hungary where the minimum population was smaller than 25 between 1910-2011, and 13 (most in Baranya) with the minimum population of less than 10 while six such villages have already died out in Hungary (Table 3). Most of the smallest ones reached the population minimum in 2011, but there are some exceptions. In Hungary the most interesting example is Gyűrűfű with 0 population in 1980 and 1990 and 33 in 2011. But we can see a significant increase of the population in Kisújbánya as well (1980: 3, 1990: 7, 2001: 11, 2011: 17). In Hungary one village died out in the 1940’s, three in the 1970’s and two in the 1990’s.
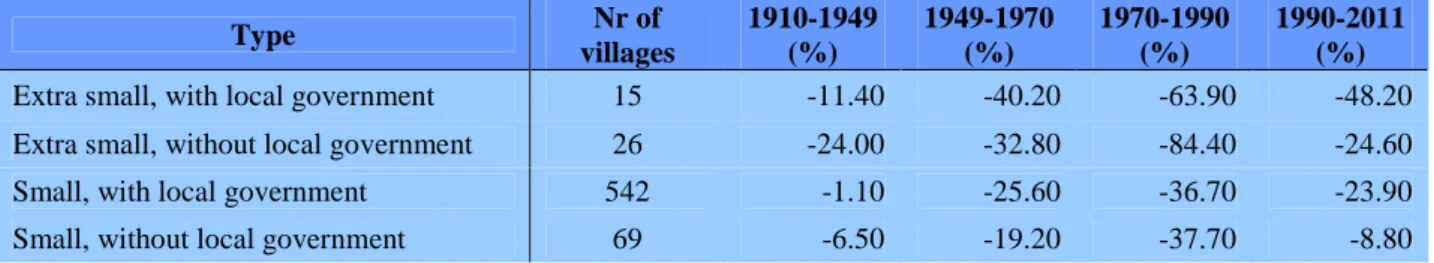
We can see a sharp decline of the population during the 20th century for most of these small villages.
Only 11 of them (less than 2%) had a population increase between 1910 and 2011 while 78% of them halved their population. The strongest population decline was between 1970 and 1990, but we can see decline of population during the entire 20th century and 21st century. After the change of the political regime in
1990 the decline continued, albeit at a slower pace (Fig.
2, Table 4). In order to compare the settlements, we created a cluster analysis using population change between different periods. We did this for the smallest settlements in Hungary and the periods selected are 1910-1949, 1949-1970, 1970-1990 and 1990-2011. These periods represent the main socio-economic eras of Hungary (interwar period, harder and weaker two periods of Communism, and two periods after the change of the political regime (democracy). There is only one village in Cluster 1., Vorhota, a suburban village near Zalaegerszeg, with rapid population increase nowadays. The settlements in Fig. 3 are characterized by similar population change trends between 1990 and 2011 (Table 5). In order to get a better understanding we illustrated the eight clusters in
two separate figures. We can see a population increase or stagnation of the settlements in cluster 1, 2 and 3 during this period. When we look at clusters 2 and 3 we can see large decline of population before 1990. There are some settlements where the population dropped below 25, like Kán, Gyűrűfű, Kisújbánya, Gorica in Baranya county, Zsibrik and Ladomány in Tolna, Nagygéc in Szabolcs and Gosztola in Zala. Most of these settlements do not have local governments yet, except for Gosztola. Gosztola, Zsibrik and Gyűrűfű have seen population increases over the later period. The settlements of cluster 5 are a larger group with moderate decline before 1990 and stagnating population after 1990. We can find these settlements in almost all of the small village regions in Hungary.
Table 3. Villages recording a population of less than 25 inhabitants in the 20th-21st century in Hungary.
No. Name of the settlement
Status County Population 1910 Population 1949 Population 1970 Population 1990 Population 2001 Population 2011 Change, 1949-1990 (%) Change, 1990-2011 (%) Change, 1910-2011 (%) Cluster
1 Barátsziget Part ZAL 98 106 60 32 17 15 -69.8 -53.1 -84.7 6
2 Csertalakos Village ZAL 186 179 136 61 46 24 -65.9 -60.7 -87.1 6
3 Debréte Village BAZ 216 220 105 43 30 14 -80.5 -67.4 -93.5 6
4 Derenk Part BAZ 373 26 0 0 0 0 -100 N/D -100 6
5 Dötk Village ZAL 170 160 120 41 25 25 -74.4 -39.0 -85.3 6
6 Felsőszenterzsébet Village ZAL 210 129 57 22 19 16 -82.9 -27.3 -92.4 6
7 Fűztű Part VAS 159 110 44 22 7 17 -80.0 -22.7 -89.3 6
8 Gagyapáti Village BAZ 123 136 71 19 15 16 -86.0 -15.8 -87.0 6
9 Geregye Part VAS 150 116 70 24 21 24 -79.3 0.0 -84.0 7
10 Gorica Part BAR 234 140 140 4 10 8 -97.1 100 -96.6 3
11 Gosztola Village ZAL 157 236 124 19 19 42 -91.9 121.1 -73.2 3
12 Gyűrűfű Part BAR 283 253 37 0 26 33 -100 N/D -88.3 3
13 Iborfia Village ZAL 127 161 112 34 20 11 -78.9 -67.6 -91.3 6
14 Iharkút Part VES 143 136 111 0 0 0 -100 N/D -100 6
15 Kán Part BAR 422 219 199 6 0 8 -97.3 33.3 -98.1 2
16 Karácodfa Part BAR 145 111 86 30 18 12 -73.0 -60.0 -91.7 6
17 Kisújbánya Part BAR 314 246 172 7 11 17 -97.2 142.9 -94.6 3
18 Korpád Part BAR 204 192 85 6 4 5 -96.9 -16.7 -97.5 6
19 Ladomány Part TOL 134 127 81 9 5 14 -92.9 55.6 -89.6 2
20 Lendvajakabfa Village ZAL 363 272 151 70 32 22 -74.3 -68.6 -93.9 6
21 Makkoshetye Part GMS 78 56 44 27 19 8 -51.8 -70.4 -89.7 6
22 Megyer Village VES 172 120 79 57 45 22 -52.5 -61.4 -87.2 6
23 Mónosokor Part BAR 364 297 69 5 3 2 -98.3 -60.0 -99.5 6
24 Nagygéc Part SSB 663 765 747 4 3 10 -99.5 150 -98.5 3
25 Nagyhorváti Part ZAL 158 155 105 51 30 24 -67.1 -52.9 -84.8 6
26 Nemesmedves Village VAS 365 196 46 18 21 17 -90.8 -5.6 -95.3 6
27 Pusztakisfalu Part BAR 166 146 102 35 35 19 -76.0 -45.7 -88.6 6
28 Pusztaszántó Part NOG 176 134 83 21 11 7 -84.3 -66.7 -96.0 6
29 Pusztaszentpéter Part ZAL 133 63 19 2 2 2 -96.8 0.0 -98.5 6
30 Püspökszentlászló Part BAR 107 88 103 43 14 39 -51.1 -9.3 -63.6 5
31 Révfalu Part BAR 192 310 94 5 0 0 -98.4 -100 -100 6
32 Sima Village BAZ 187 171 78 24 19 21 -86.0 -12.5 -88.8 6
33 Simaháza Part VAS 54 45 38 0 0 0 -100 N/D -100 6
34 Szatina Part BAR 204 163 127 46 37 22 -71.8 -52.2 -89.2 6
35 Teresztenye Village BAZ 169 148 107 44 26 21 -70.3 -52.3 -87.6 6
36 Tornabarakony Village BAZ 266 269 189 54 28 13 -79.9 -75.9 -95.1 6
37 Tornakápolna Village BAZ 141 133 113 22 12 11 -83.5 -50.0 -92.2 6
38 Vakola Part ZAL 99 94 82 41 27 24 -56.4 -41.5 -75.8 7
39 Vérteskozma Part FEJ 463 170 149 28 20 10 -83.5 -64.3 -97.8 6
40 Zalaköveskút Village ZAL 155 134 104 47 30 23 -64.9 -51.1 -85.2 6
41 Zsibrik Part TOL 340 183 142 19 24 32 -89.6 68.4 -90.6 2
Source: Own calculation based on data provided by KSH (Hungarian Central Statistical Office, HCSO) [50]. BAR: Baranya, BAZ: Borsod- Abaúj-Zemplén, FEJ: Fejér, GMS: Győr-Moson-Sopron, NOG: Nógrád, SSB: Szabolcs-Szatmár-Bereg, TOL: Tolna, VAS: Vas, VES: Veszprém, ZAL: Zala counties, N/D: no data.
Table 4. Population change of villages recording a population of less than 250 individuals in the 20th-21st century in Hungary by status and periods (small – less than 250 individuals, extra small – less than 25 individuals).
Type Nr of
villages
1910-1949 (%)
1949-1970 (%)
1970-1990 (%)
1990-2011 (%)
Extra small, with local government 15 -11.40 -40.20 -63.90 -48.20
Extra small, without local government 26 -24.00 -32.80 -84.40 -24.60
Small, with local government 542 -1.10 -25.60 -36.70 -23.90
Small, without local government 69 -6.50 -19.20 -37.70 -8.80
Source: Own calculation based on data provided by KSH (Hungarian Central Statistical Office, HCSO) [50]
Table 5. Clusters of villages recording a population of less than 250 individuals in the 20th-21st century in Hungary by population change.
Cluster 1 2 3 4 5 6 7
8
No. of villages 1 14 6 137 140 85 261
8
1910-1949 ▼ ▼ ▼ ▲ 0 ▼ ▼
▲▲
1949-1970 ▲ ▼ ▼ ▼ ▼ ▼ ▼
▼
1970-1990 ▲▲ ▼▼ ▼▼ ▼ ▼ ▼▼ ▼
▼
1990-2011 ▲▲ ▲ ▲▲ ▼ 0 ▼▼ ▼
▼
Legend: ▲ Growth, ▲▲ Extreme growth, ▼ Decline, ▼▼ Extreme decline
Critically endangered
Source: Own calculation based on data provided by KSH (Hungarian Central Statistical Office, HCSO) [50].
There are other ways of population change at the other four clusters (Fig. 4). We can see population decline in almost all periods at the settlements of clusters 4, 6, 7 and 8. The exceptions are clusters 4 and 8, where there was a population increase before the WW II. The geographic distribution of these clusters is not special, they are occurring in all small village
regions of Hungary. There are a lot of critically endangered villages in cluster 6, with less than 25 inhabitants, so these villages are at the edge of extinction. The majority of these villages are in Zala (Bödeháza, Kerkakutas, Pusztaszentpéter, Zalaszombatfa) Borsod-Abaúj Zemplén (Égerszög, Gagyapáti, Perecse, Teresztenye) and Baranya counties
(Korpád, Mónosokor, Pusztakisfalu, Révfalu). The largest cluster with no spatial concentration is cluster 7.
Fig. 2. Population change of settlements recording a population of less than 250 individuals between 1910-2011 in Hungary. Source: Own calculation based on data provided by KSH (Hungarian Central Statistical Office, HCSO) [50].
Fig. 3. Clusters of settlements recording a population of less than 250 individuals by population change in Hungary, I. Source: Own calculation based on data provided by KSH (Hungarian Central Statistical Office, HCSO) [50].
Fig. 4. Clusters of settlements recording a population of less than 250 individuals by population change in Hungary, II. Source: Own calculation based on data provided by KSH (Hungarian Central Statistical Office, HCSO) [50].
3.2. Normal and special ways of the small villages
Most of the villages became under populated or almost under populated by the normal or natural way. It means that they were always small and their infrastructure inadequate. They also lacked jobs and underdeveloped transport facilities made commuting difficult. As the population aged, the process of natural population decline started. This process is characteristic to all small villages, but in Hungary it seems that the effects are more visible. There are also some instances in which natural population decline is not the main reason for depopulation. For example, some villages were abandoned after being hit by natural disasters. In 1970, rivers Tisza and Szamos flooded and dozens of villages in north-eastern Hungary were covered by water. Some of these villages were partially or entirely destroyed by this massive flooding. One village, Nagygéc, was not rebuilt and was abandoned by its population [52].
Another reason for population loss in small villages can be industrial activity. For example, within the limits of Iharkút village, in Veszprém county, bauxite was found and an open-field bauxite-mine was opened. The village was in the way, so it was demolished in the 1970’s. Under population because of a newly opened mine is not unprecedented in the world [53]. In some cases ethnic out-migration, could lead to depopulation of villages. In Hungary, near the Austrian border there is a small village, Nemesmedves which used to have an ethnic German population. After the Second World War most of its population was expelled and because it was very close to the strictly closed Austrian border, just a few Hungarians moved there.
Most of these Hungarian settlers moved out later, so the population now consist of only 20 inhabitants.
The strangest reason leading to village depopulation could be found at a small formerly ethnic Polish village, Derenk, situated in Northern Hungary.
Near the village, in the 1940s, the governor of Hungary had a small hunting palace. He wanted to create a bear hunting area, but the village was in the way.
Consequently, the village was destroyed and the population settled in different villages nearby and also in the Hungarian Plain. Nobody has lived in Derenk since then. While there are quite a lot of similarities connecting the past of these villages, there can be differences in their future [13]. We can predict three different ways these extremely small villages of Hungary could evolve in the future. The first way is the total physical destruction both in terms of population and in the built environment. Most of those villages, which died out in the early decades (1940s, 1970s, 1980s) are in this category. Sometimes just the churches or belfries remained; almost all the former houses disappeared.
Another possibility is a change of functions.
Although villages are depopulated, the buildings have remained in place and could be used as second homes to develop tourism. This is already happening in those villages boasting beautiful buildings, especially those that used to be inhabited by ethnic Germans, like Kisújbánya or Kán [54].
The third possibility is rebuilding the village anew. In this case both the population and the building environment are renewed. The best example for this type is the small village of Gyűrűfű in Baranya County.
Gyűrűfű was the first village in Hungary to become depopulated in an organic way in the 1970’s. Not only the population dropped to zero, but the whole physical environment disappeared. In the 1990’s a new eco- village started to be built there. The village has reached today a population of about 30. Most of the inhabitants came from big cities (Budapest, Pécs) and engaged in eco-agriculture, eco-tourism, using environmentally friendly building materials and sewage and heating systems. All houses in the village are new [55], [56], [57], [58].
4. CONCLUSION
During the 20th century the number of extremely small villages increased in Hungary. Because of the mass urbanization and the disadvantaged situation of small villages, the population of some settlements declined dramatically. We could see the fastest population decline in the 1970s and 1980s. After the change of the political regime around 1990 the above-mentioned processes also started to change. Of course, some small villages are still losing population, but other villages found ways to reverse this process.
There are different ways for population change and different future paths for the extremely small villages in Hungary. We used the demographic data of all 652 small villages in Hungary collected at the censuses taken between 1910 and 2011. Using the population change trends in different periods and a cluster analysis with these data we could describe the groups of small villages in Hungary. This method was proven adequate, as it allowed us to separate the different ways of transition and to classify the similar villages. The trends are similar to the small villages of nearby countries, characterized by an initial steep decline of population in most of the villages which was stopped in the late decades of the 20th century and the early years of the 21st century.
The most important factor that could be decisive in stopping and even reversing population decline is geographic location; some villages situated near cities or larger towns or with touristic facilities are in better situation now. The reason for the population increase can also be the natural increase especially in the villages with large Roma population. On the other
hand, the location is just one factor; there are small villages situated near towns which continue to be affected by population decline and there are also villages situated in peripheral areas yet which have managed to reverse the migratory flows. Despite the disadvantageous processes during the last decades there are very few totally depopulated villages (only 6 in Hungary), a situation that is similar to that of other countries in the region. The smallest villages show the most different ways, in connection with the different local conditions, from the renewing eco-villages and second-home villages to the disadvantaged villages with uninhabitable housing conditions at the edge of extinction.
REFERENCES
[1] Bajmócy, P., Boros, L. (2005), Az aprófalvak népesedése 1949-től napjainkig [Population trends of small villages from 1949 to till now]. In: Csapó, T., Kocsis, Zs., Lenner, T. (eds.) A településföldrajz helyzete és főbb kutatási irányai az ezredforduló után. I.
Településföldrajzi Konferencia, Szombathely, pp. 61-79.
[2] Balogh, A. (2008), Az aprófalvas településállomány differenciálódási folyamatai Magyarországon [Differentiation process of small villages in Hungary]. Savaria University Press, Szombathely, 105 p.
[3] Enyedi, Gy. (1980), Falvaink sorsa [Faith of the Hungarian villages]. Magvető Kiadó, Budapest, 185 p.
[4] G. Fekete, É. (2006), Aprófalvak átalakulóban [Small villages in transition], III. Településföldrajzi Konferencia, Szombathely, pp. 24-37.
[5] Enyedi, Gy. (1984), Az aprófalvak szerepe a társadalmi munkamegosztásban [Importance of small villages in social division of labour], In: Sükösd, F. (ed.) Az aprófalvak közélete és ifjúsága. KISZ Baranya megyei Bizottsága, Pécs, pp. 16-22.
[6] Enyedi, Gy. (1985), A magyar településhálózat átalakulása [Change of the Hungarian settlement system]. In: A falu, 1, 1, pp. 15-22.
[7] Mohos, M. (1996), Az ötszáz főnél kisebb népességű falvak szociálgeográfiai vizsgálata [Social geography of the villages with less than 500 inhabitants], In: Vuics, T. (ed.) Válogatott tanulmányok Magyarország társadalomföldrajzából. Egyetemi jegyzet, Pécs, pp. 15-42.
[8] Surd, V. (2010), Rural space regeneration in Romania. In: Journal of Settlements and Spatial Planning, vol. 1, issue 1, pp. 1-8. Available at:
http://geografie.ubbcluj.ro/ccau/jssp/arhiva1_2010/01 JSSP012010.pdf. Last accessed: May, 28, 2018.
[9] Csapó, T. (1991), A népességszám alakulása a Nyugat-Dunántúl falusi településeiben [Population change trends of the villages at Western-Transdanubia], In: Kovács, T. (ed.) Válság és kiút. Falukonferencia.
MTA RKK Pécs 99, pp. 109-116. Available at:
http://www.regscience.hu:8080/xmlui/handle/11155/1 456. Last accessed: May, 28, 2018.
[10] Vuics, T. (1996), Életkörülmények és területi egyenlőtlenségek Magyarországon [Life circumstances and regional inequalities in Hungary]. In: Vuics, T. (ed.) Válogatott tanulmányok Magyarország társadalomföldrajzából. Egyetemi jegyzet, Pécs, pp. 177- 250.
[11] Babović, S., Lović, Obradović, S., Prigunova, I. (2016), Depopulation of villages in Southeastern Serbia as hindrance to economic development. In: J.
Geogr. Inst. Cvijic, 66, 1, pp. 61–74. Available at:
https://www.researchgate.net/publication/303036160 _Depopulation_of_villages_in_southeastern_Serbia_a s_hindrance_to_economic_development. Last accessed: May, 28, 2018. DOI: 10.2298/IJGI1601061B [12] Mladenov, C., Ilieva, M. (2012), The depopulation of the Bulgarian villages, In: Bulletin of Geography. Socio–economic Series 17, pp. 99–107.
DOI: http://dx.doi.org/10.2478/v10089-012-0010-8 [13] Yarkova, Y., Totev, S., Mutafov, E. (2016), Measures against the Depopulation of the Bulgarian Village: Attitudes and Motives for Migration. In:
Economic Studies 2, pp. 129-156. (in Bulgarian with English summary) Available at: https://www.ceeol.
com/search/article-detail?id=3559 95. Last accessed:
May, 28, 2018.
[14] Bajmócy, P., Balogh, A. (2002), Aprófalvas településállományunk differenciálódási folyamatai [Differentiation process of small villages in Hungary].
In: Földrajzi Értesítő 3-4, pp. 385-405. Available at:
http://www.mtafki.hu/konyvtar/kiadv/FE2002/FE200 23-4_385-405.pdf. Last accessed: May, 28, 2018.
[15] Beluszky, P. (1977), Krasznokvajda – egy alsófokú központ (?) gondjai a Csereháton [Krasznokvajda – a local centre at Cserehát Hills]. In:
Földrajzi Értesítő 26. évf. 3-4, pp. 349-386.
[16] Beluszky, P., Sikos, T. T. (1982), Magyarország falutípusai [Village types of Hungary], MTA FKI Budapest, 167 p.
[17] Beluszky, P., Sikos, T. T. (2007), Változó falvaink. Magyarország falutípusai az ezredfordulón [Changing villages. Village types in Hungary at the turn of the millennium], MTA Társadalomkutató Központ, Budapest, 459 p.
[18] Tóth, K. (2000), A falusi életkörülmények változása Magyarországon [Changes of rural life circumstances in Hungary]. In: Geográfus doktoranduszok IV. országos konferenciája konferenciakötete (CD), SZTE, Szeged.
[19] Cabras, I. (2011), Community Cohesion in Rural UK: The Case of Rural Co-operatives and their Potential for Local Communities. In: Regional Studies Association International Conference: Regional Development and Policy-Challenges, Choices and Recipients 4, pp. 17-20. Available at:
http://citeseerx.ist.psu.edu/viewdoc/download?doi=10
.1.1.225.9997&rep=rep1&type=pdf. Last accessed: May, 28, 2018.
[20] Cabras, I. (2013), The potential for rural cooperatives in the UK. In: Bosworth, G. and Somerville, P. [editors] Interpreting Rurality:
Multidisciplinary Approaches. Routledge, Abindon, United Kingdom, pp. 54-70.
[21] G. Fekete, É. (2009), Aprófalvak és szegénység [Small villages and poverty], Romakutató Központ, Miskolc, pp. 1-9.
[22] Weekley, I. (1988), Rural Depopulation and Counterurbanisation: A Paradox. In: Area 2, pp. 127- 134. Available at: http://www.jstor.org/stable/
20002571. Last accessed: May, 28, 2018.
[23] Bank, K., Rudl, J., Szentmarjay, D. (2004), Falvak a rendszerváltás után a Dél-Dunántúlon [Villages after the change of political regime at South Transdanubia]. In: Csapó, T., Kocsis, Zs., Lenner, T.
(eds.) A településföldrajz helyzete és főbb kutatási irányai az ezredforduló után. I. Településföldrajzi Konferencia, Szombathely, pp. 80-89.
[24] Kőszegfalvi, Gy. (1985), Az aprófalvak ellátottságának kérdései [Some supply issues of the Hungarian small villages]. In: Sükösd, F. (ed.) Az aprófalvak közélete és ifjúsága, Pécs, pp. 208-216.
[25] Pătrăţanu, P. (2013), Small Villages in Cerna Mountains – Isolation or Blessing? In: Journal of Settlements and Spatial Planning, vol. 2, Special Issue, pp. 227-233. Available at: http://geografie.ubbcluj.ro /ccau/jssp/arhiva_si2_2013/06JSSPSI022013.pdf.
Last accessed: May, 28, 2018.
[26] Erdősi, F. (1985), A törpefalvak közlekedési ellátottsága [Traffic supply of extreme small villages], In: Sükösd, F. (ed.) Az aprófalvak közélete és ifjúsága, Pécs, pp. 227-233.
[27] Bajmócy, P., Józsa, K., Pócsi, G. (2007), Szélsőséges aprófalvak. Aprófalvak a településlisták végein néhány társadalmi-gazdasági mutató alapján [Extreme small villages. Small villages on the edges of settlement lists by some social-economic data], In:
Csapó, T., Kocsis, Zs. (eds. ) A kistelepülések helyzete és településföldrajza Magyarországon. III.
Településföldrajzi Konferencia, Szombathely, pp. 83- 101.
[28] Bednaříková, Z., Trávníček, Z., Vávra, V.
(2006), Regional differentiations of rural villages in the Czech Republic. In: Agric. Econ. – Czech, 52, pp. 273- 280. DOI: https://doi.org/10.17221/5024-AGRICECON [29] Dövényi, Z., Tolnai, Gy. (1991), A falusi munkanélküliség néhány kérdése Magyarországon [Some issues of rural unemployment in Hungary]. In:
Kovács, T. (ed.) Válság és kiút. Falukonferencia. MTA RKK Pécs, pp. 102-108. Available at:
http://www.regscience.hu:8080/xmlui/handle/11155/1 456. Last accessed: May, 28, 2018.
[30] G. Fekete, É. (2004), Munkanélküliség és foglalkoztatási viszonyok az aprófalvas térségekben:
Van-e esély a megmaradásra? [Unemployment and employment conditions in the regions with small villages: Is there any chance of persistency?] In: Pritz, P. (ed.) A tudomány a gyakorlat szolgálatában: a foglalkoztatási szint bővítésének korlátai és lehetőségei.
MTA, Budapest, pp. 55-85.
[31] Turnock, D. (1991), The Planning of Rural Settlement in Romania, In: The Geographical Journal 3, pp. 251-264. Available at: http://www.jstor.org/
stable/635500. Last accessed: May, 28, 2018.
[32] Csatári, B. (1991), Tétova települések a térben [Hesitant villages in space]. In: Kovács, T. (ed.) Válság és kiút. Falukonferencia. MTA RKK Pécs, pp. 273-276.
Available at: http://www.regscience.hu:8080/xmlui/
handle/11155/1456. Last accessed: May, 28, 2018.
[33] Nemes Nagy, J. (1993), A városi gazdasági átalakulás hatása a falvakra [Effect of urban economic changes to the villages]. In: Kovács, T. (ed.) Kiút a válságból. II. Falukonferencia. MTA RKK Pécs, pp. 24- 29. Available at: http://hdl.handle.net/11155/1457. Last accessed: May, 28, 2018.
[34] Bajmócy, P., Balogh, A. (2002), Az aprófalvak turizmusa – kiút vagy zsákutca? [Tourism of small villages – way out or cul-de-sac?]. In: Kutatás a turizmusban. A turizmus aktuális kérdései Magyarországon. Pécsi Tudományegyetem Turizmus Tanszék, Pécs, pp. 195-209.
[35] Hajdú, E. (1999), A turizmus főbb termékei és szolgáltatásai [Main products and services of tourism], Külkereskedelmi Főiskola, Budapest, pp. 86-87.
[36] László, M. (1996), Önkormányzatok Magyarországon 1990 – 1995 között [Local governments in Hungary between 1990 and 1995]. In:
Vuics, T. (ed.) Válogatott tanulmányok Magyarország társadalomföldrajzából. Egyetemi jegyzet, Pécs, pp. 157- 176.
[37] Balogh, A. (2006), Az aprófalvasodás folyamatának főbb jellemzői Magyarországon [Main characteristics of the small villages phenomena in Hungary]. In: Földrajzi Közlemények 130. (54.) 1-2, pp.
67-79.
[38] Balogh, A. (2015), Aprófalvak és majorok:
településföldrajzi hasonlóságok és különbségek [Small villages and manors: similarities and differences in settlement geographic view]. In: Településföldrajzi Tanulmányok, Szombathely, 2, pp. 24-43.
[39] Andorka, R. (2003), Bevezetés a szociológiába [Introduction to sociology]. Osiris Kiadó, Budapest, 662.
[40] Kovách, I. (2002), A posztszocializmus vége [The end of post-socialism]. In: Kovách, I. (ed.) Hatalom és társadalmi változás, Napvilág Kiadó, Budapest, pp. 7-21.
[41] Vaishar, A., Kallabova, E., Zapletalova, J.
(2003), New prosperity for marginal regions in Moravia, In: Geographia Polonica, vol. 76, issue 1, pp.
165-176. Available at: http://rcin.org.pl/igipz/Content
/109/WA51_213_r2003-vol76-no1_Geogr-Polonica.
pdf#page=169. Last accessed: May, 28, 2018.
[42] Bajmócy, P., Balogh, A. (2012), Extreme small villages in Hungary and Transylvania – a comparative study. In: Geographica Timisiensis, vol.
21, issue 2. Available at: https://geografie.uvt.ro/wp- content/uploads/2015/06/2_Bajmocy-Balogh.pdf. Last accessed: May, 28, 2018.
[43] Stasiak, A. (1992), Problems of depopulation of rural areas in Poland after 1950, In: Landscape and Urban Planning, vol. 22, issue 2, pp. 161-175. Available at: https://www.sciencedirect.com/journal/landscape- and-urban-planning/vol/22/issue/2. Last accessed:
May, 28, 2018.
[44] Popescu, D-L. (2013), Rural Population in Romania. Development and Tendencies (2000 – 2010). In: Procedia Economics and Finance, vol. 6, pp.
120-127. DOI: 10.1016/S2212-5671(13)00123-8.
[45] Delgado Viñas, C. (2013), Population Dynamics of Spanish Mountain Areas: Case Study of Two Regions in the Cantabrian Mountains (Spain). In:
Journal of Settlements and Spatial Planning, vol. 2, Special Issue, pp. 207-217. Available at:
http://geografie.ubbcluj.ro/ccau/jssp/arhiva_si2_2013 /04JSSPSI022013.pdf. Last accessed: May, 28, 2018.
[46] Rey, V., Bachvarov, M. (1998), Rural settlements in transition – agricultural and countryside crisis in the Central-Eastern Europe, In:
GeoJournal, vol. 44, issue 4, pp. 345-353. Available at:
https://link.springer.com/content/pdf/10.1023%2FA%
3A1006850525893.pdf. Last accessed: May, 28, 2018.
[47] Ilieva, M., Mladenov, C. (2003), Changes in the rural areas in Bulgaria: processes and prospects. In:
Geographia Polonica, vol. 76, issue 1, pp. 97-110.
Available at: http://rcin.org.pl/igipz/Content/109/
WA51_213_r2003-vol76-no1_Geogr-Polonica.pdf#
page=101. Last accessed: May, 28, 2018.
[48] Szymańska, D., Biegańska, J., Gil, A. (2009), Rural areas in Poland in the context of changes in population age structure in 1996, 2001 and 2006. In:
Bulletin of Geography Socio–economic Series 12, pp.
91-107. DOI: http://dx.doi.org/10.2478/v10089-009- 0006-1
[49] Bajmócy, P., Makra, Zs., Vasárus, G. (2014), A közigazgatásilag önálló települések számának változása és a változások tipizálása Magyarországon [Change of the number of administrative independent villages in Hungary and the types of changes]. In:
Csapó, T., Kocsis, Zs. (eds.) Településföldrajzi Tanulmányok, Szombathely 1, pp. 36-49. Available at:
http://publicatio.bibl.u-szeged.hu/8324/1/mzs_pub_
2014.pdf. Last accessed: May, 28, 2018.
[50] *** Központi Statisztikai Hivatal (Hungarian Central Statistical Office, HCSO), Based on the 1910, 1920, 1930, 1941, 1949, 1960, 1970, 1980, 1990, 2001, 2011 population census data.
[51] Ropa, M. (2017), A presence more and more visibile – The very small villages from the depression of Beiuș, Romania. In: GeoJournal of Tourism and Geosites, vol. 20, issue 2, pp. 199-209. Available at:
http://gtg.webhost.uoradea.ro/PDF/GTG-2- 2017/252_Ropa.pdf. Last accessed: May, 28, 2018.
[52] Bajmócy, P., Balogh, A. (2014), Kihalás szélére sodródott falvak Magyarországon [Villages on the edge of extinction in Hungary]. In: Településföldrajzi Tanulmányok. Szombathely, 2, pp. 3-12.
[53] Askland, H. H. (2018), A dying village: Mining and the experiential condition of displacement. In: The Extractive Industries and Society, vol. 5, issue 2, pp.
230-236. DOI: https://doi.org/10.1016/j.exis.
2018.02.007.
[54] Abrams, J. B., Gosnell, H., Gill, N. J. &
Klepeis, P. J. (2012), Re-creating the rural, reconstructing nature: an international literature review of the environmental implications of amenity migration. In: Conservation and Society 3, pp. 270- 284. Available at: http://www.conservationandsociety.
org/text.asp?2012/10/3/270/101837. Last accessed:
May, 28, 2018.
[55] Borsos, B. (2013), The Eco-Village Concept in a Model Experiment in South-West Hungary. In: Journal of Settlements and Spatial Planning, vol. 4, issue 1, pp.
69-76. Available at: http://geografie.ubbcluj.ro/ccau/
jssp/arhiva_1_2013/08JSSP012013.pdf. Last accessed:
May, 28, 2018.
[56] Boyle, P., Halfacree, K., Robinson, V. (1998), Exploring Contemporary Migration, Longman Harlow, 282 p.
[57] Józsa, K. (2014), A magyarországi aprófalvak sikerességi tényezőinek vizsgálata [Investigating the success factors of Hungarian small villages], Doktori értekezés. Szeged. 167 p. Available at: http://doktori.
bibl.u-szeged.hu/2067/1/Jozsa_Klara_PhD.pdf. Last accessed: May, 28, 2018.
[58] Pinilla, V., Ayuda, M-I., Sáez, L-A. (2008), Rural Depopulation and the Migration Turnaround in Mediterranean Western Europe: A Case Study of Aragon. In: Journal of Rural and Community Development 3, pp. 1-22. Available at: http://journals.
brandonu.ca/jrcd/article/view/91. Last accessed: May, 28, 2018.