Magyar Tudományos Akadémia
Kísérleti Orvostudományi Kutatóintézet Európai Unió 1083 Budapest, Szigony u. 43. Kiválósági Központ
Tel.: (1) 210 9400 Fax: (1) 210 9423 http://www.koki.hu Postai cím: 1450 Budapest, Pf.: 67
Válasz Dr.Tamás Gábor opponensi véleményére
Először is hadd köszönjem meg Dr. Tamás Gábor egyetemi tanár úrnak, hogy az MTA doktora cimre benyújtott pályázatomban bemutatott eredményeket elegendőnek tartja e cím odaítéléséhez, és támogatja a nyilvános védést. Továbbá köszönöm az idejét és energiáját, amit a bírálat elkészítésére szánt.
Az opponens kérdéseire adott válaszaim:
1.Mi időzítheti a piramissejtek tüzeléséhez képest eltérő latenciájú interneuron akciós potenciálokat a gamma oszcillációk során?
Mivel minden gátlósejt tüzelését alapvetően a rájuk érkező serkentő bemenet határozza meg, amely a CA3 piramissejtek tüzelésétől ered, és a serkentő bemenetek fázisa nem tér el az egyes gátlósejttípusok közt (Oren et al., 2006), ezért úgy gondolom, hogy az egyes gátlósejtcsoportoknál megfigyelt eltérő akciós potenciál fázisok a gamma oszcillációhoz képest az eltérő integrációs tulajdonságokból fakad. Azaz abból, hogy milyen az egyes sejttípusok EPSP-akciós potenciál csatolása (Fricker and Miles, 2000).
Van-e korreláció az axon mentén mért pirmaissejt-interneuron távolság, az interneuronok membrán időállandói, a rájuk érkező monoszinaptikus EPSP-k latenciái, ill ezen EPSP-k kinetikája közt?
A kísérleteinkben mi az EPSC-k kinetikai tulajdonságait vizsgáltuk, EPSP-ékét nem.
Annyi biztosan megállapítható, hogy az interneuronok eltérő membrán időállandója döntő szereppel bír abban, hogy az egyes interneuronok a piramissejtekhez képest mikor
tüzelnek. Véleményem szerint a CA3 régión belül az axon mentén mért piramissejt- interneuron távolság nem befolyásolja döntően a monoszinaptikus EPSP-k latenciáját. A méréseink azt mutatják, hogy a gamma oszcilláció alatt a CA1 gátlósejtjei és a CA3 gátlósejtjei időben egyszerre kapják az EPSC-ket a CA3 piramissejtektől. Ez azt jelenti, hogy még két hippokampális régió közt meglevő az axonális távolság sem a legfontosabb paraméter, amely meghatározza egyes gátlósejtek tüzelésének az időzítését.
2. Az in vitro indukált oszcillációk stabilan fenntarthatók órákon át. Ismer-e ilyen tulajdonságokkal rendelkező oszcillációt?
In vivo a gamma oszcillációk általában rövid időtartalmúak, de egész agyban is kiváltható farmakológiai módszerekkel időben stabil oszcilláció (Sakatani et al., 2008), akárcsak agyszeleteben. Az időben stabilan fenntartható oszcilláció vizsgálatának célja, hogy egy adott idegsejt bemeneti és kimeneti tuljadonságait tudjuk azonos körülmények közt
tanulmányozni, és az így nyert ismereteket össze tudjuk hasonlítani más idegsejtek hasonló tulajdonságaival. Az általunk feltárt eredmények (Hajos et al., 2004, Oren et al., 2006) jól egyeznek azokkal az eredményekkel, amit a rövid ideig tartó gamma oszcillációk
tanulmámyozása közben kaptak Tengis Gloveli és munkatársai (Gloveli et al., 2005). Ezért szerintem nem hátrány, hanem inkább előny a reprodukálhatóság és összehasonlíthatóság szempontjából az időben stabil oszcillációk vizsgálata. De mindenképp tisztában kell lenni azzal, hogy ez egy modell, amely segítségével számos mechanizmus feltárható, de pl. ezen in vitro modelleknek az időbeni stabilitása nem vetthető össze az in vivo mért gamma oszcillációk időbeni lefutásával.
Elérhető-e a disszertációban vizsgált karbakolos modellnek megfelelő, de endogén neurotranszmitterrel, vagy azok kombinácijával kiváltható oszcilláció?
2
Uwe Heinemann professzor úr berlini laborjából származó megfigyelések alapján úgy tűnik, hogy kívülről adagolt acetilkolinnal gamma oszcillációk valóban kiválthatók hippokampusz-szeletben, amely oszcillációk igen hasonlóak a mi mérési körülményeink közt karbakollal indukált oszcillációkhoz (Decker et al., 2009; Fano et al., 2011). Továbbá megfigyelték, hogy az acetilkolin-észteráz gátlása önmagában is a gamma oszcillációk kialakulását eredményezheti hippokampusz-szeletben (Engel et al., 2002). Tehát endogén neurotranszmiterrel is létrehozható a gamma oszcilláció szeletben.
Lehetségesnek tartja-e, hogy a karbakol és az endogén kolinerg traszmisszió eltérő hatású a kosársejt típusok és az axo-axonikus sejtek axon terminálisain?
A legfrissebb adatok alapján nikotinikus acetilkolin receptorok lehetnek a PV-tartalmú gátlósejtek axonvégződésein, amelyek segítheti a GABA ürülést bizonyos körülmények közt (Tang et al., 2011). De mivel ez a nikotinikus hatás úgy tűnik elég rövid ideig tart, ezért valószínűleg az oszcilláció kezdeti fázisában lehet különbség aközött, hogy ha a karbakollal vagy acetilkolinnal váltunk ki oszcillációt, de tartós agonista applikáció mellett ez a különbség eltűnhet.
3. Mi lehet a szerepe a gamma ciklusok során tüzelő egyéb interneuronoknak? Milyen interneuronok közti kapcsolatok és glutamáterg csatolási mechanizmusok szabályozhatják a periszomatikus és a többi interneuron típus relatív tüzelését?
A nem publikált eredményeink szerint a dendritikus gátlósejtek képesek lehetnek az oszcilláció frekvenciáját szabályozni azáltal, hogy a piramissejtek dendritjeinek az
aktivitását kontrollálják. A gátlósejtek tüzelését alapvetően a serkentő szinaptikus inputjuk határozza meg, míg a rájuk érkező szinaptikus gátlás döntően nem befolyásolja a sejtek kimenetét a karbakollal indukált gamma oszcillációk alatt (Oren et al., 2006). Így azt gondoljuk, hogy az interneuronok közti kapcsolatok nem determinisztikusak az oszcilláció keletkezésének szempontjából. Ezzel jól egybecseng egy megfigyelés, miszerint ha a parvalbumin tartamú idegsejtekből szelektíven eltávolítják a GABA receptorok egyik alegységét, aminek a következtében a parvalbumin sejtekre érkező szinaptikus gátlás szinte teljesen megszűnik, a gamma oszcillációk ebben a génmódosított egérben nem változtak (Wulff et al., 2009). Tehát a gátlósejtek közti kapcsolatok normális működése nem előfeltétele a gamma oszcillációk kialakulásának és fenntartásának. A kísérleti
eredményeink alapján levonható az a következtetés, hogy a CA3 piramissejtektől eredő ritmikusan szinaptikus serkentés meghatározza minden típusú gátlósejt tüzelését. Az egyes interneuronok tüzelési fázisának a kialakításához hozzájárulnak az idegsejtek
membrántulajdonságai.
4. Az opponens véleménye szerint csak akkor vonhattam volna le azt a következtetést, hogy a gyorsan tüzelő kosársejtek működése elégséges feltétele az oszcilláció kialakításához, ha a DAMGO akkor is megszünteti az oszcillációt, ha az axo-axonikus sejtek kimenete is megszűnik.
Úgy gondolom, hogy ha az axo-axonikus sejtek kimenetét is megszűntetné vagy legalábbis tovább csökkentené a DAMGO kezelés, akkor nem tudunk különbséget tenni a gyorsan tüzelő kosársejtek és az axo-axonikus sejtek funkciója közt. Ha mindenkettő sejttípus kimenete gátlódik DAMGO kezelésre, akkor nem tudjuk szétválasztani a két idegsejt lehetséges szerepét. De mivel csak a gyorsan tüzelő kosársejtek kimenete gátlódott, míg az axo-axonikus sejteké nem, és az oszcilláció mégis csökkent, miközben az idegsejtek működése de-szinkornizálódott, tehát a csökkent kosársejt és axo-axonikus kimenet nem tudta a szinkron aktivitást fenntartani, így azt gondolom jogos levonni a következtetést, miszerint a gyorsan tüzelő kosársejtek működése egyedül is elégséges az oszcilláció kialakulásához.
Az oszcillációs tevékenység kialakulásához a jelölt adatai szerint a periszomatikus áramgenerátor funkció esszenciális. Ha figyelembe vesszük a gyorsan tüzelő és az axo- axonikus sejtek által kialakított szinapszisok számában a kosársejt dominanciát, érdekes
3
lehet, hogy elméletileg elegendő áramsűrűséget biztosíthat-e a fenti kísérleti variációk esetén egymagában az axo-axonikus vagy a kosársejt komponens, vagy csak a kettő kombinációja hatékony.
Egyetlen gyorsan tüzelő kosársejt ill. egyetlen axo-axonikus sejt által létrehozott gátló áram okozta extracelluláris feszültség-változás közel azonos, ami kb. 15- 20 microV nagyságú kontroll körülmények közt (Glickfeld et al., 2009). A karbakol kb. felére csökkenti a gyorsan tüzelő kosársejtek kimenetét az M2 típusú muszkarinikus receptorok aktiválásán keresztül, így karbakol mellett kb. 7-10 microV feszültség-változást generálhat egy ilyen típusú gátlósejt. Mivel a karbakol ennél nagyobb, közel 2/3-os csökkenést okoz az axo-axonikus sejtek kimenetében, ezért azok kimenete karbakolban kb. 5-7 microV-ra csökkenhet. A mi mérési körülményeink közt min. 20-30 microV jeleket detektálunk, ami kb. 3-4 db. szinkron kisülő kosársejttől eredhet, ill. 4-6 db. axo-axonikus sejttől. Ezekből a becslésekből az következik, hogy elméletileg pár kosársejt vagy axo-axonikus sejt közös tüzelése, esetleg ezen idegsejttípusok tüzekésének kombinációja, elegendő áramsűrűséget biztosíthat egy gamma ciklus kialakulásához. De mivel legalább 4x annyi gyorsan tüzelő kosársejt van a hippokampusz neuronhálózatában, mint axo-axonikus sejt (Baude et al., 2007), ill. az axo-axonikus sejtek csak minden második cikluban tüzelnek, ezért úgy gondolom, hogy a gyorsan tüzelő kosársejtek működésével sokkal egyszerűbb a gamma oszcillációkat generálni a hippokampális neuronhálózatban, mint csak axo-axonikus sejtekkel önmagukban. Azt nem zárhatjuk ki, hogy az axo-axonikus sejtek
hozzájárulhatnak bizonyos körülmények közt a periszomatikus áram generálásához, de döntően a gyorsan tüzelő kosársejtek az áramgenerátorok karbakol indukált gamma oszcilláció alatt (Gulyás et al., 2010).
5. Hogyan befolyásolhatja a posztszinaptikus receptorok telítettség az egyes interneuron osztályok felől érekző szinapszisok hatékonyságát gamma oszcillációk alatt? Milyen körülmnények között tartja elképzelhetőnek, hogy a telítődés az alulsúlyozott sejttípusok szerepét megnöveli a ritmikus működések során?
A telítettség növekedése nagyobb áramgenerálást eredményezhet, függetlenül attól, hogy milyen sejttípustól érkezik az adott szinapszis. A nagyobb áram a GABA-A receptorokon keresztül nagyobb amplitúdójút gamma oszcillációt eredményez. Patológiás működés (pl.
ischemia, epilepszia) alatt ismert, hogy a GABA transzporterek funkciója csökken (Fueta et al., 2003; Vemuganti, 2005). A GABA transzporterek működésének csökkenése növelheti a receptorok telítettségét, és így a ritmikus aktivitások generálását elősegítheti.
Tehát könnyen elképzelhető, hogy egyes patológiás folyamatok allatt, amikor a
hiperszinkronizált neuronális aktivitás jellemzi az idegsejthálózatok működését, a GABA- A receptorok telítettségének fokozása bizonyos határig elősegítheti az oszcillációk
kialakulását, akár abnormális mértékben is.
6. A bíráló véleménye szerint a CA3 és a CA1 régió közti oszcillácós működés tárgyalását szerencsésebb lett volna kihagyni ,vagy kellő részletességgel tárgyalni (pl. mellékelt kézirat).
Elfogadom az opponens vélemyét. A kéziratot mellékelem a válaszomhoz.
7. Abíráló a fenntiekkel összhangban úgy gondolja, hogy a kannabinoidok hatását a gamma oszcillációra szintén ki kellett volna hagyni, vagy megfelelően alátámasztani.
Véleménye szerint ezen előzetes eredmények nélkül egységesebb színvonalú lett volna a pályázat.
Elfogadom az opponens vélemyét, bár úgy gondoltam, hogy ezen munkák eredményeinek mégha röviden történő bemutatása is, de növeli, és nem csökkenti a pályázat színvonalát. A kéziratot mellékelem a válaszomhoz, amely azóta elfogadásra került a The Journal of Physiology szaklapban.
4
Végül szeretném újból megköszönni, hogy az opponenes úr elvállalta a pályázatom bírálatát és örülök a pozitív véleményének.
Budapest, 2011. szeptember 25.
Hájos Norbert
Feed-forward inhibition underlies the propagation of cholinergically induced gamma oscillation from CA3 to CA1 hippocampal region
Rita Zemankovics1*, Judit M. Veres1, Iris Oren2 and Norbert Hájos1
1 Institute of Experimental Medicine, Hungarian Academy of Sciences, Budapest, Hungary
2Institute of Neurology, University College London, London, UK
*Present address: Institute of Physiology, University of Bern, Bern, Switzerland
Running title: Propagation of gamma oscillation in the hippocampus.
Key words: Inhibition, synaptic mechanisms, oscillations
Correspondence:
Norbert Hájos
Institute of Experimental Medicine Hungarian Academy of Sciences Budapest H-1450, Hungary Phone: 36-1-2109400/387 Fax: 36-1-2109412 Email: hajos@koki.hu
2
ABSTRACT
Gamma-frequency (30-80 Hz) oscillations are accompanied with attentive behavior and memory processes. Such rhythmic activities can be generated intrinsically in the CA3 region of the hippocampus from where they readily propagate to the CA1 area. To uncover the synaptic mechanisms underlying the intrahippocampal spread of gamma oscillation, we recorded action potentials and synaptic currents in anatomically-identified CA1 and CA3 neurons during carbachol-induced gamma oscillations in mouse hippocampal slices. The firing of the vast majority of CA1 neurons and all CA3 neurons was phase-coupled to the oscillations recorded in CA1. During a gamma cycle the discharge of both CA1 and CA3 interneurons followed the firing of CA3 pyramidal cells at latencies indicative of
monosynaptic connections, while CA1 pyramidal cells fired earlier than CA3 pyramidal cells.
We observed significant differences in the amount of phasic excitation and inhibition received by the different cell types. Interneurons in both CA1 and CA3 received prevailing synaptic excitation, but the dominant synaptic input of pyramidal cells was inhibitory in both regions.
The correlation analysis of the input-output features of the neurons suggested that the firing of interneurons in both hippocampal areas was controlled by the discharge of CA3 pyramidal cells. In contrast, CA1 pyramidal cells rather showed tonic firing, which was suppressed temporarily by synaptic inhibition. Our results indicate that the gamma oscillation generated intrinsically in CA3 propagated to CA1 via feed-forward inhibition, i.e. the synchronous activities of CA3 pyramidal cells rhythmically discharge CA1 interneurons, and their synaptic output generates the oscillatory activity in CA1.
INTRODUCTION
Temporally structured firing of neurons, which is pivotal for information processing in cortical networks, can generate oscillatory activities (Paulsen and Moser, 1998). Gamma (30- 80 Hz) oscillations received particular attention, since such synchronous network activities were found to be associated with sensory encoding and memory storage or retrieval as well as attentive behavior (Singer, 1993; Montgomery and Buzsaki, 2007). While in vivo and in vitro studies uncovered how gamma oscillations are generated within the CA3 region of the
hippocampus (Csicsvari et al., 2003; Hajos and Paulsen, 2009), the cellular and network mechanisms underlying their propagation to the neighboring regions have remained largely unknown.
One of the most widely used in vitro models for studying gamma oscillations in the hippocampus is the carbachol (CCh) induced network oscillation (Fisahn et al., 1998). CCh, a cholinergic receptor agonist can induce synchronous activities in hippocampal slices at gamma frequencies that share many features of hippocampal gamma oscillations occurring in vivo. Gamma oscillations are generated intrinsically in the CA3 region of the hippocampus both in the behaving animal and under in vitro circumstances. In both cases, the phase of the oscillation reverses in the stratum lucidum of CA3 and current-source-density analysis reveals current sink-source pairs in the stratum pyramidale and the apical dendritic region of the pyramidal cells. In addition, the firing properties of the different cell types in CA3 are similar during in vivo gamma rhythms and in vitro induced oscillations. Pyramidal cells have a propensity to fire at low frequencies (< 5 Hz) close to the trough of the oscillation, while interneurons tend to fire at higher frequencies at the ascending phase of the oscillation (Hajos and Paulsen, 2009).
Studies of the CCh-induced gamma oscillations elucidated that these rhythmic
activities in CA3 are produced by a synaptic feedback loop composed of CA3 pyramidal cells and fast spiking basket cells (Mann et al., 2005; Gulyas et al., 2010). During in vitro gamma
3 oscillations, the discharge of principal cells is governed by perisomatic inhibition, whereas the firing of GABAergic interneurons is driven by excitatory input (Oren et al., 2006). The
frequency and the magnitude of these oscillations are primarily determined by the decay kinetics and the amplitude of perisomatic inhibitory currents. (Fisahn et al., 1998; Oren et al., 2010).
Much less is known about the properties of gamma oscillations in the CA1 region of the hippocampus. In vivo data suggest that gamma oscillations in CA1 are driven by extrinsic inputs either originating from the entorhinal cortex or from CA3 (Bragin et al., 1995; Colgin et al., 2009), but the underlying mechanisms remain elusive.
The main goal of this study was to reveal how gamma oscillations generated intrinsically in CA3 spread to the CA1 area. To this end, we investigated the relationship between the firing activity and synaptic inputs of different cell types during CCh-induced network oscillations in hippocampal slices. By analyzing the input-output features of the recorded neurons, we showed that gamma frequency oscillations are propagated from the CA3 to the CA1 region via feed-forward inhibition.
METHODS
Animals were kept and used according to the regulations of the European
Community’s Council Directive of 24 November 1986 (86/609/EEC), and experimental procedures were reviewed and approved by the Animal Welfare Committee of the Institute of Experimental Medicine, Hungarian Academy of Sciences, Budapest.
CD1 mice of both sexes (postnatal day 15-23) were used in most of the experiments.
To measure selectively from cells containing the Ca2+ binding protein parvalbumin (PV), transgenic mice expressing the enhanced green fluorescent protein (eGFP) controlled by PV promoter (Meyer et al., 2002) were also used in this study (postnatal day 15-21). The pups were decapitated under deep isoflurane anaesthesia. The brain was removed into ice cold cutting solution, which had been bubbled with 95% O2-5% CO2 (carbogen gas) for at least 30 minutes before use. The cutting solution contained (in mM): 252 sucrose, 2.5 KCl, 26
NaHCO3, 0.5 CaCl2, 5 MgCl2, 1.25 NaH2PO4, 10 glucose, saturated with 95% O2-5% CO2).
Horizontal hippocampal slices of 450 µm thickness were cut using a vibratome (Leica
VT1000S). Exceptional care was taken to remove the entorhinal cortical parts from the slices.
After acute slice preparation the slices were placed into an interface-type holding chamber for recovery. This chamber contained standard aCSF at 35ºC that gradually cooled down to room temperature. The aCSF had the following composition (in mM): 126 NaCl, 2.5 KCl, 26 NaHCO3, 2 CaCl2, 2 MgCl2, 1.25 NaH2PO4, 10 glucose, saturated with 95% O2-5%
CO2. After incubation for a minimum of one hour, slices were transferred individually to a submerged-style recording chamber. We used a modified custom made recording chamber with a dual superfusion system for providing better metabolic supply for the slices (Hajos and Mody, 2009). In this design, the slices were placed on a mesh and two separate fluid inlets allowed aCSF to flow both above and below the slices with a rate of 3-3.5 ml/min for each channel at 30-32 oC.
Standard patch electrodes were used in all recording configurations (i.e. whole-cell patch-clamp, loose-patch and field potential recordings). Pipette resistances were 3-6 MΩ when filled either with the intrapipette solution or with aCSF. The intrapipette solution
contained (in mM): 138 K-gluconate , 3 CsCl, 10 disodium creatine phosphate, 4 Mg-ATP, 0.4 Tris-GTP, 10 HEPES, 0.2 QX 314; pH: 7.38; 285 mOsm.l-1). For later morphological
identification of the recorded cells biocytin in a concentration of 3-5 mg/ml was added to the pipette solution freshly before use.
4 Data acquisition. Data were recorded with a Multiclamp 700B amplifier (Molecular Devices, Sunnyvale, CA.). As a first step, two pipettes filled with aCSF were placed into the
hippocampal slice preparation; one into the stratum pyramidale of the CA1 area, and another to the stratum pyramidale of the CA3b area. After approximately 10-15 minutes of bath application of 10 µM CCh, which was usually enough time to induce stable persistent oscillations in the slices (Hajos and Mody, 2009), the field potentials were recorded simultaneously on two channels for at least 120 s, with the aim to compare the local field potential oscillations between the two regions. Then the electrode was removed from the CA3 area, while the electrode in CA1 was left in the same position. As a next step, in addition to the recording of local field potential in CA1, action potentials were detected extracellularly from individual neurons of CA1 or CA3 with the second pipette filled with aCSF. The loose- patch recordings were visually guided using differential interference contrast microscopy (Olympus BX61W), and action potentials were detected for 60-120 s, depending on the firing frequency of the cell. This pipette was then withdrawn from the slice, and whole-cell patch- clamp recordings were performed on the same cells with a new pipette filled with intracellular solution. Access resistance was in the range of 5-20 MOhm and was compensated (65-75%).
Only recordings, where the access resistance did not change substantially (more than 25%), were included in the study. Reported values of voltage measurements were not corrected for the junction potential. To record excitatory postsynaptic currents (EPSCs) and inhibitory postsynaptic currents (IPSCs) cells were voltage clamped at a holding potential of the estimated reversal potential for IPSCs (~ -70 mV) and EPSCs (~ 0 mV), respectively. Both field and unit recordings were low-pass filtered at 2 kHz using the built-in Bessel filter of the amplifier. Data was digitized at 6 kHz with a PCI-6042E board (National instruments, Austin, Texas) and EVAN 1.3 software, and was analyzed offline with Igor Pro 5.01 software
(Wavemetrics, Oregon) using either standard or custom-made Igor Pro procedures.
Event detection and analysis. Recordings were further filtered offline using a digital, bidirectional, phase-conserving filter. Field recordings were low-pass filtered at 1 kHz, extracellular unit recordings were high-pass filtered at 40 Hz to isolate spikes, while whole- cell recordings of postsynaptic currents (PSCs) were high-pass filtered at 1 Hz to filter out slow fluctuations in holding current.
The power of the field oscillation was calculated with power spectral density (PSD) analysis of ~ 60 s long field recordings. Before the Fast Fourier transform was performed, time windows of ~ 1.5 s with 50 % overlap were multiplied by a Hanning window to
minimise the end-effects. The area under the power spectral density curve between 10 and 45 Hz was taken as the power of the gamma-frequency oscillation.
To extract the magnitude and the phase of the different frequency-components of the field oscillation and to get information on changes in frequency and amplitude of the periodic signal with time, wavelet analysis using a Morlet-wavelet basis was used. The wavelet
transform of the field recording was examined between 10 and 45 Hz with scales chosen to reflect the equivalent Fourier frequency (Le Van Quyen et al., 2001). For each time point, the maximum of the wavelet transform magnitude was found, and the corresponding dominant frequency identified. The phase of the time point was defined in terms of the dominant frequency. Phase was defined in radians such that -π was associated with the minimum of the oscillation, and a full cycle ran from -π to π. Cells for which the wavelet magnitude of the field oscillation changed by > 2 SDs between spike train and PSC recordings were excluded from the study.
Event times for action potentials were defined as the time of crossing a voltage threshold set by visual inspection to exceed the noise level. Mean firing rate for cells was calculated as the total number of events during the recording epoch divided by the length of
5 the epoch. Normalized spiking frequency was calculated by dividing the mean firing rate by the frequency of the oscillation. Event phases were defined as the wavelet phase of the dominant frequency at the time of the event. To calculate the probability of discharge of a given cell group, the event number vs. phase histograms of each cell in the group were normalized, summed and divided by the number of cells in the given cell group. This averaged phase histogram was then multiplied by the mean of the normalized spiking frequency for the given cell group. Event times for PSCs were defined as time of peak current per cycle of the oscillation, and these were converted to wavelet phases of the dominant frequency.
The cycle-averaged events (Figures 5, 6) (as well as the cycle averaged field) were obtained by summing recordings over cycles, between - π and π and dividing by the number of cycles. Each cycle was linearly scaled to span 2π radians regardless of the number of data points.
Phasic charge transfer was calculated in the following way: an initial baseline estimate was obtained by taking the maximum (for EPSCs) or minimum (for IPSCs) of the cycle- averaged events. Then for each 0.2 s epoch the mean of all current values exceeding this initial baseline estimate was calculated. This mean was used as the baseline for the epoch. If no current value was found to exceed the initial baseline estimate during the epoch, the baseline estimate would increment negatively for EPSCs and positively for IPSCs until such current values were found. This calculation was repeated for all epochs of the entire
recording. The integral from this baseline value was calculated over each cycle, and the mean of these integrals were taken as the phasic charge transfer.
The cycle-averaged PSCs were converted to excitatory (ge) and inhibitory (gi) conductances using
/ /
( / )
e i
e i rev
h e i
g I
V E
= − (1)
where
I
e i/ is the phasic excitatory/inhibitory current,V
h is the holding potential, and/ rev
Ee iis the reversal potential for the conductance of interest. The conductances were used to estimate the net apparent reversal potential (Esynrev) by solving
rev rev rev rev
syn e syn e i syn i
I =g (E -E )+g (E -E )=0
rev rev
syn e e i i
rev syn
e i
I g E g E
E g g
+ +
⇒ =
+ (2)
Statistical analyses. The phase coupling of the events was determined by using circular statistics. The strength of phase coupling was calculated by summing all event phases within an epoch as unity vectors and then dividing the resulting vector sum ( R
ur
) by the number of events (Zar, 1999). The length of this normalized vector (“r”) was taken as the strength of the phase-coupling. If the phases of all unity vectors are identical then r is equal to 1, while it is 0 in a case of uniform distribution. The mean event phase was defined as the direction of the resultant vector (φ ).
The Rayleigh probability of R ur
was used to determine the significance of the phase- coupling. It was calculated by the following equation:
2 2 3 4
2 24 132 76 9
1 4 288 2
Z Z Z Z Z Z Z
n n
p e−
⋅
− − + −
+ −
=
(3)
6 where n is the number of spikes, and Z=n r2 (Fisher, 1993). Events were considered to be phase-coupled, if the Rayleigh test indicated that they were not distributed randomly around the gamma cycle (p< 0.01)(Zar, 1999).
The circular standard deviation was taken as 2 ln r
σ = − (4)
where
r
is the phase-coupling strength (Zar, 1999).For linear data that were normally distributed according to the Kolmogorov-Smirnov test ( 0.05
p > ), the equality of means of the measured variables of the different cell groups was tested by ANOVA and the Bonferroni post-hoc test was used to find significant differences between group means. For comparison of non-normally distributed linear data (p< 0.05;
Kolmogorov-Smirnov test) the nonparametric Wilcoxon signed rank test was used. To test equality of means of angular variables the multi-sample Watson-Williams test was used.
To correlate normally distributed linear-linear variables the Pearson's correlation coefficient was used. For variables from non-normal distributions the Spearman’s rank correlation coefficient was used. To correlate angular variables (a) with linear variables (X), the parametric angular-linear correlation coefficient rαl was used, which was defined as:
=
, (5) where rXC is a coefficient for correlation between X and cosinα, rXS is a coefficient for correlation between X and sinα, and rCS is a coefficient for correlation between the cosine and sine of α. The methods for determining these coefficients are described in Zar, 1999 (Zar, 1999).
The tests used in each case are specified in the text. Values are given as mean ± standard error of the mean (SEM), unless stated otherwise. All correlation coefficients are quoted as R.
Anatomical identification of the neurons. The recorded cells were filled with biocytin during the recordings. After the recording the slices were fixed in 4 % paraformaldehyde in 0.1 M phosphate buffer (PB; pH=7.4) for at least 1 hour, followed by washout with PB several times and incubation in 30 % sucrose in 0.01 M PB for at least 2 hours. Then slices were freeze- thawed three times above liquid nitrogen and treated with 1 % H2O2 in PB for 15 minutes to reduce the endogenous peroxidase activity. Recorded cells were visualised using avidin- biotinylated horseradish peroxidase complex reaction (Vector Laboratories Inc., Burlingame, CA) with nickel-intensified 3,3’- diaminobenzidine as chromogen giving a dark reaction product. After dehydration and embedding in Durcupan cells were morphologically identified on the basis of their dendritic and axonal arborisation. Representative neurons were
reconstructed using a drawing tube.
RESULTS
Gamma frequency oscillations in horizontal hippocampal slices were induced by bath application of 10 µM CCh. Two patch pipettes filled with aCSF were used to monitor simultaneously the local field potentials in the pyramidal cell layer of hippocampal CA1 and CA3b regions (Figure 1A). Power spectrum density (PSD) analysis of the extracellular recordings revealed a peak in the oscillations at the same frequency in both regions (mean
7 oscillation frequency was 31.3 ± 0.6 Hz in CA3 and 31.4 ± 0.6 Hz in CA1; n=24; p=0.313;
paired sample t-test; Figure 1C,E). On the other hand, the power of the oscillation was always smaller in CA1 than in CA3 (738.3 (309.5-1410.0) µV2 in CA3 and 99.8 (56.2-195.5) µV2 in CA1; median and interquartile ranges in parentheses; n=24,; p<0.001; Wilcoxon signed rank test; Figure 1B,D). A strong correlation was found between the frequency of the oscillations recorded in CA3 and in CA1 (R=0.989, p<0.001, n=24, Pearson’s correlation, data not shown). In addition, the power of the oscillation measured in the two hippocampal regions also showed a correlation (R=0.55, p<0.01, n=24, Spearman’s rank correlation data not shown).
After the simultaneous recording of oscillatory activities in the two hippocampal regions, the pipette from CA3 was withdrawn and loose-patch recording from a neuron was obtained, while gamma oscillation in CA1 was continuously monitored. Following the
recording the spiking activity of the cell, synaptic currents from the same neuron were detected in whole-cell mode using a different pipette filled with potassium based intrapipette solution.
The intrapipette solution also contained biocytin, which allowed post-hoc identification of the cell types based on their morphological characteristics.
Classification of the investigated cell types
Neurons recorded in CA1 were separated into four groups: 1) CA1 pyramidal cells (CA1 PC;
n=21; Figure 2A); 2) PV-eGFP positive interneurons (PV+ IN; n=11; Figure 2B); 3) oriens- alveus interneurons (OA IN; n=15) with soma and dendrites located predominantly in the stratum oriens (Figure 2C) and 4) radiatum interneurons (RAD IN; n=14) with soma and dendritic arbor mainly in the stratum radiatum (Figure 2D). PV+ INs were collected in slices prepared from PV-eGFP mice.
The group of PV+ INs included basket cells, bistratified cells and putative axo-axonic cells. These cell types have similar physiological properties in terms of firing pattern and the expression of different receptor types (Freund and Buzsáki, 1996) and we found that all PV+
IN showed similar input-output properties during CCh-induced oscillations, therefore we pooled these intreneurons into a single group. Nevertheless we cannot rule out the possibility that these cell types can play different roles in the generation or maintenance of gamma oscillations (see Discussion).
The group of OA INs included O-LM cells (n=11) and O-R cells (n=4). The former interneurons had axonal arbor predominantly in the stratum lacunosum-moleculare (McBain et al., 1994), while the latter cells projected their axon collaterals into the strata oriens and radiatum as well as toward the subiculum (Zemankovics et al., 2010). The OA INs are typically considered as feedback inhibitory cells, since their main excitatory input originates from CA1 PCs (Blasco-Ibanez and Freund, 1995).
The group of RAD INs included several different cell types, such as radiatum- lacunosum-moleculare cells (n=3), neurogliaform cells (n=2), Schaffer collateral-associated cells (n=4), subiculum projecting GABAergic cells (n=5)(Somogyi and Klausberger, 2005).
Though the recorded neuron types formed a diverse cell population based on their
morphological features, they are usually referred as feed-forward inhibitory cells, since their main excitatory intrahippocampal input is formed by the Schaffer collaterals of the CA3 PCs (Li et al., 1994).
In addition to CA1 neurons, we also obtained recordings from CA3 pyramidal cells (CA3 PCs, n=22) and CA3 interneurons (CA3 IN, n=8) during CCh-induced oscillations monitored in CA1. Here, the data of all types of CA3 INs were pooled, since we showed previously that GABAergic cells in CA3 tend to fire comparably at the ascending phase of the oscillation with a monosynaptic delay after the firing of CA3 PCs(though with different
8 frequency and precision)(Hajos et al., 2004). Only those cells were included in the study that could be unequivocally classified into one of these categories based on their morphological features, except in the group of CA3 PCs, where data of spiking properties of cells identified by only visual inspection were also included in the analysis.
Firing properties of different cell types during carbachol-induced network oscillations in CA1 To reveal the firing characteristics of CA1 cells in relation to the ongoing network oscillation recorded in CA1, the spiking activity of different types of neurons was detected in loose patch mode. The Morlet-wavelet based wavelet analysis was applied to reveal the magnitude and phase of the different frequency components (10-45 Hz) of the oscillation. To characterize the firing properties of the neurons, we determined the following parameters:
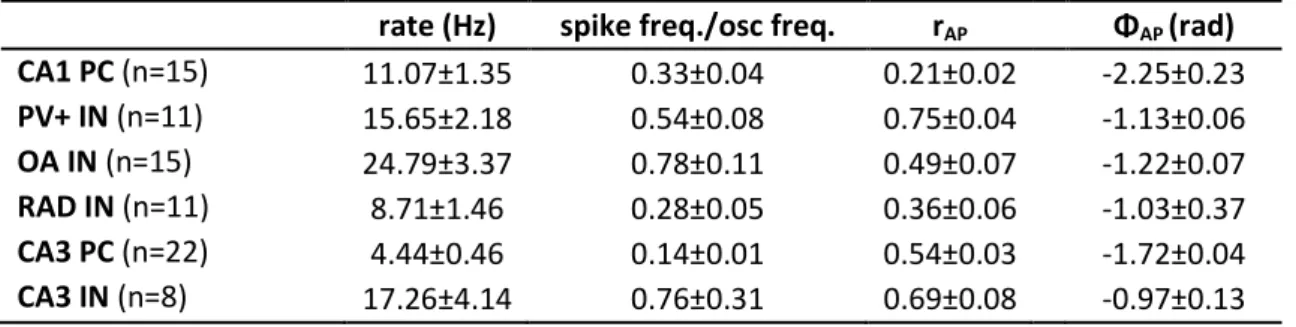
firing frequency, phase-coupling strength (rAP), phase of action potentials (ϕAP), and the ratio of the firing frequency/oscillation frequency in the case of phase-coupled cells. The probability of discharge for each cell type at a certain phase of a gamma cycle was also calculated (see Methods). The reported p values in the following sections regard to the Bonferroni post hoc tests performed after ANOVA analyses in the case of linear data and to the Watson-Williams tests in the case of circular data.
By comparing the firing frequency of the cell types, we observed that CA3 PCs fired at the lowest rates among all the cell types; they fired at significantly lower frequencies than PV+ INs (p<0.01) , OA INs (p<0.001) and CA3 INs (p<0.01). However, there was no significant difference between the firing frequency of CA1 PCs, RAD INs and CA3 PCs (CA3 PC vs. CA1 PC: p=0.309; CA3 PC vs. CA1 RAD IN: p=1; CA1 PC vs. RAD IN: p=1).
Some of the OA INs fired doublets of action potentials during numerous gamma cycles, which resulted in a rather high mean firing rate of this group on average. RAD INs fired at the lowest rates among INs, however, significant differences in the firing rates of different IN types could be shown only between OA INs and RAD INs (p<0.001)(Figure 3B,E; Figure 4A,B; Table 1).
Most of the recorded neurons showed gamma-modulated firing according to the Rayleigh test (Rp<0.01), only 6 out of 21 CA1 PC and 3 out of 14 RAD IN were not phase- coupled to the ongoing network oscillation. There were no significant differences in the firing rate of phase-coupled and non phase-coupled cells within a cell group. The firing rate was 11.07±1.35 Hz for phase-coupled CA1 PCs (n=15) and 9.26±2.52 Hz for non phase-coupled PCs (n=6, p=0.624); and 8.71±1.42 for phase coupled RAD INs, (n=11) and 8.18±0.83 Hz for non phase-coupled RAD INs (n=3; p=0.855).
Though the firing of almost all of the recorded neurons was modulated by the ongoing field oscillation, there were some significant differences among them in the depth of
modulation depending on the cell type. CA1 PCs were significantly less phase-coupled than PV+ INs (p<0.001), OA INs (p<0.01), CA3 PCs (p<0.001), and CA3 INs (p<0.001). At the same time, there were no significant differences in rAP between CA1 PCs and CA1 RAD INs (p=0.714). Among CA1 cells the firing of PV+ INs was the most precisely phase-coupled to the ongoing field potential oscillation. Beside the mentioned differences in the coupling strength of CA1 PCs and PV+ INs, the rAP of the latter cell type was significantly higher than the rAP of OA INs (p<0.01) and RAD INs (p<0.001). However, there were no significant differences between the phase-coupling strength of CA3 PCs, CA3 INs and PV+ INs (CA3 PCs vs. CA3 INs: p=0.91; CA3 PCs vs. PV+ INs: p=0.051; CA3 INs vs. PV+ INs:
p=1)(Figure 3C,F; Figure 4C-E; Table 1).
Despite the fact that most of the recorded neurons fired phase coupled, they did not fire all at the same phase of the gamma cycle. There were systematic differences in the
9 preferred phase of the different cell types. CA1 PCs fired mainly at the trough of the
oscillation, while both CA1 and CA3 INs tended to fire at the ascending phase of the
oscillation. There were no significant differences in the preferred phase of different IN types in CA1 (PV+ INs vs. OA INs: p=0.295; PV+ INs vs. RAD INs: p=0.778; OA INs vs. RAD INs: p=0.538) or between CA1 INs and CA3 INs (PV+ INs vs. CA3 INs: p=0.197; OA INs vs. CA3 INs: p=0.059; RAD INs vs. CA3 INs: p=0.884). CA3 PCs fired also close to the trough, but significantly later than CA1 PCs (p<0.01) and significantly earlier than INs within a cycle (CA1 PCs vs. PV+ INs: p<0.001; CA1 PCs vs. OA INs: p<0.001; CA1 PCs vs. RAD INs: p<0.01; CA1 PCs vs. CA3 INs: p<0.001). When translating these phase differences to time differences according to the mean oscillation frequency (31 Hz), we found that CA1 PCs fired 5-6 ms earlier than INs, and 1-2 ms earlier than CA3 PCs, while the time difference was approximately 3-4 ms between the discharge of CA3 PCs and INs of both regions (Figure 3C,F; Figure 4C-E; Table 1).
The sequence in the discharge of the different cell types suggests that during CCh- induced oscillations CA3 PCs could excite both CA3 and CA1 INs that fire at latencies indicative of monosynaptic connections. On the same time, the firing of CA1 PCs was presumably not driven by the discharge of CA3 PCs. These data suggest that oscillations generated in CA3 presumably propagate to CA1 through the direct discharge of CA1 INs driven by CA3 PCs.
The characteristics of synaptic inputs in the different cell types during CCh-induced gamma oscillations in CA1
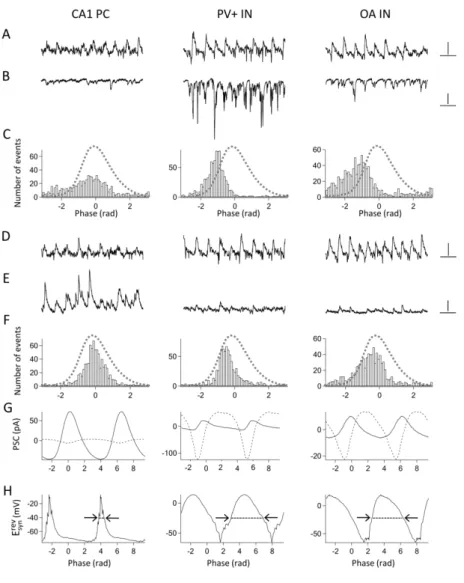
In order to confirm the assumption that gamma oscillations propagate from CA3 to CA1 via feed-forward inhibition, we have to reveal what determines the firing properties of the different cell types during oscillations. To answer this question, we recorded the excitatory and inhibitory postsynaptic currents of the same cells during oscillations and compared them to the firing activity of the neurons. EPSCs were recorded at the estimated reversal potential of IPSCs (~ -70 mV), while IPSCs were recorded at the estimated reversal potential of EPSCs (~ 0 mV). To characterize the postsynaptic currents in a neuron, we determined the phase- coupling strength of EPSCs and IPSCs (re and ri, respectively) as well as the phasic excitatory and inhibitory charge transfer. In order to define the phase-coupling strength of the postsynaptic currents, the phase of the peak current (i.e. the peak amplitude) recorded in each cycle was calculated. The comparison of synaptic inputs in the different cell types and the correlation analyses of synaptic inputs and firing properties were carried out only on those cells that showed significant gamma-modulation in their spiking activity.
We found that both EPSCs and IPSCs were strongly phase-coupled in all neuron types, and there was no difference in the strength of the phase-coupling of postsynaptic currents between the different cell types (Figure 5C,F; Figure 6C,F; Figure 7D,E; Table 2).
However, there were significant differences in the amount of phasic charge transfer. CA3 INs received the largest phasic excitatory synaptic input among all cell types, while CA1 PCs the smallest. Among CA1 cells the largest phasic excitatory charge transfer could be measured in PV+ INs. Among CA1 interneurons RAD INs received the smallest phasic excitation.
Significant differences in phasic excitatory charge (Qe) could be detected only between PV+
INs and CA1 PCs (p<0.001), CA3 INs and CA1 PCs (p<0.001), CA3 INs and RAD INs (p<0.001), and CA3 INs and OA INs (p<0.05) (Figure 5B,C,G; Figure 6B,C,G; Figure 7A;
Table 2).
Phasic inhibitory charge transfer was larger in CA3 PCs than in all other cell types (p<0.001 between CA3 PCs and all other cell groups in any possible comparisons). There was no difference in the amount of phasic inhibition between cell types within CA1 (p=1 in all
10 comparisons) or CA1 cells and CA3 INs (p>0.5 in all comparisons) (Figure 5E,F,G; Figure 6E,F,G; Figure 7B; Table 2).
To investigate how the amount of synaptic excitation and inhibition related to each other within a cell type, we calculated the ratio of phasic excitatory to inhibitory charge (Qe/Qi). Phasic inhibition exceeded phasic excitation in all pyramidal cells, in both CA1 and CA3, and also in some RAD INs, whereas the dominant input was excitatory in most of the interneurons in both regions. Qe/Qi was significantly smaller in CA1 PCs than PV+ INs (p<0.001), OA INs (p<0.05) and CA3 INs (p<0.01). CA3 PCs and RAD INs also had a significantly smaller Qe/Qi ratio than PV+ INs (CA3 PCs vs. PV+ INs: p<0.001, RAD INs vs.
CA1 PV+INs: p<0.05)(Figure 5G; Figure 6G; Figure 7C; Table 2).
In all neurons the phase of the peak excitation preceded the phase of the peak inhibition. The peak excitation received by the cells between -1.5 and -0.6 radians on the ascending phase of the field oscillation, while the peak inhibition were detected always somewhat later between -0.6 and -0.2 radians, closer to the peak of the field oscillation.
Comparison of the mean phases of the EPSC peak amplitudes revealed significant differences between PCs and INs. The phase of synaptic excitation was significantly later in both CA1 PCs and CA3 PCs than in INs of both areas (p<0.01 in all comparisons). On the other hand, the mean phase of the IPSC peak amplitude was on average somewhat later in PV+ INs and OA INs than in the other neuron types (p< 0.05 in all cases when comparing these two groups with other cell groups)(Figure 5C,F, Figure 6C,F; Figures 11, 12; Table 2).
To clarify how the synaptic inputs influence the spiking activity of the cells, besides analyzing the timing and magnitude of the excitatory and inhibitory synaptic inputs, we sought to determine also their combined effects. To characterize the temporal relationship between inhibitory and excitatory synaptic conductances, the net apparent synaptic reversal potential (see Methods) was calculated. describes the effective synaptic
conductance during a cycle. There were clear differences in the shape of the curve depending on the cell type. To capture these differences, the half-width of the peak of the curve was measured. This half-width was significantly narrower in PCs in both CA1 and CA3 than in INs of both regions (p<0.05 in all comparisons). This reflects also that the
dominant input received by PCs during the oscillation was inhibitory (Figure 5H; Figure 6H;
Figure 7F; Table 2).
Correlations between firing properties and synaptic currents in the different cell types After obtaining these basic input-output characteristics in different types of neurons during CCh-induced oscillations, the firing features of the phase-coupled cells were correlated to the properties of their synaptic inputs. The reported R and p values regard to Pearsons’s
correlation analyses for linear data and to the linear-angular correlation analyses (see Methods) for circular data.
As PV+ INs and OA INs fired at higher rates than CA1 PCs and RAD INs, and the phasic excitatory charge transfer was also larger in these cells, it was plausible to hypothesize that there is a correlation between excitatory charge and firing rate. Indeed, when comparing these quantities over all CA1 cells, we found a strong positive correlation between Qe and the firing frequency (R=0.495, p<0.01, n=33)(Figure 8A). Interestingly, no correlation could be found between the excitatory charge transfer and the firing rate, when it was tested for CA1 PCs only (data not shown, R=0.284, p=0.371, n=11), but the correlation between Qe and firing frequency reached significance, when it was tested on CA1 INs (data not shown, R=0.437, p<0.05, n=22). In addition, the ratio of excitatory and inhibitory charge (Qe/Qi) also correlated to firing rate (R=0.401, p<0.05, n=33)(Figure 8B). In contrast, there was no
correlation between phasic inhibitory charge and firing frequency (R=0.063, p=0.728,
11 n=33)(Figure 8C). These data suggest that the firing rate of the CA1 inhibitory cells is
controlled primarily by their excitatory synaptic input.
In the case of INs not only the firing rate, but also the phase-coupling strength tended to depend on the excitatory input. There was a positive correlation between both re and rAP (R=0.675, p<0.001, n=22) and Qe and rAP among CA1 INs (R=0.664, p<0.001, n=22)(Figure 9A,C). No correlation could be observed between ri and rAP (R=0.326, p=0.138, n=22) or Qi
and rAP (R=0.255, p=0.251, n=22)(Figure 9B,D). The same correlations were found, when it was tested for all CA1 cells including INs and PCs (rAP and re: R=0.586, p<0.001; rAP and Qe: R= 0.596; p<0.001; rAP and ri: R=0.105, p=0.596; rAP and Qe: R=0.055, p=0.762; n=33, data not shown). However; in the case of CA1 PCs, which cells usually tended to fire less phase coupled than INs, we could not reveal any correlations between rAP and their synaptic inputs (rAP and re: R=0.359, p=0.278; rAP and Qe: R=0.357; p=0.281; rAP and ri: R=0.147, p=0.666;
rAP and Qe: R=0.255, p=0.251; n=11)(Figure 9E-H).
To see whether the temporal interaction of phasic excitation and inhibition is
important in controlling the spike time, the width of was correlated to the phase-coupling strength of the action potentials. The correlation between these values reached significance only, when it was tested for all CA1 neurons, including both PCs and INs. The rAP was usually higher in INs, and this correlated well with the broader curve observed in these cell types (R=0.474, p<0.01; n=33)(Figure 9I).
These correlation analyses show that the more precise and robust excitatory input a CA1 IN receives, the more precisely it will fire during a gamma cycle, while no such correlation could be observed in the case of CA1 PCs.
Similar correlations were found between the phase of firing and the synaptic inputs.
The phase of firing correlated well with both the amount of excitation (Qe) and the excitatory- inhibitory charge ratio (Qe/Qi), when tested in all CA1 neurons (ϕAP and Qe: R=0.503, p<0.05;
ϕAP and Qe/Qi: R=0.484, p<0.05, n =33)(Figure 10A,C), whereas no correlation could be observed between Qi and ϕAP (R=0.308, p>0.05, n=33)(Figure 10B), or ri and ϕAP (R=0.374, p>0.05, n=33)(data not shown). The phase of firing showed a positive correlation also with the width of the curve. Cells with broader curve tended to fire not only more precisely, but also later in the cycle (R= 0.633, p<0.05, n=33)(Figure 10D). Interestingly, correlation between re and ϕAP reached statistical significance only in the case of INs (R=0.522, p<0.05, n=22)(Figure 10F), but failed to show a correlation when tested over all CA1 cells (R=0.310, p>0.05, n=33)(Figure 10E).
These results indicate again that the firing of INs is primarily driven by their excitatory synaptic inputs. Although CA1 PCs receive their excitatory input with equally high temporal precision, the amount of excitation is presumably not strong enough to control their spike timing.
Phase and time relations between firing and synaptic inputs in the different cell types
Finally, we compared the phase of the analyzed events (Figure 11; Tables 1, 2) and found that the phase of peak excitation always preceded the phase of peak inhibition in each cell both in CA3 and CA1. The peak of phasic excitation occurred in the ascending phase of the field potential oscillation, while the peak of phasic inhibition was observed close to the peak of the field potential oscillation. The phase of action potentials was slightly before or after the phase of the EPSC peak in the case of PV+ INs, OA INs and most of the RAD INs as well as in all CA3 INs. These phase differences translate to a time difference of 1-2 ms between the peak excitation and the action potentials of these cells according to the mean oscillation frequency of 31 Hz. However, the phase of action potentials occurred much earlier in CA1 PCs and some RAD INs than the phase of peak excitation (more than 8 ms earlier). CA3 PCs also fired
12 earlier than their peak excitatory input, but still later in the cycle than CA1 PCs (2-3 ms later).
The phase of peak inhibition occurred always later in a cycle than the phase of the action potentials in each recorded cell independently of the cell type or the region (always 2-5 ms later than the peak excitation in a given cell).
In summary, these data collectively suggest that both PCs and INs of the CA1 subfield received the same excitatory input from CA3 PCs via the Schaffer collaterals, however, only the discharge of the CA1 INs was driven by the rhythmic discharge of CA3 PCs (Figure 12).
These results indicate that the oscillation propagates from the CA3 region to the CA1 via feed-forward inhibition, whereby CA3 PCs excite both CA3 and CA1 INs that fire at latencies indicative of monosynaptic connections. The spiking of CA1 PCs was less precisely
controlled; they probably fired persistently and stopped spiking, when they received a strong synaptic inhibition during an oscillation cycle.
DISCUSSION
By analyzing the input-output characteristics of the different cell types during CCh-induced network oscillations, we found that these oscillations in CA1 emerge from the synchronous firing of local INs driven by the rhythmic excitatory input originating from CA3 PCs.
The CCh-induced gamma oscillations in CA1 shared many features of the in vivo recorded gamma oscillations in the hippocampus (Csicsvari et al., 2003). First, the firing of both PCs and INs tends to be phase-locked to gamma oscillations, and the proportion of gamma-modulated cells is higher for INs in CA1 compared to CA1 PCs both in the behaving animal and in our in vitro oscillation model. Second, the sequence of the discharge of the different cell types during a gamma cycle observed in vivo is similar to what we found in our study. The spiking probability of CA1 PCs in the gamma cycles reaches its maximum earlier than INs in this region. While both CA1 and CA3 INs discharge after CA3 PCs with time lags accounting for monosynaptic delay, the time lag between the discharge of CA1 PCs and CA1 INs is too long to be taken as a monosynaptic excitation, as CA1 PCs fire earlier than CA3 PCs within a cycle. Finally, PV+ INs show strong phase-coupling to the ongoing gamma oscillation both in vivo and during in vitro experiments (Bibbig et al., 2007; Tukker et al., 2007). These observations propose that CCh-induced network oscillations can model in vivo hippocampal gamma oscillations that are generated intrinsically in the CA3 region and propagate to CA1 (Bragin et al., 1995; Csicsvari et al., 2003; Isomura et al., 2006; Colgin et al., 2009).
When comparing the synaptic inputs of the different cell types during oscillations, we found the most striking difference in the amount of synaptic excitation received by the PCs and the INs in CA1. The largest excitatory currents in a given gamma cycle were measured in PV+ INs. This observation is in line with previous results obtained in CA3 (Oren et al., 2006).
In addition, the analysis of the timing of the events showed that the phasic excitation always preceded the phasic inhibition in all cells. The peak of synaptic excitation could be observed at the ascending phase of the oscillation. The excitatory inputs arrived in comparable phases to all cells, though the phase of peak excitation occurred slightly later in PCs than in INs.
Systematic differences have been reported in the kinetic parameters of the excitatory
postsynaptic currents between PCs and INs (Gloveli et al., 2005), showing that EPSCs in PCs have slower rise and decay kinetics than in INs (Pouille and Scanziani, 2001). In addition to the larger number of AMPA receptors at glutamatergic synapses onto INs (Geiger et al., 1995;
Nusser et al., 1998), the postsynaptic currents recorded in these cells also show faster kinetics due to their different molecular compositions (Geiger et al., 1997). Since in contrast to INs, PCs receive their excitatory inputs mainly on their dendritic spines (Gulyas et al., 1999;
13 Megias et al., 2001), space clamp limitations could also influence our measurements.
Nevertheless, it is striking that neither CA1 and CA3 PCs nor CA1 and CA3 INs showed any significant differences in the phase of their peak excitatory input. We can presume, therefore that the slight differences observed in the phases of the excitatory events primarily arises from the synaptic properties, and both PCs and INs receive their excitatory inputs from a common, single phase-coupled source, namely the CA3 PCs. The time differences between the EPSC peaks in CA1 neurons and the firing of CA3 PCs and the similarities between the shape of the event phase histogram of the spiking activity of CA3 PCs and the excitatory events of all CA1 cells also supports this conclusion. Finally, the fact that no difference was found in the
precision of EPSCs of the investigated cell types is also in alignment with this assumption.
Surprisingly, even OA INs appeared to receive their main excitatory input from the same source, i.e. from CA3 PCs during the CCh-induced gamma oscillation. OA INs are usually considered as feed-back inhibitory cells, since they receive 60-70% of their
glutamatergic inputs from their main target cells, i.e. CA1 pyramidal cells (Blasco-Ibanez and Freund, 1995). However, it seems like that under our recording conditions their phase-locked firing during oscillation is primarily driven by the phasic excitatory input originated from CA3 PCs. In a recent study (Croce et al., 2010), the authors revealed thatCA3 PC feed- forward and CA1 PC feed-back synapses onto OA INs differed in their receptor expression pattern and also in their plasticity properties. These cell type- and afferent-specific rules of synaptic transmission and plasticity suggest that OA INs might be recruited into network activities in various ways depending on the circumstances.
Although cholecystokinin expressing interneurons form a significant population of inhibitory cells in the hippocampus (Freund and Buzsáki, 1996), we did not investigate their input-output properties in this study. The reason for neglecting them was that these
interneurons have been shown to release only a small amount- if any- of GABA from their axon terminals in the presence of CCh (i.e. under our recording conditions), therefore they were not expected to contribute significantly to the oscillogenesis(Fukudome et al., 2004; Neu et al., 2007; Gulyas et al., 2010). CCh activates M1/3 muscarinic receptors located on the membrane surface of pyramidal cells, inducing the release of endocannabinoids from these neurons, retrograde signaling molecules that bind to CB1 cannabinoid receptors located at the presynaptic terminals of CCK- expressing interneurons. The CB1 receptor activation mutes the synaptic output of CCK-containing interneurons, preventing them of substantially influencing oscillatory activities in this in vitro model (Gulyas et al., 2010).
By comparing the inhibitory inputs of the neurons, we found that the absolute
inhibitory charge was much larger in CA3 PCs than in any other cell types. This observation is in agreement with the recurrent model of gamma oscillogenesis in CA3 (Oren et al., 2006).
While the amount of phasic inhibitory charge was smaller in CA1 PCs than in CA3 PCs, no significant difference could be found in the ratio of phasic excitatory to inhibitory charge between the two PC populations. INs are likely to receive synaptic inhibition from numerous subpopulations of GABAergic cells, yet the inhibitory inputs were rather homogenous among them in both precision and timing. Though the mean of peak inhibition was somewhat later in OA INs and PV+ INs in CA1 than in the other cell types, these differences could be explained by the diversity of IPSC kinetics of the various types of hippocampal INs (Hajos and Mody, 1997).
The analysis of the firing behavior revealed that the spiking of CA1 INs strongly correlated with the properties of their excitatory inputs, but showed no correlation with their precisely timed inhibitory inputs. These results suggest that the behavior of these GABAergic cells during CCh-induced oscillations is primarily determined by their excitatory drive
received from CA3 PCs. In contrast, neither the excitatory nor the inhibitory synaptic input properties correlated with the firing activity of CA1 PCs. Although the dominant input
14 recorded in CA1 and CA3 PCs during ongoing oscillation was inhibitory as well as the ratio of the phasic excitation and phasic inhibition was comparable in both cell types, their firing properties were quite dissimilar. One factor that could underlie the different spiking behavior may derive from the distinct effect of cholinergic receptor activation on the excitability of CA1 and CA3 pyramidal cells (Dasari and Gulledge, 2011). In addition, the difference in the absolute charge of phasic inhibition received by these neuron types could also contribute to their distinct discharge features. What might be the advantage of the weakly phase-coupled firing of CA1 PCs during CA3-driven gamma oscillation? The weak coupling might be important for making these cells capable of responding readily to excitatory input originating from the entorhinal cortex (Moser et al., 2008), and thus can promote the creation of temporal neuronal ensembles during attentive network states (Harris and Thiele, 2011).
In conclusion, our findings support a hypothesis that the intrahippocampal spread of gamma oscillation from CA3 to CA1 is accomplished by feed-forward excitation of CA1 interneurons. The synchronized inhibitory postsynaptic currents originating from the rhythmic discharge of CA1 INs probably play a major role in the generation of oscillatory activities detected in the local field potential, similarly as it was shown in CA3 (Oren et al., 2010). The results stress the importance of synaptic input in regulating the firing activity of CA1 neurons during gamma oscillations. The uncovering of the circuit mechanisms of gamma oscillation in CA1 driven by CA3 may further our understanding of the role of the functions of oscillations in different brain operations.
Author Contributions: NH and RZ contributed to the conception and design of the experiments. RZ and JMV conducted the electrophysiological experiments. The analysis program was written by IO. RZ, JMV, IO and NH analyzed the data. RZ and NH drafted the manuscript. All authors participated in the interpretation of the data, revised the article and approved the final version for publication. Experiments were conducted in the Department of Cellular and Network Neurobiology, Institute of Experimental Medicine, Hungarian Academy of Sciences, Budapest, Hungary.
Acknowledgements
We are grateful Dr. Ole Paulsen for his helpful comments on the manuscript. This work was supported by the Wellcome Trust International Senior Research Fellowship, the National Office for Research and Technology (OMFB-01678/2009), and the Hungarian Scientific Research Fund (T49517). We acknowledge Prof. Hanna Monyer, Dr. Gábor Szabó and Ferenc Erdélyi for generously providing the transgenic mice. We thank Erzsébet Gregori for her excellent technical assistance.
Reference list
Bibbig A, Middleton S, Racca C, Gillies MJ, Garner H, Lebeau FE, Davies CH,Whittington MA (2007) Beta rhythms (15-20 Hz) generated by nonreciprocal communication in hippocampus. Journal of neurophysiology 97:2812-2823.
15 Blasco-Ibanez JM, Freund TF (1995) Synaptic input of horizontal interneurons in stratum
oriens of the hippocampal CA1 subfield:srtructural basis of feed-back activation. Eur J neurosci 7:2170-2180.
Bragin A, Jando G, Nadasdy Z, Hetke J, Wise K,Buzsaki G (1995) Gamma (40-100 Hz) oscillation in the hippocampus of the behaving rat. J Neurosci 15:47-60.
Colgin LL, Denninger T, Fyhn M, Hafting T, Bonnevie T, Jensen O, Moser MB,Moser EI (2009) Frequency of gamma oscillations routes flow of information in the
hippocampus. Nature 462:353-357.
Croce A, Pelletier JG, Tartas M,Lacaille JC (2010) Afferent-specific properties of interneuron synapses underlie selective long-term regulation of feedback inhibitory circuits in CA1 hippocampus. J Physiol 588:2091-2107.
Csicsvari J, Jamieson B, Wise KD,Buzsaki G (2003) Mechanisms of gamma oscillations in the hippocampus of the behaving rat. Neuron 37:311-322.
Dasari S, Gulledge AT (2011) M1 and M4 receptors modulate hippocampal pyramidal neurons. Journal of neurophysiology 105:779-792.
Fisahn A, Pike FG, Buhl E,Paulsen O (1998) Cholinergic induction of network oscillations at 40 Hz in the hippocampus in vitro. Nature 394:186-189.
Fisher NI (ed) (1993) Statistical analysis of circular data. Cambridge UP, Cambridge, UK.
Freund TF, Buzsáki G (1996) Interneurons of the hippocampus. Hippocampus 6:345 - 470.
Fukudome Y, Ohno-Shosaku T, Matsui M, Omori Y, Fukaya M, Tsubokawa H, Taketo MM, Watanabe M, Manabe T,Kano M (2004) Two distinct classes of muscarinic action on hippocampal inhibitory synapses: M2-mediated direct suppression and M1/M3- mediated indirect suppression through endocannabinoid signalling. Eur J Neurosci 19:2682-2692.
Geiger JR, Lubke J, Roth A, Frotscher M,Jonas P (1997) Submillisecond AMPA receptor- mediated signaling at a principal neuron- interneuron synapse. Neuron 18:1009-1023.
Geiger JR, Melcher T, Koh DS, Sakmann B, Seeburg PH, Jonas P,Monyer H (1995) Relative abundance of subunit mRNAs determines gating and Ca2+ permeability of AMPA receptors in principal neurons and interneurons in rat CNS. Neuron 15:193-204.
Gloveli T, Dugladze T, Saha S, Monyer H, Heinemann U, Traub RD, Whittington MA,Buhl EH (2005) Differential involvement of oriens/pyramidale interneurones in
hippocampal network oscillations in vitro. J Physiol 562:131-147.
Gulyas AI, Megias M, Emri Z,Freund TF (1999) Total number and ratio of excitatory and inhibitory synapses converging onto single interneurons of different types in the CA1 area of the rat hippocampus. The Journal of neuroscience : the official journal of the Society for Neuroscience 19:10082-10097.
16 Gulyas AI, Szabo GG, Ulbert I, Holderith N, Monyer H, Erdelyi F, Szabo G, Freund
TF,Hajos N (2010) Parvalbumin-containing fast-spiking basket cells generate the field potential oscillations induced by cholinergic receptor activation in the hippocampus. J Neurosci 30:15134-15145.
Hajos N, Mody I (1997) Synaptic communication among hippocampal interneurons:
properties of spontaneous IPSCs in morphologically identified cells. J Neurosci 17:8427-8442.
Hajos N, Mody I (2009) Establishing a physiological environment for visualized in vitro brain slice recordings by increasing oxygen supply and modifying aCSF content. Journal of neuroscience methods 183:107-113.
Hajos N, Palhalmi J, Mann EO, Nemeth B, Paulsen O,Freund TF (2004) Spike timing of distinct types of GABAergic interneuron during hippocampal gamma oscillations in vitro. The Journal of neuroscience 24:9127-9137.
Hajos N, Paulsen O (2009) Network mechanisms of gamma oscillations in the CA3 region of the hippocampus. Neural Netw 22:1113-1119.
Harris KD, Thiele A (2011) Cortical state and attention. Nature reviews. Neuroscience 12:509-523.
Isomura Y, Sirota A, Ozen S, Montgomery S, Mizuseki K, Henze DA,Buzsaki G (2006) Integration and segregation of activity in entorhinal-hippocampal subregions by neocortical slow oscillations. Neuron 52:871-882.
Le Van Quyen M, Foucher J, Lachaux J, Rodriguez E, Lutz A, Martinerie J,Varela FJ (2001) Comparison of Hilbert transform and wavelet methods for the analysis of neuronal synchrony. Journal of neuroscience methods 111:83-98.
Li XG, Somogyi P, Ylinen A,Buzsáki G (1994) The hippocampal ca3 network - an in vivo intracellular labeling study. Journal of Comparative Neurology 339:181-208.
Mann EO, Suckling JM, Hajos N, Greenfield SA,Paulsen O (2005) Perisomatic feedback inhibition underlies cholinergically induced fast network oscillations in the rat hippocampus in vitro. Neuron 45:105-117.
McBain CJ, DiChiara TJ,Kauer JA (1994) Activation of metabotropic glutamate receptors differentially affects two classes of hippocampal interneurons and potentiates excitatory synaptic transmission. J.Neurosci. 14:
Megias M, Emri Z, Freund TF,Gulyas AI (2001) Total number and distribution of inhibitory and excitatory synapses on hippocampal CA1 pyramidal cells. Neuroscience 102:527- 540.
Meyer AH, Katona I, Blatow M, Rozov A,Monyer H (2002) In vivo labeling of parvalbumin- positive interneurons and analysis of electrical coupling in identified neurons. J Neurosci 22:7055-7064.