SUBCELLULAR DISTRIBUTION OF
VOLTAGE-GATED ION CHANNELS IN THE HIPPOCAMPUS
PhD thesis
Tekla Kirizs M.D.
János Szentágothai Doctoral School of Neurosciences Semmelweis University
Supervisor: Zoltán Nusser, D.Sc.
Official reviewers:
Anna L. Kiss, M.D., Ph.D.
Katalin Halasy, D.Sc.
Head of the Final Examination Committee:
Péter Enyedi, M.D., D.Sc.
Members of the Final Examination Committee:
Katalin Schlett, Ph.D.
Tibor Zelles, M.D., Ph.D.
Budapest, 2017
1
TABLE OF CONTENTS
1. The list of Abbreviations ... 4
2. Introduction ... 6
2.1. Differential expression and subcellular distribution of ion channels underlies functional heterogeneity ... 6
2.2. Techniques for studying the subcellular distribution of ion channels ... 8
2.3. Synaptic organization of the hippocampus ... 14
2.3.1. Principal cells of the hippocampus ... 14
2.3.2. Glutamatergic synaptic transmission ... 16
2.3.3. GABAergic cells of the hippocampus ... 17
2.3.4. GABAergic synaptic transmission... 18
2.4. Distinct distribution patterns of different ion channels in the hippocampus 19 2.4.1. Distribution of voltage-gated Na+ channels in the hippocampus ... 19
2.4.2. Distribution of voltage-gated K+ channels in the hippocampus ... 20
2.4.3. Distribution of voltage-gated Ca2+ channels in the hippocampus .... 23
2.5. Input- and target cell type-dependent distribution of ion channels ... 26
2.5.1. Input- and target cell type-specific distribution of AMPA receptors 27 2.5.2. Input- and target cell type-specific distribution of Cav channels ... 28
3. Objectives ... 32
4. Methods ... 33
4.1. Tissue preparation for fluorescent immunohistochemistry and SDS-FRL .. 33
4.2. Fluorescent immunohistochemistry ... 34
4.3. SDS-FRL ... 34
4.4. Testing the specificity of the immunoreactions ... 36
2
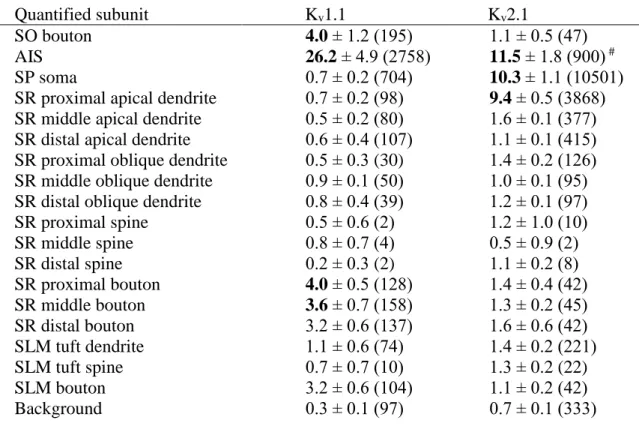
4.5. Quantification of immunogold particles labeling the Kv1.1 and Kv2.1 subunits in the rat CA1 region ... 37
4.6. Quantitative analysis of immunogold particles labeling the Cav2.1 and Cav2.2 subunits in rat CA3 PC axon terminals contacting Kv3.1b or mGlu1a
immunopositive cells ... 38 4.7. Quantification of CB1, Rim1/2, Cav2.1 and Cav2.2 subunits in axon terminals targeting the somatic region of PCs in the distal CA3 area of the rat and mouse hippocampus ... 39
4.8. Analysis of immunogold particle distribution patterns within specific subcellular compartments ... 40 5. Results ... 41 5.1. Subcellular distribution of two delayed-rectifier K+ channel subunits in the hippocampal CA1 area ... 41
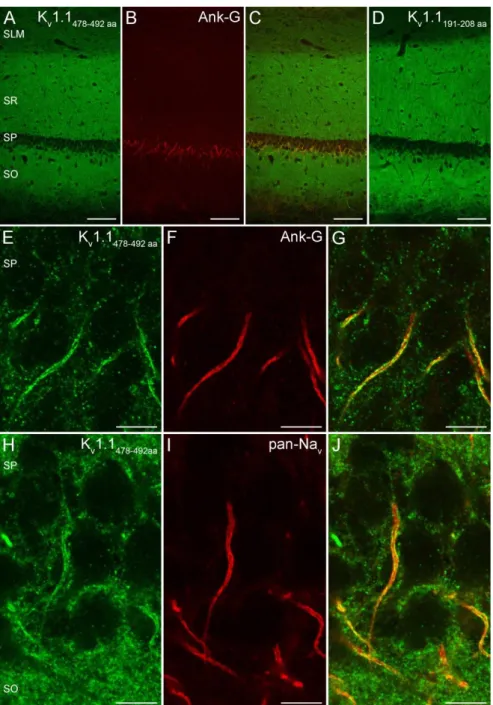
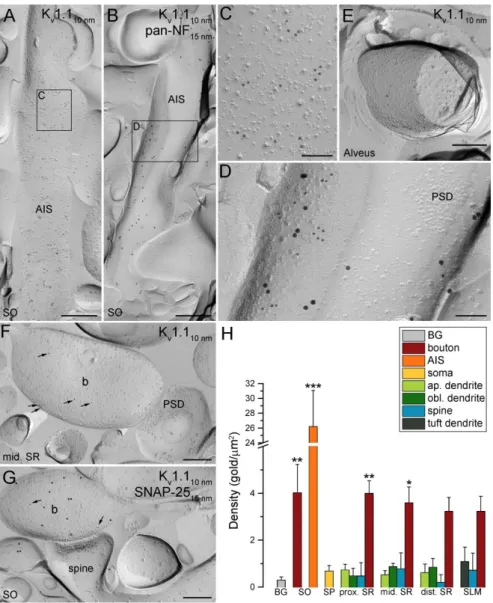
5.1.1. Distribution and specificity of Kv1.1 subunit immunoreactivity in the CA1 area ... 41
5.1.2. Axonal location of the Kv1.1 subunit in hippocampal CA1 PCs ... 41 5.1.3. Densities of Kv1.1 immunogold particles in distinct axo-somato- dendritic compartments of CA1 PCs ... 44 5.1.4. Distribution and specificity of Kv2.1 subunit immunoreactivity in the CA1 area ... 45
5.1.5. High-resolution immunogold localization of the Kv2.1 subunit in the hippocampal CA1 area. ... 47
5.2. Target cell type-dependent localization of voltage-gated Ca2+ channels in CA3 PC axon terminals ... 51
5.2.1. Cav2.1 and Cav2.2 subunit densities in presynaptic AZs of CA3 PC axon terminals contacting Kv3.1b and mGlu1a immunopositive dendrites ... 51
5.2.2. Non-random distribution of the Cav2.1 and Cav2.2 subunits in presynaptic AZs contacting Kv3.1b and mGlu1a immunopositive dendrites ... 56
3
5.3. Input cell type-dependent localization of voltage-gated Ca2+ channels in
basket cell axon terminals of the hippocampal CA3 area ... 58
5.3.1. Segregation of presynaptic Cav channels in CCK+ and PV+ axon terminals targeting the somatic region of CA3 PCs ... 58
5.3.2. Cav2.2 and Cav2.1 subunits are enriched in putative AZs of CCK+ and PV+ axon terminals of the CA3 area ... 63
6. Discussion ... 65
6.1. The Kv1.1 subunit is restricted to axonal compartments of CA1 PCs ... 65
6.2. Axo-somato-dendritic distribution of the Kv2.1 subunit ... 66
6.3. Kv2.1 and Kv1.1 subunits are segregated within the AIS of CA1 PCs ... 67
6.4. Unique distribution patterns of distinct ion channels in CA1 PCs. ... 68
6.5. Target cell type-dependent differential modulation of voltage-gated Ca2+ channel function ... 69
6.6. Target cell type-dependent molecular differences in presynaptic axon terminals ... 72
6.7. Input-specific expression of Cav subunits in PV+ and CCK+ basket cell axon terminals in the CA3 area ... 73
6.8. Variability in the CB1 content in the AZs of CB1 immunoreactive axon terminals in the CA3 area ... 74
7. Conclusions ... 75
8. Summary ... 77
9. Összefoglaló ... 78
10. Bibliography ... 79
11. Bibliography of the candidate’s publications ... 110
12. Acknowledgments ... 111
4 1. The list of Abbreviations
+ - positive
* - P < 0. 05
** - P ≤ 0. 01
*** - P ≤ 0. 001 aa. - amino acid
4-AP - 4-aminopyridine AIS - axon initial segment
AMPA - α-amino-3-hydroxy-5-methyl- 4-isoxazole propionate
Ank-G - Ankyrin-G AP - action potential
associational/commissural - A/C AZ - active zone
BSA - bovine serum albumin Cav - voltage gated calcium channel CB1 - cannabinoid receptor type 1 CCK - cholecystokinin
CNS - central nervous system D - dimensional
E-face - exoplasmic-face
Elfn1 - extracellular leucine- rich repeat fibronectin-containing protein 1
EPSC - excitatory postsynaptic current EPSP - excitatory postsynaptic potential GABA - γ-aminobutyric acid
GAD - glutamate decarboxylase GluR - ionotropic glutamate receptor HA - hemagglutinin
HCN - hyperpolarization-activated cyclic-nucleotide-gated channels IA - A-type, K+ current
ID - α-dendrotoxin-sensitive delayed rectifier current
IK - TEA and 4-AP sensitive
dendrotoxin-insensitive delayed rectifier current
IMP - intramembrane particle IN - interneuron
IPSC - inhibitory postsynaptic current IPSP - inhibitory postsynaptic potential Kv - voltage gated potassium channel mGluR - metabotropic glutamate receptor
Nav - voltage gated sodium channel NGS - normal goat serum
NL-2 - Neuroligin-2
NMDA - N-methyl-D-aspartate O-Bi cell - oriens-bistratified cell O-LM cell - oriens-lacunosum- moleculare cell
P-face - protoplasmic-face PA - picric acid
PALM - photoactivation localization microscopy
pan-NF - pan-Neurofascin PB - phosphate buffer PC - pyramidal cell PFA - paraformaldehyde PSD - postsynaptic density Pr - release probability PV - parvalbumin SD - standard deviation
5 SDS - sodium dodecylsulphate
SDS-FRL - sodium dodecylsulphate- digested freeze-fracture replica labeling SIM - structural illumination
microscopy
SL - stratum lucidum
SLM - stratum lacunosum-moleculare SO - stratum oriens
SP - stratum pyramidale SR - stratum radiatum
STED - stimulation emission depletion microscopy
TBS - Tris-buffered saline TEA - tetraethylammonium
VGAT - vesicular GABA transporter
6 2. Introduction
2.1. Differential expression and subcellular distribution of ion channels underlies functional heterogeneity
Our brain’s ability to process, store and retrieve information about the continuously changing internal and external world, and to effectively perform widely different functions, is supported by a remarkable diversity of its building blocks (neurons) and an astonishingly complex dynamic connectivity (synaptic) between them.
Already at the turn of the 20th century, the pioneering work of Camillo Golgi1, Santiago Ramon’y Cajal2 and Rafael Lorent de No3 began to reveal the complexity and diversity of neuronal morphology. Later on, with the development of modern molecular and electrophysiological techniques, the molecular and functional diversity of neurons was also recognized.
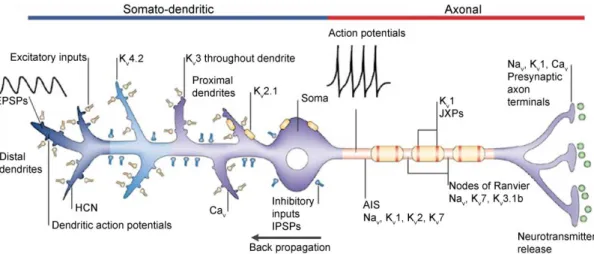
A prominent example of the molecular diversity of nerve cells is the expression of many members of the large ion channel superfamily (e. g. more than 100 subunits of K+ channels4) with a staggering number of distinct types of ion channels in their plasma membranes5. Among these, voltage- and ligand-gated ion channels are of particular significance due to their powerful role in controlling the activity of neurons (Figure 1).
For example, voltage-gated ion channels (e. g. Na+ (Nav), K+ (Kv), Ca2+ (Cav) channels)4,5 are responsible for the generation and propagation of action potentials (APs)6, which are believed to be the elementary units of rapid signaling of nerve cells.
More than fifty years ago Hodgkin and Huxley demonstrated that APs arise from subsequent changes in the membrane’s permeability to Na+ and K+ ions7. Later on, the presence of ion-selective channels in neuronal membranes was proved by patch-clamp recordings8 measuring ionic currents flowing through individual ion channels9. It was shown that ion channels present in the axon initial segment (AIS) of neurons (e.g. Nav, Kv1‒3, Kv7, Cav) will set the AP threshold and influence the AP generation and propagation along the neurites10-12. When the AP reaches the axon terminals, evokes the release of neurotransmitter containing vesicles, which will traverse the synaptic cleft and bind to postsynaptic ligand-gated ion channels (e. g. AMPA, NMDA, GABAA
receptors)13-17 transferring information from the presynaptic cell to the postsynaptic neuron. This process of synaptic transmission is governed by the activity of Cav, Kv and
7
Nav channels18 present in presynaptic axon terminals. On the postsynaptic side, the activation of ligand-gated ion channels induces local changes in the membrane potential that spread from their site of generation towards the soma and AIS, and are modified by dendritic ion channels (e.g. Kv4.2, Cav, Nav, and HCN channels)19-21. It was also demonstrated that dendritically localized voltage-gated ion channels (Nav) support the active ‘back-propagation’ of axonally generated APs into the dendritic tree, which will influence synaptic transmission, strength and synaptic integration22.
Figure 1. Subcellular compartment-specific distribution of voltage-gated ion channels and their main functional roles in a model neuron. Canonically, excitatory inputs (EPSPs‒postsynaptic potentials; yellow boutons) activate AMPA, NMDA receptors and evoke local depolarization. Inhibitory inputs (IPSPs‒inhibitory postsynaptic potentials; blue boutons) activate GABA typeA (GABAA) receptors, and evoke hyperpolarization. These signals spread to the soma, then to the AIS where APs are generated, if the evoked changes in membrane potantial exceed a treshold. In general, Nav channels and a subset of Kv channels (Kv1, Kv2, Kv3.1b, Kv7) are present in the AIS, nodes of Ranvier, juxtaparanodes (JXPs) of adult myelinated axons where they contribute to the AP generation and propagation. When APs invade the presynaptic nerve terminals, activate Cav channels that increase intracellular Ca2+ levels thereby triggering neurotransmitter release. In contrast, dendritically localized Cav together with Nav channels are involved in the generation of local dendritic APs. Dendritic Kv, Nav
and HCN channels shape the postsynaptic responses and control the backpropagation of somatic APs. Modified from 23.
Following the discovery of the astonishing molecular and functional diversity of ion channels, it became also evident that the functional heterogeneity of neurons is the consequence of the expression of distinct sets of ion channels. Moreover, in addition to the molecular structure of ion channels, their precise subcellular distribution and densities on the surface of nerve cells add another layer of complexity to their functional
8
impact (reviewed e.g. in 23-26). A particularly revealing example is presented by the Cav2.1 voltage-gated Ca2+ channel subunit (P/Q-type) in cerebellar Purkinje cells27. Dendritically localized Cav2.1 channels play a role in inducing dendritic spikes after climbing fiber28 or strong parallel fiber activation29, and in the amplification of excitatory inputs in the distal dendrites30. In contrast, when localized to presynaptic axon terminals, these channels induce the Ca2+ influx necessary for neurotransmitter release31.
Currently it is accepted that the combinatorial effect of genetic/molecular diversity and differential subcellular distribution of ion channels provides the basis for the large number of functionally distinct cell types24,32. Computational modelling and dynamic clamp studies of Ivan Soltesz and his colleagues also suggested that the diversity of neuronal types in a network has functional relevance, as modifications in heterogeneity influence the behavior of neuronal networks33-36. There is now evidence, which indicates that altered neuronal heterogeneity is a common mechanism contributing to various neurological (e.g. epilepsy) and psychiatric disorders (e.g.
schizophrenia)37.
Altogether, it is no wonder that tremendous efforts have been dedicated to identify the molecular diversity of ion channels and their expression patterns in the mammalian brain (e.g. the Allen Brain Atlas). With the experiments presented in this dissertation, I aimed to extend the current knowledge on ion channel distribution, and thereby contribute to the understanding of the complex interplay of channel subtypes underlying signal processing and computation in various neuronal circuits.
2.2. Techniques for studying the subcellular distribution of ion channels
Several approaches have been used to study the subcellular localization of ion channels in the central nervous system (CNS). Since the development of axonal and dendritic patch-clamp techniques38, a large amount of experimental data have been obtained with this method, revealing the densities of several ligand- and voltage-gated ionic currents in different subcellular compartments of many cell types39-46. A great advantage of this technique is that it provides information about the functional state of the studied channels, although the molecular structure (i.e. subunit composition) of the channels can not be explored using patch-pipette recordings. Moreover, small axon
9
terminals, dendritic spines, nodes of Ranvier are still inaccessible for patch-pipette recordings. This is despite the fact that, in addition to relatively large subcellular compartments such as somata, AISs22,47, main apical dendrites40,41 and large axon terminals (e.g. calyx of Held, mossy terminals of the CA3 region)48-50, recently this technique has been successfully applied to investigate ion channels in small-diameter dendrites (e.g. tuft dendrites)45 and somewhat smaller boutons as well (e.g. stellate cell axon terminals)51-53.
Immunohistochemistry with subunit specific antibodies can also be used for studying the subcellular distribution of metabotropic and ionotropic receptors. The fluorescent method is the most widely used immunohistochemical method, where fluorophore-coupled secondary antibodies are used to visualize the antigen-antibody complexes. This method has high sensitivity, allows the colocalization of multiple proteins simultaneously; but as the reactions are analyzed with light microscopy, it has a diffraction-limited resolution of more than 200 nm. This is in the size range of spines, active zones (AZs) and postsynaptic densities (PSDs), rendering this method inadequate for the subcellular localization of proteins.
Recently, fluorescence light microscopic techniques capable of nanometer-scale resolution have been developed (stimulation emission depletion (STED), structural illumination microscopy (SIM), single molecule localization microscopy: stochastic optical reconstruction microscopy (STORM) and photoactivation localization microscopy (PALM); reviewed in 54-58). However, unlike electron microscopy, in case of these techniques visualization of cellular membranes, which is particularly powerful for identifying synapses, requires labeling with antibodies. In addition, multicolor- imaging is still problematic.
Immunogold electron microscopy59 has a resolution of ~20‒30 nm and is indispensable for high-resolution localization and quantification of molecules. The most widely used pre-embedding immunogold method has high sensitivity, but the immunoreaction occurs in thick sections. As antibodies do not evenly penetrate in the sections, quantitative comparison of the signals of profiles localized in different regions is very difficult. Furthermore, the pre-embedding method hardly detects receptors located within the PSD because of the penetration problem and as a result false-negative labeling at synaptic sites is common60,61. In the post-embedding method, the
10
immunoreaction occurs evenly on the surface of ultrathin sections of resin-embedded tissue so problems of penetration are overcome. As synaptic and non-synaptic molecules are labeled with the same sensitivity, this method is more suitable for protein quantification62. However, sensitivity can be rather low in that only antigen molecules exposed on the surface of the section are accessible by antibodies63,64.
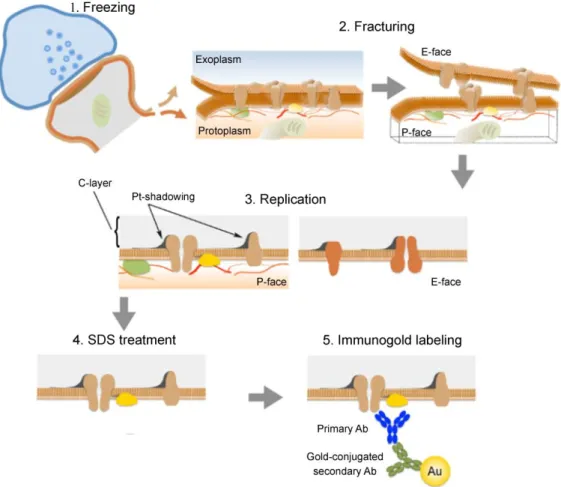
The sodium dodecylsulphate-digested freeze-fracture replica labeling (SDS- FRL; reviewed in 65-67) technique overcomes the mentioned limitations of electron microscopic techniques. The method was originally developed by Fujimoto68 to visualize two-dimensional (2D) distribution of integral membrane proteins in cellular membranes of rapidly frozen tissue. It is a high-resolution technique which has exceptional sensitivity, with a labeling efficiency reportedly approaching 100% in multiple cases69,70. The technique requires the studied tissue to be rapidly frozen under
Figure 2. Illustration of the key steps of the SDS-FRL. 1. High pressure freezing of the tissue. 2. The freeze-fracture process splits the lipid bilayer exposing the fracture faces. Proteins in the plasma membrane are allocated onto either E-face or P-face. 3.
The specimen is evaporated by carbon–platinum–carbon. 4. The SDS treatment removes cellular components not trapped by the replica. 5. Proteins of interest are
11
visualized by immunogold reactions. Ab, antibody; Au, gold; C, carbon; Pt, paltinum.
Modified from 71.
high pressure and then fractured at low temperatures (Figure 2). The fracturing process is random, but the plane of the fracture often passes through the hydrophobic center of membrane lipid bilayers, splitting them into half-membrane leaflets. The membrane half located adjacent to the protoplasm is called protoplasmic-half, while the exposed view of the membrane is called protoplasmic-face (P-face). The membrane half closer to the extracellular space is called exoplasmic-half with the exposed exoplasmic-face (E-face).
Integral membrane proteins—revealed as intramembrane particles (IMPs) by freeze- fracture process—that originally spanned the bilayer, are attached either to the E-face or to the P-face. The exposed fracture faces then are covered by evaporating thin layers of carbon, then platinum and again carbon to provide them stability and contrast for electron microscopic visualization. Afterwards, the tissue beneath the replica is dissolved with SDS, leaving only the transmembrane proteins in the membrane halves, which can be selectively labeled in subsequent immunogold reactions. Proteins attached to the E-face can be labeled with antibodies recognizing their extracellular domains, whereas proteins of the P-face can be visualized with antibodies raised against intracellular epitopes.
It is important to acknowledge that the SDS-FRL also has certain limitations71,72. First, identification of the different profiles based on morphological features is often difficult. There are only a few structures recognizable based on pure morphology: e.g.
PSDs of the excitatory synapses are clearly indicated by clusters of IMPs (Figure 3B and D) on the E-face73-75 of replicas; gap junctions have several distinctive morphologies in replicas such as close packed uniform 8–9 nm diameter IMPs on P- faces and uniform 8–9 nm diameter pits on E-faces76-78. Therefore it is frequently necessary to label marker proteins to facilitate identification of the fractured membranes. The availability of different sizes of gold particle conjugated to secondary antibodies enables double- or multiple labelings of proteins in replicas. However, multiple labeling is not without problems and should be performed with caution. If the labeled antigens are present in the same subcellular compartment such as PSD, AZ etc., due to steric hindrance, it is likely that their labeling density will be lower than that observed in single labeling experiments. The ‘mirror replica method’79 offers an
12
alternative way to perform colocalization of multiple proteins in the same compartment.
With this method, replicas are generated from both matching sides of the fractured
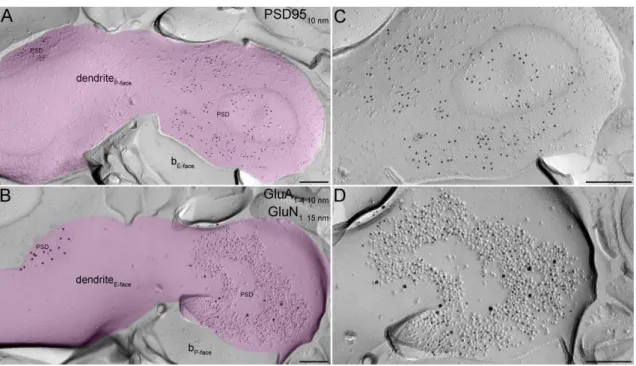
Figure 3 Simultaneous detection of multiple proteins in PSDs with the ‘mirror replica method’. (A and B) Complementary E- and P-face images of the same dendritic membrane segment (pseudocolored lilac). The P-face of the putative IN dendrite was labeled for PSD95 (A), whereas the E-face was double-labeled with an antibody labeling the GluN1 subunit (15 nm gold on B) and another one, which recognizes all four subunits of GluA receptors (10 nm gold on B). The PSD95 labeling on the P-face is concentrated over sub-areas of the dendritic membrane that are also labeled for GluA1-4
and GluN1 on the complementary E-face of the replicas. All labeling is restricted to PSDs indicated by IMP clusters on the E-face. (C and D) High magnification view of one of the PSDs from (A) and (B), respectively. b, bouton. Scale bars, 200 nm.
tissue surfaces, which have a corresponding E- and P-face of exactly the same membranes. Provided suitable antibodies are available, the immunolabeling of our proteins can be performed on separate, but complementary replicas (Figure 3). In addition, if no antibodies are available for the identification of certain profiles or cell- types, transgenic mice or viral vectors expressing membrane markers (e.g. membrane- targeted green fluorescent protein or tagged channelrhodopsin; Figure 4) in cell type- specific manner offer additional tools to facilitate identification of the fractured membranes. Viral vectors also carry the possibility of anterograde or retrograde tracing enabling the molecular analysis of specific inputs or outputs of specific cell populations71.
13
The second limitation is the consequence of the fracturing itself, which occurs randomly. This makes it impossible to target specific cells, structures or physiologically characterized cells, and can also lead to sampling bias, e.g. in synapse collection, because membranes that have different curvatures fracture with different probability (e.g. shafts versus spines)71,72.
Finally, the partition of membrane proteins with either the P-face or the E-face is unpredictable: certain proteins are preferentially allocated, while others are allocated to both faces, as was shown for the glutamate receptor GluD2 in parallel fiber synapses of Purkinje cells in the CB72 and for GABAA receptor γ2 in perisomatic synapses of CA1 and PCs80. Therefore, the allocation of proteins to the P-face or E-face, particularly for quantitative studies, should be carefully examined using antibodies that are reactive to intracellular and extracellular domains71,72,75.
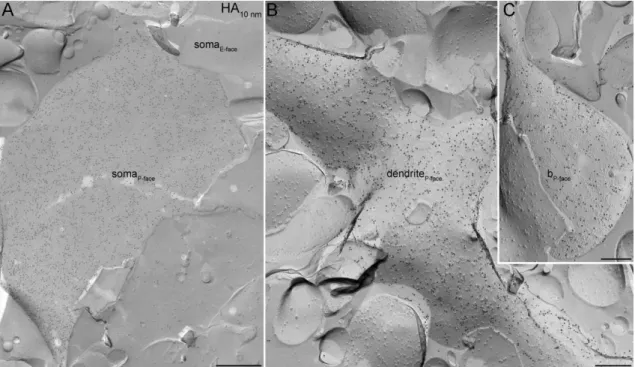
Figure 4. Example for SDS-FRL localization of a virally expressed membrane- targeted protein. (A–C) Hemagglutinin (HA)-tagged channelrhodopsin expression was virally transduced in mouse cortical neurons. The immunolabeling of the HA-tag was present on putative somatic (A), dendritic (B) and axonal (C) plasma membranes. b, bouton. Scale bars, 500 nm (A); 200 nm (B and C).
Altogether, the SDS-FRL is a high-resolution technique with exceptional sensitivity, and limitations that can be overcome by careful and prudent design of experiments. I adopted this technique to study the distribution of different Kv and Cav
14
channel subunits in the hippocampal region of the rat brain to further our knowledge on ion channel localization, which may also promote the construction of accurate neuronal models.
2.3. Synaptic organization of the hippocampus
Already there is a large amount of data regarding the distribution of ion channels and their functional relevance in the hippocampus, as this brain region has been the subject of many functional, structural and molecular investigations. In modern neuroscience, the hippocampus serves as a model for studying many key properties of neuronal circuits and nerve cells. This is attributable to its fundamental role in some forms of memory and learning81,82, as well as to the relatively simple laminar organization of its neurons, coupled with highly organized laminar distribution of many of its inputs83. Importantly, the information obtained from this brain region can be effectively extrapolated to the anatomically and functionally far more complex neocortex. In the following, I will provide a concise morphological and functional overview of the hippocampus.
2.3.1. Principal cells of the hippocampus
The hippocampus (Cornu Ammonis, CA) is part of a group of structures, called hippocampal formation, which also includes the dentate gyrus and subiculum. The hippocampal formation has a laminar organization that arises because its principal cells are confined to a single layer (stratum): the granule cells of the dentate gyrus are organized into the stratum granulosum, while the pyramidal cells (PCs) of the Ammon’s horn constitute the stratum pyramidale (SP). The hippocampus has been divided into subregions termed CA1, CA2 and CA3 regions based on the size and appearance of the PCs3. The layers above and below the principal cell layer contain functionally equivalent segments of the principal as well as local interneurons (INs).
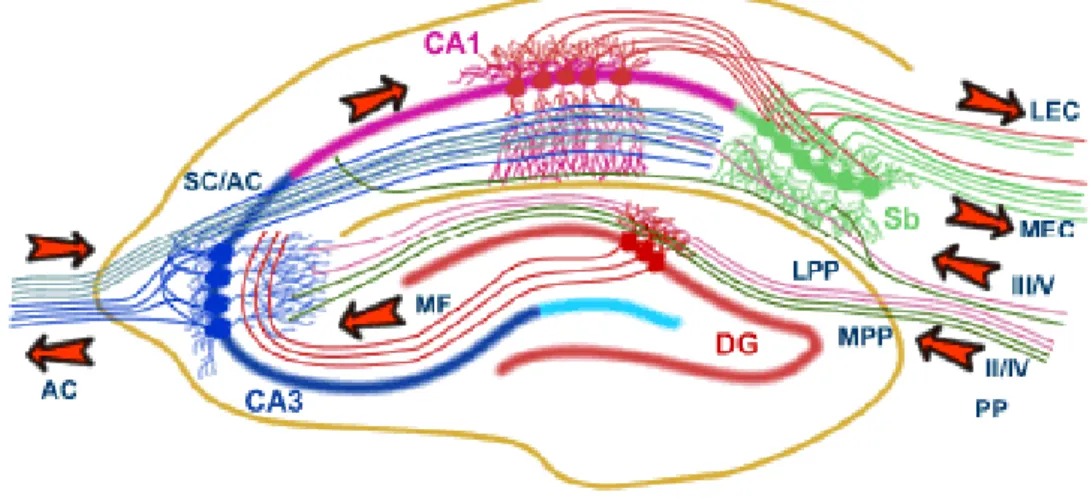
The main afferent fibers and the recurrent collaterals of principal cells are also organized in a laminar fashion, in a way that the incoming information enters and then leaves the hippocampal formation through a trisynaptic circuit (Figure 5). In the first step, afferent fibers of the perforant path84,85 carrying polymodal sensory information from the entorhinal cortex synapse onto the dendrites of granule cells of the dentate
15
gyrus. The axons of granule cells, called mossy fibers, enter the CA3 region, where they terminate on complex spines, called thorny excrescenses, located on proximal dendrites of PCs86 in the stratum lucidum (SL). Finally, the axons of the CA3 PCs, the Schaffer collaterals project either to ipsilateral or contralateral CA1 region, and establish synapses on the basal and apical dendrites of CA1 PCs in the stratum oriens (SO) and stratum radiatum (SR), respectively. The main extrinsic projections of the CA1 PCs are to the subiculum and to the layer V of the entorhinal cortex. Later additional excitatory
Figure 5. The trisynaptic circuit of the hippocampal formation. The main input of the hippocampal formation is carried by axons of the perforant path (PP), which convey polymodal sensory information from the entorhinal cortex (EC). Perforant path axons form synapses on granule cells of the dentate gyrus (DG) and PCs of the hippocampus (CA3 to CA1). Granule cells project via the mossy fibers (MF) to CA3 PCs which, in turn, project to ipsilateral CA1 PCs via the Schaffer collaterals (SC) as well as to the contralateral CA1 region via the associational/commissural pathway (A/C). CA1 PCs send axons to the PCs of the subiculum (Sb), which send axons back to the EC.
Adapted from University of Bristol, Centre for Synaptic Plasticity (http://www.bristol.ac.uk/synaptic/pathways/).
pathways were described challenging this classical unidirectional trisynaptic circuit and turn it into a complex network. For example, perforant path axon fibers, in addition to granule cells, also contact PCs in the stratum lacunosum-moleculare (SLM) of CA1‒
CA3 regions and the subiculum85. Furthermore, CA3 cells also excite each other through an extensive recurrent network of associational/commissural (A/C) inputs originating from CA3 PCs on both sides of the hippocampus87-89. The CA3 PCs were also shown to send back several collaterals to the dentate gyrus90, refuting the theory of unidirectional information flow in the hippocampal formation.
16 2.3.2. Glutamatergic synaptic transmission
The principal cells of the hippocampal formation, like the majority of principal cells in the CNS, release L-glutamate as neurotransmitter91-93. Neurotransmitters are released from vesicles at AZs of presynaptic cells, when an AP invades the axon terminal and opens voltage gated Ca2+ channels. Then, the influx of Ca2+ ions activates the closely positioned Ca2+ sensors (synaptotagmins) and triggers neurotransmitter release94.
The released glutamate diffuses into the synaptic cleft and binds to postsynaptic ionotropic receptors (GluRs: AMPA, NMDA, and kainate receptors)13,16,17 that act via opening of an ion channel permeable to Na+, K+ and Ca2+. The resulting postsynaptic responses can be measured in the postsynaptic cell as an excitatory postsynaptic current (EPSC) or potential (EPSP). The size and kinetics of these responses display tremendous variability95 due to differences, among others, in the type of glutamate receptors, their subunit composition, number, density and precise location in relation to the release site (also see chapter 2.5.1.). Glutamate can also act on postsynaptic G- protein coupled metabotropic receptors (mGluRs)96, which have a role in tuning postsynaptic neuronal excitability96. Furthermore, both GluRs and mGluRs are present and can act presynaptically by modulating the neurotransmitter release in response to subsequent incoming APs97-99.
The most widely accepted model of synaptic transmission between neurons is the quantal model pioneered by Katz and his colleagues100. According to this model, neurotransmitters are released in discrete quanta in a probabilistic manner from presynaptic axon terminals, and the efficacy of the synaptic transmission between pre- and postsynaptic neurons is determined by the number of release sites between the pre- and postsynaptic cells, the probability with which vesicles are released (Pr), and the size of the postsynaptic response caused by the neurotransmitter released from a single synaptic vesicle (termed quantal size). Many of these factors are highly variable at hippocampal glutamatergic synapses101-104 despite the apparent uniformity of PCs.
Moreover, synaptic efficacy or strength is not static between individual neurons, but can dynamically change over time in an activity-dependent manner. Short-term synaptic plasticity105,106 represents an increase (facilitation)107 or decrease (depression) in synaptic strength, which lasts from hundreds of milliseconds to seconds. In contrast,
17
long-term plasticity (long-term potentiation (LTP) and long-term depression (LTD)) can last hours, days or even years108-110. Short- and long-term plasticity not only operate on different time-scale, but have distinct underlying mechanisms and functional relevance.
2.3.3. GABAergic cells of the hippocampus
The outlined excitatory network is precisely regulated by a rich diversity of local INs111,112, which represent 10‒15%113,114 of all hippocampal cells. INs traditionally have exclusively local axonal arbor, but some of them may have extrahippocampal or commissural projections. Most INs receive inputs from the same extrinsic afferents that innervate their target principal cells, in turn they reduce the firing of the principal cells in a feed-forward regulatory manner. In case of the feed-back inhibition, the INs are activated by the recurrent collaterals of the principal cells. The weight of these two inputs may vary significantly between distinct IN types. In contrast to the relatively uniform principal cells, INs display great diversity111,115,116. Many IN classes have been defined on the basis of morphology, physiological properties, molecular expression profiles, and their selective innervation of distinct subcellular domains of postsynaptic cells. In addition, these IN types show AP firing at different preferred phases of PC activity during network oscillations in vivo115-121 and also in in vitro122,123 preparations.
In the following, I will provide a brief description of the main morphological and functional characteristics of hippocampal INs relevant to this dissertation.
Perisomatic-targeting INs124 consist of two non-overlapping IN subtypes, which have different functional roles: the basket cells target the somatic and proximal dendritic region (reviewed in 125-128), while axo-axonic cells innervate the AIS of PCs129-131. Based on neurochemical content and firing properties, basket cells are divided into two groups. One basket cell type expresses the calcium-binding protein parvalbumin (PV)132,133 and Kv3.1b voltage-gated K+ channel subunit134,135, and exhibits fast, non- accommodating firing patterns136. The other type of basket cell displays regular-firing pattern with accommodating APs136. They expresses the neuropeptide cholecystokinin (CCK)137 as well as type 1 cannabinoid receptor (CB1) at high levels in their axons and terminals138. The CB1 suppresses the GABA release upon activation by postsynaptically released endocannabinoids evoked by depolarization and Ca2+ entry139. Cell bodies of PV-positive (PV+)are usually located within or immediately adjacent to the SP132,136,140,
18
while CCK-containing INs have their somata primarily in dendritic layers136,141. Perisomatic INs have a radial dendritic arbor, usually spreading over all layers of the hippocampus, indicating that they might participate both in feed-forward and feed-back inhibitory circuits. Recently, it was shown that PV+ basket cells confer preferential inhibition to PCs with distinct sublayer positions and long-distance targets, while CCK + basket cells do not show any selectivity between PC subpopulations142. While it is clear that basket cells inhibit their target neurons, the discharges of axo-axonic cells, in addition to their usual inhibitory effect143, can also excite PCs under certain circumstances144. Axo-axonic cells also express PV133 and Kv3 channels134,135.
Several types of INs innervating the dendritic domain of PCs have been described. Among these, the oriens-lacunosum-moleculare (O-LM) cells of the CA1 area have their somata, horizontally-oriented spiny dendrites, and a few axon collaterals in the SO, while their axon is mostly distributed in the SLM innervating the apical dendritic tuft and presumably controlling the entorhinal cortical input145. In contrast in the CA3 area, dendritic tree of O-LM spans all layers except SLM. The distribution of dendrites in both CA subfields overlaps that of recurrent collaterals of local PCs, thereby suggesting the O-LM cells as a feed-back inhibitory IN111. These cells express the neuropeptide somatostatin141 and mGlu1a at uniquely high levels in their extrasynaptic membranes146. The glutamatergic97 and GABAergic147 input terminals contacting these cells express the mGlu7.
Bistratified cells have their cell body within or near the SP with their dendrites arborizing in the SR and SO, while their axon is associated with Schaffer collaterals or A/C inputs in the SO and SR148,149. These cells expresses PV, somatostatin as well as Kv3 channels134,135, and display fast-spiking characteristics148,150. Similarly, oriens- bistratified cells (O-Bi), have their axon arborization in the SO and SR, while their soma and horizontal dendrites are restricted to the SO151. They express somatostatin151 and occasionally mGlu1a151,152.
2.3.4. GABAergic synaptic transmission
INs express GABA synthesizing enzyme, glutamate decarboxylase (GAD)153, and release γ-aminobutyric acid (GABA)154,155. Similarly to glutamate, the released GABA acts on ionotropic (GABAA)14,15 and metabotropic receptors (GABA type B,
19
GABAB)156-159. The activation of GABAA receptors in mature neurons leads to an inward flow of anions, and a fast hyperpolarizing postsynaptic response—the inhibitory postsynaptic current (IPSC) or potential (IPSP), mediating the so-called phasic inhibition160. In addition, low GABA concentrations in extracellular space can activate GABAA receptors outside the synapse, generating the so-called tonic currents160. In contrast, activation of GABAB receptors stimulates intracellular G-protein signaling cascades that modulate ion channels (e. g. Kir3, Cav) and adenylate cyclase activity, and as a result has differential slow modulatory effect on pre- and postsynaptic neuronal compartments (reviewed in 156-158).
2.4. Distinct distribution patterns of different ion channels in the hippocampus
As outlined in the previous chapters, the activity of any individual neuron is shaped by excitatory and inhibitory inputs arriving from other cells. This picture is complicated by the fact that the impact of these inputs, the integration of the conveyed information and the transformation into output signals is governed by the orchestrated action of several types of ion channels that are expressed in different patterns on the surface of the neuron. Although there are still many gaps in our knowledge, a huge amount of data is available regarding the distribution of ion channels in hippocampal neurons. I therefore shall focus on a few selected ion channels, such as voltage-gated Na+, K+ and Ca2+ channels.
2.4.1. Distribution of voltage-gated Na+ channels in the hippocampus
Nav channels have been detected in axonal and dendritic compartments of hippocampal PCs by in vitro electrophysiology161. It was shown that their presence in high densities in the AIS lowers the threshold for AP initiation and gives rise to a fast, regenerative inward current during the rising phase of the AP11. In addition, in the nodes of Ranvier Nav channels ensure the efficient AP conduction162. Nav channels are also present in the somato-dendritic region of PCs, where they support the active back- propagation of axonally generated APs into the dendrites163, as well as contribute to nonlinear synaptic integration and dendritic Na+ spike initiation and propagation39,164-
167. Adult hippocampal neurons express three Nav subunits (Nav1.1, Nav1.2, and Nav1.6)168, but the lack of subunit-specific drugs precludes the identification of the
20
subunits responsible for axonal and somato-dendritic Na+ currents. Therefore, immunohistochemistry with subunit-specific antibodies was used to address this issue in the CA1 area. The Nav1.1 subunit was detected in the small axons and AISs of GABAergic INs69,while the Nav1.2 subunit in the AIS of PCs and VGLUT-1 putative axonal profiles69. Nodes of Ranvier, AISs69,169 were intensely labeled for the Nav1.6 subunit, while proximal apical dendrites of CA1 PCs were weakly immunoreactive. The high-resolution SDS-FRL technique was employed to explore the presence of the Nav1.6 subunit in small subcellular compartments, and to quantify their densities in distinct subcellular compartments. This method revealed a characteristic subcellular distribution pattern of Nav1.6 subunit in the axo-somato-dendritic compartments of PCs, with a dramatic drop (by a factor of 40 to 70) in density from nodes of Ranvier and AISs to somata, and a distance-dependent decrease in density along the proximo-distal axis of the dendritic tree without any detectable labeling in dendritic spines69.
2.4.2. Distribution of voltage-gated K+ channels in the hippocampus
Kv channels (41 subunits) comprise one of the four K+ selective ion channel groups, together with the Ca2+- and Na+-activated K+ channels of the KCa group (8 subunits), the constitutively active G protein- and ATP-regulated inwardly rectifying K+ channels of the Kir group (15 subunits), and the constitutively open or ‘leak’ K+ channels of the tandem pore or K2P group (15 subunits)26.
Hippocampal PCs express a wide variety of K+ channel subunits, which might reside in distinct axo-somato-dendritic compartments26. Indeed, electrophysiological experiments have identified K+ currents in PC dendrites, including the transient A-type K+ current (IA) characterized by fast activation and rapid rates of inactivation, as well as the delayed rectifier K+ current, which exhibits a delayed onset of activation followed by little or slow inactivation170. The latter one was further divided into two groups based on pharmacological properties: the IK current can be blocked by low concentrations of tetraethylammonium (TEA) or high concentrations of 4-aminopyridine (4-AP)171, while the ID current is sensitive to α-dendrotoxin170.
The IA current is exclusively mediated by the low-voltage activated Kv4.2 channels in CA1 PCs172. It has a major role in a large variety of dendritic processes, including the regulation of dendritic electrogenesis167, the AP back-propagation into the
21
dendrites40,173, synaptic integration and plasticity174-178. Somatic and dendritic patch- clamp recordings from CA1 PCs revealed a sixfold increase in the density of IA as a function of distance from proximal to distal main apical dendrites40. In contrast, SDS- FRL demonstrated only a 70% increase in the density of Kv4.2 subunit along the proximo-distal axis of main apical dendrites179. The Kv4.2 subunit was present in higher densities in dendritic spines than in shafts at the same distance from the soma179. Axonal compartments lacked the Kv4.2 subunit179. These results indicate that a large fraction of the Kv4.2 channels in the proximal dendrites do not conduct K+. Posttranslational modifications or interactions with some auxiliary⁄associated proteins were suggested as possible mechanism for channel function modification179.
The IK current, mediated mainly by the high-voltage activated Kv2.1 channels, has also been revealed in the somato-dendritic region of CA1 PCs171,180. Interestingly, they are believed to regulate excitability and Ca2+ influx during periods of repetitive high-frequency firing, rather than regulating the repolarization of single APs171,181. Light microscopic immunohistochemical and functional studies demonstrated the presence of the Kv2.1 subunit in the somata, proximal dendrites and AISs of PCs182-187, where it either forms clusters or has a uniform distribution depending on its phosphorylation state181,188. Increased neuronal activity induced by seizures or hypoxia- ischemia induces Kv2.1 dephosphorylation and the translocation of surface Kv2.1 from clusters to a uniform localization. This modulation is associated with changed channel gating properties (hyperpolarizing shift in the voltage-dependent activation) and a consequent increase in the amplitude of IK currents, which might suppress the pathological hyperexcitability of central neurons181,188. Compared to the numerous studies exploring the Kv2.1 subunit localization in the perisomatic region of PCs, there is no data available regarding their localization in small subcellular compartments such as oblique dendrites, dendritic tufts, dendritic spines, nodes of Ranvier and axon terminals.
Kv have also been found in axons, where they set the threshold and sculpt the shape of the APs in addition to regulating repetitive firing properties of PCs11,12,189-192. The low-voltage activated delayed rectifier Kv1.1 channel is of particular significance, as dysfunctions or the absence of these channels have been associated with various types of neurological disorders including epilepsy90 and episodic ataxia193. This is
22
consistent with functional studies showing the role of ID current170,194—evoked by channels composed of Kv1.1, Kv1.2, or Kv1.6 subunits—in regulating axonal excitability and AP duration in hippocampal PCs. It was shown that inactivation of Kv1 channels in the AIS and proximal axon during slow subthreshold somato-dendritic depolarization generates a distance-dependent broadening of the axonal AP waveform190, augmenting Ca2+ entry and facilitating neurotransmitter release50,190. Moreover, Kv1 channels in juxtaparanodal regions may act to reduce re-excitation of the node195. Light microscopic immunofluorescent and peroxidase reactions confirmed the presence of the Kv1.1 subunit in AISs, juxtaparanodal regions of myelinated axons of CA1 PCs and in the neuropil of the SO and SR of the CA1 area169,196-198. The neuropil signal in these regions is likely to originate from the labeling of pre-terminal axons and/or presynaptic axon terminals. Although Kv1.1 subunits can form heterotetrameric channels with the Kv1.2 subunits on the surface of neurons, the Kv1.2 subunit is barely detectable in the SO and SR of the CA1 area with light microscopic immunofluorescent reactions169. In contrast, AIS and juxtaparanodal axons of CA1 PCs were intensely labeled for the Kv1.2 subunit169. Both subunits were also localized in the AIS of INs169, while the Kv1.6 subunit is predominantly expressed in INs197. Currently the presence of the Kv1.1 subunit at a low density in somato-dendritic compartments cannot be excluded based on the neuropil labeling in the SO and SR, especially because this subunit can also be localized to somato-dendritic regions as was shown in, e.g., the ventral cochlear nucleus199.
Finally, Kv3 channels reside in both somato-dendritic and axonal compartments of a subset of INs134,135,200. They mediate either delayed rectifier currents (Kv3.1 and Kv3.2) or IA-type currents (Kv3.3 and Kv3.4), but can form heteromeric channels with intermediate gating characteristics201. Typically found in fast-spiking INs, Kv3 channels are important for AP repolarization and sustaining high-frequency firing135,202-205. Dendritic patch-clamp recordings demonstrated that Kv3 channels accelerate the decay time course of EPSPs, shortening the time period of temporal summation and promoting AP initiation with high speed and temporal precision206,207. Immunofluorescent reactions confirmed that the Kv3.1b subunit is present in the somata, proximal dendrites and axon terminals of hippocampal INs. Furthermore, 90% of Kv3.lb+ INs were PV+135, which are known to display fast-spiking characteritics135. Conversely, a large percentage
23
(82%) of PV+ cells expresses the Kv3.1b subunit135. Based on these findings Kv3.lb is an ideal marker for PV+ fast-spiking INs. Most Kv3.3-immunolabeled IN somata were also immunoreactive for PV, while a few of them contained somatostatin208.
2.4.3. Distribution of voltage-gated Ca2+ channels in the hippocampus
A large body of data is available that demonstrates the presence of distinct types of Cav channels on hippocampal neurons, where these channels contribute to a wide range cellular processes, including dendritic electrogenesis, synaptic plasticity, neurotransmitter release, activation of Ca2+-dependent enzymes and second messenger cascades, as well as gene expression209,210.
Based on the pore-forming subunit, 10 types of Cav channels can be distinguished, which fall into three families according to their pharmacological and biophysical properties: (1) the high-voltage activated dihydropyridine-sensitive (Cav1.1‒4, L-type) channels, (2) the high-voltage activated dihydropyridine-insensitive (Cav2.1, P/Q-type; Cav2.2, N-type; Cav2.3, R-type) channels and (3) the low-voltage- activated (Cav3.1‒3, T-type) channels211.
Dendritic patch-pipette recordings and Ca2+ imaging experiments demonstrated the presence of most, if not all, Cav channel types on CA1 PCs, which play important role in synaptic integration, synaptic plasticity, and neuronal excitability. Through these channels dendritic APs and synaptic inputs may elevate the intracellular Ca2+
concentration in the dendrites, which can result in release of neurotransmitters or other substances from dendrites or induction of synaptic plasticity19. In addition, dendritic Cav
channels together with Nav channels may produce amplification of distal synaptic inputs and minimize the attenuation that would otherwise occur as a consequence of passive cable properties212. Although the total Ca2+ channel density is fairly uniform across dendrites, the density of the individual channel subtypes varies between the proximal and distal regions of neurons212. For example, in the somata and proximal dendrites mainly N-type, P/Q-type, L-type channels contribute to the Ca2+ influx, whereas T-type and R-type channels are distributed in more distal dendrites39,213-215. Unfortunately, there are only a few studies showing immunohistochemical localization of Cav channels in the somato-dendritic region of hippocampal neurons. One light microscopic study showed weak immunosignal for the Cav3.1 T-type channel subunit in the somatic-
24
proximal dendritic region of CA1 and CA3 PCs, and stronger signal in the apical dendrites for the Cav3.2 and Cav3.3 subunits216 with no detectable increase between the middle and distal regions of apical dendrites. The perisomatic region of most INs was also immunopositive for Cav3.3 or Cav3.1 or in some cases for Cav3.2216,217. It is worth mentioning, that the authors did not test the specificity of their immunoreactions neither in knockout animals (in which the protein of interest is specifically missing), nor by using two (or more) antibodies against different parts of the same protein25.
The distribution of Cav1.2 and Cav1.3 L-type channel subunits was determined by pre- and post-embedding immunogold methods in CA1 PCs218,219. It was reported that both Cav1.2 and Cav1.3 subunits are distributed predominantly, but not exclusively in soma and dendritic processes at both PSDs and extrasynaptic sites218,219. Examination of the density of these Cav subunits along apical dendrites revealed no significant differences between proximal and distal regions219. However, thin dendrites and spines contained more gold particles than large diameter dendrites219. An elegant study, using super-resolution imaging, optogenetics and electrophysiological measurements demonstrated that Cav1.3 channels form functional clusters of two or more channels along the surface membrane of hippocampal neurons220. Clustered channels can be physically coupled via calmodulin in a Ca2+-dependent manner, which will increase the activity of adjoined channels, facilitate Ca2+ currents and thereby increase firing rates in hippocampal neurons220. In addition, fluorescent immunolabeling revealed the Cav1.2 and/or Cav1.3 subunits in the somatic and proximal-dendritic regions of GABAergic INs, with PV+ and somatostatin+ INs mostly expressing the Cav1.3 subunit217,221.
The Cav2.3 R-type channel was also observed postsynaptically in the somata, dendritic shafts, and spines of the putative CA1 PCs by pre-embedding immunogold labeling222. In dendritic spines immunogold particles were mainly observed in extrasynaptic plasma membranes, but as the used method is prone to false negative results, the presence of Cav2.3 at higher densities in PSDs cannot be excluded.
Cav channels are likely to be present also in the AISs of hippocampal PCs and INs. Although there is no available data for the hippocampus, PCs of the neocortex223, Purkinje cells of the cerebellum224 and INs of the dorsal cochlear nucleus225 all express Cav channels in their AISs. In the first two cell types P/Q- and N-type channels, while in the third case T- and R-type channels are present. These channels can be activated by
25
both subthreshold and suprathreshold membrane potential depolarization, and play a role in controlling the pattern and waveform of generated APs225, and thereby neurotransmitter release223.
In contrast, there is clear functional and anatomical evidence demonstrating that Cav channels are present in axon terminals of hippocampal PCs and INs. In this subcellular compartment they mediate the Ca2+ influx necessary for neurotransmitter release226 upon activation by APs and/or subthreshold depolarizing signals227,228. In hippocampal excitatory synapses, application of subtype-specific toxins showed that glutamate release relies primarily on the concerted action of ω-agatoxin IVA-sensitive P/Q-type and ω-conotoxin GVIA-sensitive N-type channels229,230, the ratio of which varies markedly between terminals on the same axon231. In contrast, the majority of distinct IN types rely either on P/Q- or N-type channels232,233, and only a small subset of them uses both subtypes234 for GABA release. The presence of the P/Q-type channels was confirmed on axon terminals of PCs and INs of the CA1 and CA3 area by the high- resolution SDS-FRL method. The Cav2.1 subunit was confined to the AZ of axon terminals and their numbers scaled linearly with the AZ area235,236. Moreover, gold particles labeling the Cav2.1 subunit were non-randomly distributed within AZs of both excitatory and VGAT+ GABAergic axon terminals235,236.
In contrast, the contribution of R-type channels to neurotransmitter release is more controversial235,237,238. Recently it turned out that the SNX482 drug, used to demonstrate the role of this channel in synaptic release, also reduces IA-type K+ currents239. Nevertheless, pre-embedding immunogold reactions showed that the Cav2.3 subunit is present in both excitatory and inhibitory boutons of the CA1 region222. The labeling occupied mostly extrasynaptic membranes, but the lack of labeling in AZs could be the consequence of insufficient penetration into the AZ as a consequence of technical limitation of the used pre-embedding method.
Cav1.2 and Cav1.3 L-type channel subunits have also been shown to be present on hippocampal axon terminals by pre- and post-embedding immunohistochemistry218,219. Electrophysiological recordings in the presence of the L- type channel specific dihydropyridine antagonists (nifedipine) excluded their role in fast synaptic transmission230,240. However, recently it was shown that certain properties attributed to L-type channels, such as slow activation and the lack of contribution to
26
single APs, reflect the state-dependent nature of the dihydropyridine antagonists used to study them, and not the kinetics of native L-type currents241. The authors also found that these channels open over a range of voltages and activate rapidly in response to a variety of stimuli including individual APs, which suggests that they could potentially contribute to fast transmitter release241.
Regarding the axonal location of T-type channels in hippocampal PCs, there is minimal data available. Post-embedding immunogold experiments revealed that the Cav3.1 T-type channel subunit is not present in PC terminals242, but there is no available information concerning the other two T-type channel subunits. Particularly, the presence of the Cav3.2 subunit needs to be checked, as this subunit was localized to the AZ of cortical PCs axon terminals where they regulate glutamate release in conjunction with HCN1 channels243. In contrast, the mentioned post-embedding reactions demonstrated the presence the Cav3.1 T-type channel subunit in hippocampal PV+ basket terminals near the AZ242. It was shown, that the Ca2+ influx triggered by these channels augmented by Ca2+ from internal stores can mediate GABA release242.
2.5. Input- and target cell type-dependent distribution of ion channels
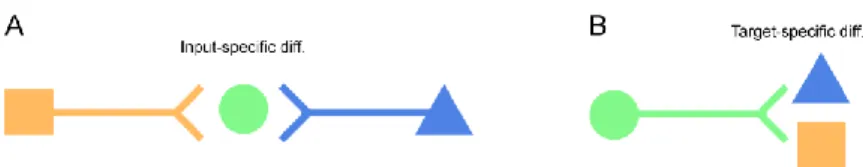
Another fundamental issue regarding the subcellular distribution of ion channels is that excitatory and inhibitory synapses localized in the same subcellular compartment of a given neuron can display differences in the type, number, density and nanoscale distribution of their ion channels. As I will demonstrate in the two following chapters, the exact molecular composition of synapses is determined by the identity of the presynaptic input neuron and/or the cell type of the postsynaptic target neuron (input versus target cell type-dependent differences, Figure 6).
Figure 6. Input- and target cell type-dependent synaptic differences. (A) Input- dependent differences occur between synapses supplied to the same postsynaptic cell by distinct types of presynaptic neurons. (B) In case of target cell type-dependent differences, axon terminals of a single presynaptic neuron diverging onto distinct types of postsynaptic neurons display morphological (and/or functional) differences. Modified from 18.
27
2.5.1. Input- and target cell type-specific distribution of AMPA receptors
AMPA-type glutamate receptors are ubiquitously present in every nerve cell.
Their majority is concentrated in PSDs of glutamatergic synapses, but they are also present at low densities in the extrasynaptic plasma membranes, and occasionally in presynaptic compartments. These receptors are homo- or heterotetramers built from combinations of subunits, which differ in their contribution to channel kinetics, ion selectivity, and receptor trafficking properties, hence creating great structural and functional heterogeneity13,16,17.
Interestingly, Fujiyama et al. (2004) revealed that the subunit composition of AMPA receptors localized on presynaptic axon terminals contacting neostriatal neurons is influenced by the cell-type of the input cell244. While cortico-striatal axon terminals contain presynaptic GluA1, GluA2/3 and GluA4 subunit-containing AMPA receptors, thalamo-striatal terminals are devoid of the GluA4 subunit and express only GluA1 and GluA2/3 in their AZs244. Furthermore, in contrast to cortico-striatal axon terminals, the presynaptic AZ of cortico-cortical terminals is devoid all of the examined AMPA receptor subunits244. This demonstrates, in addition to the presynaptic cell, the identity of the postsynaptic cell also affects the molecular structure of synapses.
In addition to different subunit composition, the nanoscale distribution of AMPA receptors can also show input cell type-specific differences. Accordingly, high- resolution SDS-FRL experiments, employing an antibody that recognizes all four AMPA receptor subunits, revealed differences between the postsynaptic AMPA receptor distribution of retinogeniculate and corticogeniculate synapses formed on relay cells of the dorsal lateral geniculate nucleus245. It was shown that individual corticogeniculate synapses express similar number of AMPA receptors in a larger synaptic area than retinogeniculate synapses245. As AMPA receptors are arranged in microclusters in both synapse types, this resulted in larger intrasynaptic areas devoid of AMPA receptors in corticogeniculate synapses than those in retinogeniculate synapses245. Because AMPA receptor occupancy declines with distance from the site of vesicle fusion246, it was hypothesized that these differences in the distribution of AMPA receptors could endow distinct functional properties to synapses. Numerical simulations, however, showed that AMPA receptor-mediated quantal responses were almost identical in retinogeniculate synapses, displaying homogeneous receptor