Complex Cell Surface Distribution of Voltage- and Ligand-Gated Ion Channels on Cortical
Pyramidal Cells
Ph.D. Dissertation
Katalin Szigeti M.D.
János Szentágothai Doctoral School of Neurosciences Semmelweis University
Supervisor: Zoltán Nusser, D.V.M., D.Sc.
Official reviewers:
Károly Altdorfer, M.D., Ph.D.
Bence Rácz, Ph.D.
Head of the Final Examination Committee:
László Hunyadi, M.D., D.Sc.
Members of the Final Examination Committee:
Katalin Halasy, D.Sc.
Árpád Dobolyi, D.Sc.
Budapest, 2015
2 TABLE OF CONTENTS
ABBREVIATIONS ... 5
1. INTRODUCTION ... 7
1.1. General introduction ̶ The role of ion channels in controlling the activity of cortical neurons ... 7
1.2. The role of potassium channels in controlling neuronal excitability ... 9
1.2.1. Molecular diversity of potassium channels ... 11
1.2.2. The importance of Kv4.2 channels in the brain ... 14
1.2.3. The importance of Kir3 channels in the brain ... 15
1.3. The role of GABAergic inhibition in controlling neuronal excitability ... 16
1.3.1. Molecular and functional diversity of GABAA receptors ... 17
1.3.2. The role of the γ2 subunit in clustering GABAA receptors at inhibitory postsynaptic specializations ... 19
1.4. Structural organization of the studied brain areas……….. ... 21
1.5. SDS-digested freeze-fracture replica labelling electron microscopy to study the two-dimensional distribution of membrane proteins ... 25
2. AIMS OF THE DISSERTATION ... 29
3. MATERIALS AND METHODS ... 30
3.1. Virus injection ... 30
3.2. Tissue preparation for fluorescent immunohistochemistry and SDS-FRL ... 30
3.3. Acute slice preparation for tonic GABAA receptor-mediated current recordings ... 31
3.4. Fluorescent immunohistochemistry ... 32
3.5. SDS-FRL ... 32
3.6. Quantitative analysis of immunogold labelling for the Kv4.2 and Kir3.2 subunits in the rat CA1 region ... 34
3.7. Quantification of immunogold particles labelling GABAA receptors in somata of cortical neurons from injected GABAARγ277Ilox mice ... 35
3.8. Testing the specificity of the immunoreactions ... 37
3.9. Electrophysiological recordings of tonic GABAA receptor-mediated currents37 3.10. Post-hoc visualization of biocytin-filled cells ... 38
3
4. RESULTS ... 40 4.1. Subcellular distribution of the Kv4.2 subunit in the hippocampal CA1 area 40 4.1.1. Distribution of Kv4.2 subunit immunoreactivity in the CA1 region and specificity of the immunoreaction ... 40 4.1.2. High-resolution immunogold localization of the Kv4.2 subunit along the CA1 PC somato-dendritic axis ... 41 4.1.3. Specificity of Kv4.2 subunit immunogold labelling in CA1 PCs using SDS-FRL ... 44 4.1.4. SNAP-25 containing axon terminals have a low density of immunogold particles for the Kv4.2 subunit, which persists in Kv4.2-/- mice ... 45 4.1.5. The Kv4.2 subunit is excluded from the postsynaptic membrane specializations in the CA1 area ... 46 4.2. Subcellular distribution of the Kir3.2 subunit in the hippocampal CA1 area .. 48 4.2.1. Immunofluorescent labelling for three Kir3 subunits in the hippocampal CA1 region ... 48 4.2.2. Distance-dependent increase in the density of Kir3.2 subunits in CA1 PC apical dendrites ... 49 4.2.3. The Kir3.2 subunit is excluded from presynaptic axon terminals in the CA1 region ... 52 4.3. Clustering of GABAA receptors without the γ2 subunit in cortical perisomatic synapses ... 53 4.3.1. Immunofluorescent labelling for distinct GABAA receptor subunits within the virus injection zone ... 54 4.3.2. Increased GABAA receptor δ subunit expression in cortical PV- containing interneurons following γ2 subunit deletion………...56 4.3.3. Fast-spiking interneurons show a larger outward shift in the holding current following SR95531 application……….60 4.3.4. Immunofluorescent labelling for GABAA receptor α5 subunit is unchanged within the virus injection zone……….62 4.3.5. Freeze-fracture replica immunogold labelling demonstrates the synaptic location of GABAA receptor α1 and β3 subunits in perisomatic synapses of cortical Cre+ cells ... 63
4
5. DISCUSSION ... 69
5.1. Novel distribution pattern of the Kv4.2 subunit along the somato-dendritic axis of CA1 PCs ... 69
5.2. Increased immunogold particle density for the Kir3.2 subunits in the distal apical dendrites of CA1 PCs ... 72
5.3. Unique distribution pattern of distinct ion channel subunits in CA1 PCs ... 73
5.4. Clustering of GABAA receptors in the absence of the γ2 subunit in neocortical layer 2/3 cells ... 74
6. CONCLUSIONS ... 79
7. SUMMARY ... 80
8. ÖSSZEFOGLALÁS ... 81
9. REFERENCES ... 82
10. LIST OF OWN PUPLICATIONS ... 99
11. ACKNOWLEDGEMENTS ... 100
5 ABBREVIATIONS
ACSF artificial cerebrospinal fluid AIS axon initial segment
AP action potential
bAP backpropagating action potential
BSA bovine serum albumin
CaMKII Ca2+/calmodulin-dependent protein kinase II
CA. Cornu Ammonis
CNS central nervous system Cre- Cre-recombinase negative Cre+ Cre-recombinase positive
DG dentate gyrus
DPPX dipeptidyl peptidase-like type II proteins (i.e. DPP6, DPP10) E-face exoplasmic face
EPSPs excitatory post synaptic potentials FSINs fast-spiking interneurons
GABAARs GABAA receptors
GCs granule cells
HCN hyperpolarization-activated and cyclic nucleotide-gated channel IA A-type current
IH H-type current
IMP intramembrane particle INs interneurons
IPSCs inhibitory postsynaptic currents IUPHAR International Union of Pharmacology K2P two-pore domain potassium channel KCa Ca2+-activated potassium channels
KChIPs voltage-gated potassium channel-interacting proteins
6
Kir inwardly rectifying potassium channel Kv voltage-gated potassium channel
mIPSCs miniature inhibitory postsynaptic currents
NGS normal goat serum
NL-2 neuroligin-2
P postnatal day
PA picric acid
PALM photoactivation localization microscopy
PB phosphate buffer
PCs pyramidal cells
PFA paraformaldehyde
PKA protein kinase A
PKC protein kinase C
P-face protoplasmic face PSD post synaptic density
PV parvalbumin
SD standard deviation
SDS sodium dodecylsulphate
SDS-FRL sodium dodecylsulphate-digested freeze-fracture replica labelling SLM stratum lacunosum-molculare
SO stratum oriens
SP stratum pyramidale
SR stratum radiatum
STED stimulation emission depletion
STORM stochastic optical reconstruction microscopy TBS Tris-buffered saline
γ2- γ2 subunit-negative γ2+ γ2 subunit-positive
7 1. INTRODUCTION
1.1. General introduction ̶ The role of ion channels in controlling the activity of cortical neurons
Our ability to perceive the environment relies on rapid communication between neurons. Neurons are information processing units that make connections and organize into dynamic networks in order to accomplish various functions. Although a variety of neurons are involved in information processing, they generally fall into two functional classes: principal (or projection) neurons and local circuit interneurons (INs). Principal neurons (which are the main interest of my dissertation) are the most numerous cellular elements of the brain; they receive information from thousands of neurons, which they process and transmit to other neurons that are usually long distances away. To achieve this rapid signalling, the neuronal membrane contains many ion channels, which are responsible for the action potential (AP) generation and propagation (Hille, 2001). The theory of AP propagation was discovered by Hodgkin and Huxley (Hodgkin & Huxley, 1952) who described changes in membrane permeability for Na+ and K+ ions following changes in membrane potential. A few years later the term ’channel’ was given to these ion conducting pores of cell membranes (Armstrong & Hille, 1998; Hille et al., 1999).
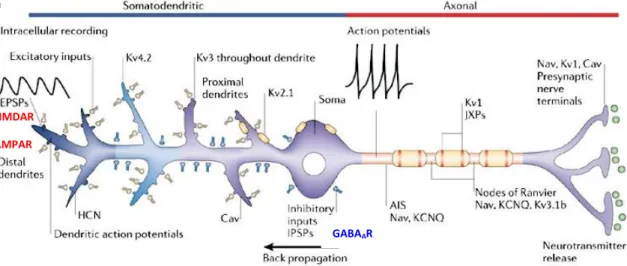
The activity of a single cell is controlled by the orchestrated function of different types of voltage- (i.e. Na+, K+, Ca2+) and ligand-gated (i.e. AMPA, NMDA, GABA receptor) ion channels (Fig. 1.). While voltage-gated ion channels are responsible for conducting electrical signals through large distances along the cell membrane, the activation of excitatory or inhibitory synapses through the ligand-gated ion channels induces small, localized changes in the membrane potential. The various voltage-gated ion channels differently control the excitability of nerve cells. A particular significance has been attributed to voltage-gated potassium channels due to their role in controlling AP propagation and neurotransmitter release (Debanne et al., 1997; Lambe &
Aghajanian, 2001). In addition, the excitability of principal cells (i.e. pyramidal cells (PCs)) is shaped by the activity of local INs, which synapse on different subcellular compartments of the cell (Klausberger & Somogyi, 2008). Synaptically-generated
8
FIGURE 1. Functional role of voltage- and ligand-gated ion channels in controlling the excitability of principal cells. Sodium channels (Nav) together with a subset of voltage-gated potassium channels (KCNQ, Kv1, Kv3.1b) are found in the axon initial segment (AIS), nodes of Ranvier, juxtaparanodes (JXPs) and nerve terminals where they contribute to action potential initiation, propagation and neurotransmitter release.
Calcium channels (Cav) in nerve terminals regulate the transmitter release, while those in dendrites, together with the activation of NMDA and AMPA receptors contribute to local dendritic depolarization, which then propagates towards the soma. Dendritic HCN channels shape the postsynaptic response, while Kv4 channels control the action potential back-propagation. Inhibition of the nerve cell is mediated through GABAAR activation. Modified from (Lai & Jan, 2006).
signals are subjected to the regulatory influence of voltage-dependent ion channels that are activated by both anterograde, synaptically-induced membrane potential changes, and back-propagating action potentials (bAP) (Hoffman et al., 1997; Magee, 1998;
Migliore et al., 1999; Cai et al., 2004; Wang et al., 2014).
Much of what we know about the distribution and influence of voltage- dependent ion channels comes from direct patch-pipette recordings from somata and apical dendrites within ~250 µm of the cell body (Hoffman et al., 1997; Golding &
Spruston, 1998; Chen & Johnston, 2005). For example, the A-type current (IA), mediated by Kv4.2 subunits in hippocampal CA1 PCs, regulates the bAP (Hoffman et al., 1997; Migliore et al., 1999) and synaptic integration (Cai et al., 2004; Makara et al., 2009; Wang et al., 2014). This, however, implies that the ion channels must be present in the plasma membrane and in close proximity to excitatory or inhibitory postsynaptic densities (PSDs). Interestingly, Kv4.2 channels have been localized to inhibitory postsynaptic specializations in the visual cortex and subiculum (Jinno et al., 2005;
Burkhalter et al., 2006), which means that in these areas, Kv4.2 channels may be
NMDAR AMPAR
GABAAR
9
modulated by synaptically released GABA, acting on GABAA receptors (GABAARs) clustered at the postsynaptic site. Conversely, the activation of Kv4.2 channels at GABAergic synapses clamps the postsynaptic membrane at or near the resting potential and weakens inhibition (Burkhalter et al., 2006). However, GABAARs have been found in the extrasynaptic plasma membrane as well (Somogyi et al., 1989; Soltesz et al., 1990; Nusser et al., 1995; Kasugai et al., 2010), where they are activated as a result of an increase in the ambient GABA concentration in the extracellular space (Farrant &
Nusser, 2005) and together with voltage-gated ion channels can influence the membrane voltage of nerve cells. The question then arises, what determines the targeting of GABAARs to either the synaptic or extrasynaptic plasma membrane? The current understanding is that the GABAAR γ2 subunit has an important role in clustering GABAARs at inhibitory synapses (Essrich et al., 1998; Schweizer et al., 2003).
1.2. The role of potassium channels in controlling neuronal excitability
The concept of the excitable cell began with the discovery by Hodgkin and Huxley (Hodgkin & Huxley, 1952) of changes in the permeability of the squid giant axon membrane for Na+ and K+ ions during an AP. Using voltage-clamp recordings, they revealed an inward current generated by Na+ entry into the cytoplasm, which was followed by an outward current mediated by K+ ions. However, the direct evidence for the presence of ion-selective channels came from patch-clamp recordings, developed by Neher and Sakmann (Neher & Sakmann, 1976). With this technique, they were able to detect ionic currents through single acetylcholine receptor channels at the neuromuscular junction of frog skeletal muscle fibres. Later on, the emergence of cloning techniques revealed, the gene sequences of sodium, calcium and potassium channels and X-ray crystallography allowed the three-dimensional reconstruction of the channels (Doyle, 1998; Yu & Catterall, 2004; Long et al., 2005; Yu et al., 2005).
Ionic currents flowing through these channels result in changes in the membrane potential. If the membrane potential becomes more positive compared to the resting membrane potential and exceeds a threshold, an AP is generated, which then travels along the neurites of nerve cells. In a simplified view, the sodium channels are responsible for the rapid rising phase of the AP, while the falling phase is governed by
10
potassium channels. However, the existence of a huge number of genes encoding various ion channel subunits suggests a more complex contribution of individual ion channels to the AP initiation and propagation. Sodium and potassium channels in the dendrites are involved in the generation of local dendritic spikes (Spruston et al., 1995;
Larkum & Nevian, 2008; Kim et al., 2012), while those in the axon initial segment (AIS) and nodes of Ranvier are responsible for AP generation and propagation, and juxtaparanodal potassium channels assist the AP conduction in myelinated axons (Chiu
& Ritchie, 1981; Kole et al., 2007; Shu et al., 2007; Bender & Trussell, 2012; Kole &
Stuart, 2012). Voltage-gated ion channels in axon terminals play roles in the regulation of neurotransmitter release (Dodson & Forsythe, 2004; Lai & Jan, 2006; Neher &
Sakaba, 2008; Bucurenciu et al., 2010).
Among ion channels, the potassium channels are the most numerous; there are over 70 genes encoding potassium channel subunits (Gutman et al., 2003), suggesting that different subunits confer unique electrophysiological properties to each ion channel to fulfil distinct roles in regulating the excitability of nerve cells. The Kvs are exquisitely sensitive to small changes in membrane potential, some of them activating at low-voltage (Kv1, Kv4, Kv7), while others at high-voltage (Kv3, Kv2; Fig. 2.). Low- voltage-activated potassium channels open upon small depolarisations from around the
FIGURE 2. Functional classification of voltage-gated potassium channels. (A) Schematic representation of various potassium current waveforms evoked by voltage steps indicated in the bottom row. (B) Schematic drawing of an action potential shows that each channel activates over a characteristic period of an action potential waveform, as represented by the color-coded arrows. Modified from (Johnston et al., 2010).
11
resting membrane potential, and therefore exert powerful control on the number of APs a cell fires upon the arrival of excitatory post synaptic potentials (EPSP). High-voltage- activated potassium channels are activated when an AP is generated, and due to their fast kinetics they control the duration of APs, and therefore regulate the repetitive firing properties of neurons. The resting membrane potential is generally set by the inward rectifying potassium channel (Kir) family and by the two-pore domain potassium channel (K2P) family (Enyedi & Czirjak, 2010; Luscher & Slesinger, 2010; Mathie et al., 2010).
In addition to the functional heterogeneity, cell type and compartment-specific distribution of Kvs can influence the electrophysiological behaviour of nerve cells, and inhomogeneity in the distribution of ion channels can also have an impact. A good example for such non-uniform voltage-gated channel distribution is the hyperpolarization-activated and cyclic nucleotide-gated (HCN) channel, found in neocortical and hippocampal PCs. Electrophysiological experiments demonstrated that in CA1 PCs, dendritic H-type current (IH) density increases as a function of distance from the soma (Magee, 1998), which is the result of a distance dependent increase in the HCN1 (Lorincz et al., 2002) and HCN2 (Notomi & Shigemoto, 2004) subunit densities.
This greatly influences the propagation of subthreshold voltage transients by decreasing the amplitude and duration of EPSPs and reducing the degree of temporal summation of the EPSPs. Similarly, the Kv4 channel-mediated IA density shows a distance dependent increase along the somato-dendritic axis of CA1 PCs, which greatly attenuates the back- propagation of APs in the apical dendrites (Hoffman et al., 1997; Migliore et al., 1999).
1.2.1. Molecular diversity of potassium channels
Our knowledge of potassium channels originates from the genetic and molecular analysis of potassium channel genes in the fruit fly Drosophila melanogaster. These early studies resulted in the isolation of cDNAs encoding the potassium channel α subunit encoded at the Shaker gene locus in Drosophila melanogaster. Later on the identification of three additional genes, named Shab, Shal, and Shaw and finally the KCNQ, Eag, Erg and Elk genes were described in Drosophila (Jan & Jan, 1997). Using the Shaker cDNAs, Tempel et al. (Tempel et al., 1987) isolated the first mammalian
12
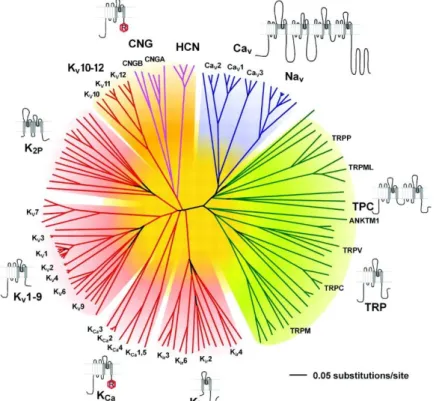
potassium channel cDNA, the Kv1.1. This was followed by the isolation of many other genes, resulting in over 70 genes encoding potassium channel subunits in the mammalian brain (http://iuphar-db.org; Fig. 3.). The increasing number of subtypes necessitated the introduction of sequence homology-based nomenclature (Chandy, 1991) by the International Union of Pharmacology (IUPHAR), which was further complemented with the newly discovered subfamilies (Gutman et al., 2003).
FIGURE 3. The voltage-gated ion channel superfamily. Polygenetic tree showing the 143 members of the structurally-related voltage-gated ion channel genes, with each group highlighted by a different colour. Note that potassium channels (red) form the most diverse group. (Yu et al., 2005)
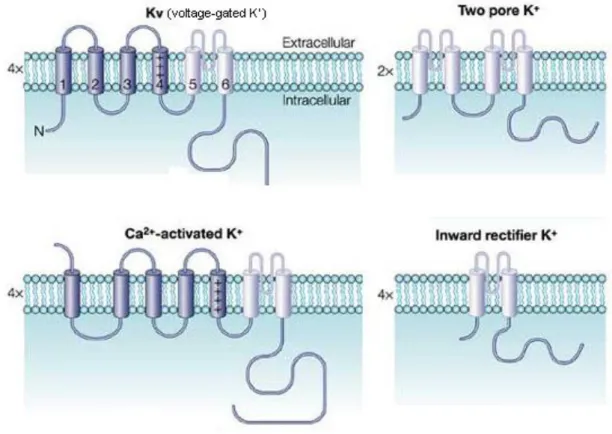
Four main potassium channel families have been identified (Fig. 4.). (1) The largest group is formed by the Kv channels, which are macromolecular protein complexes containing four transmembrane pore-forming subunit, termed α subunit.
These individual potassium channel α subunits have six transmembrane segments (termed S1‒S6) that co-assemble to form tetrameric complexes. The S1‒S4 segments form the voltage-sensing domain and the S5‒S6 segments make up the pore domain.
Additional auxiliary subunits can be assembled to the channels, which can modulate their cell surface expression and kinetics (Vacher et al., 2008). (2) The Ca2+-activated
13
potassium channels (KCa) contain six or seven transmembrane domains to form tetramers, and open upon changes in the intracellular Ca2+ concentration. Some KCa
channels also show voltage-dependent gating. (3) Members of the K2P family are composed of four transmembrane domain and two P loops, and they form dimers. They are often called ”leak channels” because they are constantly active at the resting membrane potential of nerve cells and conduct a background potassium current to keep the cell membrane near the equilibrium potential for K+. (4) The Kir channels derive their name from their capacity to conduct K+ inward more readily than outward.
However, at physiological membrane potentials, these channels mediate K+ efflux, therefore decreasing the excitability of neurons (Luscher & Slesinger, 2010). Kir channels have the simplest transmembrane topology, having two transmembrane segments (M1 and M2) with a P loop. The channels are not gated by changes in trans-
FIGURE 4. The main potassium channel families. Schematic drawings depicting the channel structures for the four main potassium channel categories. Voltage-gated, Ca2+- activated (KCa), and inward rectifier (Kir) potassium channels have four transmembrane domains while the two-pore potassium channels (K2P) have two. Modified from (Swartz, 2004).
14
membrane voltage; a subtype of these channels, the Kir3 subunits, are activated by G protein-coupled receptors (e.g. GABAB, acetylcholine, dopamine, opioid, serotonin, somatostatin and adenosine receptors).
In conjunction with molecular cloning of potassium channels, technical improvement in the field of electrophysiology as well as the development of subunit specific antibodies represented the next step towards our understanding about the distribution of potassium channels. A combination of in situ hybridization histochemistry with immunohistochemical or immunofluorescence techniques using subunit-specific antibodies provided detailed descriptions of the regional, cellular and subcellular distribution of many of the potassium channel subunits (Trimmer & Rhodes, 2004; Lai & Jan, 2006; Vacher et al., 2008).
1.2.2. The importance of Kv4.2 channels in the brain
The Kv4 channels received particular attention as they are responsible for the classical IA, a transient potassium current with low activation threshold close to the resting membrane potential in most neurons (Birnbaum et al., 2004). IA has a major role in a large variety of dendritic processes, including the control of local sodium spike initiation and propagation (Losonczy et al., 2008), the back-propagation of axonally- generated APs into the dendrites (Hoffman et al., 1997; Migliore et al., 1999), synaptic integration and plasticity (Margulis & Tang, 1998; Cash & Yuste, 1999; Watanabe et al., 2002; Frick et al., 2004; Kim & Hoffman, 2008; Makara et al., 2009).
Early immunohistochemical studies demonstrated the widespread distribution of Kv4.2 and Kv4.3 subunits in the central nervous system (Serodio & Rudy, 1998). The mRNA for Kv4.2 was found at high levels in many principal cells, whereas Kv4.3 was found in a subset of principal cells and in many INs (Trimmer & Rhodes, 2004). Light microscopic immunohistochemical studies revealed strong Kv4.2 immunosignal in the dendritic layers of the hippocampal CA1 area (Maletic-Savatic et al., 1995; Varga, 2000; Rhodes et al., 2004; Jinno et al., 2005), suggesting a unique role for Kv4.2 homotetramers in this region. This is further supported by a gene deletion study demonstrating that in hippocampal CA1 PCs dendritic IA is exclusively mediated by the Kv4.2 subunit (Chen et al., 2006). It has been noticed, that the intensity of the
15
immunoperoxidase or fluorescent signal is rather uniform across stratum radiatum (SR) with a slight decrease in the stratum lacunosum-moleculare (SLM). This is in sharp contrast with the finding of Hoffman et al. (Hoffman et al., 1997), who by using dendritic patch-clamp recordings revealed a six-fold increase in the density of IA as a function of distance from proximal to distal main apical dendrites. One possible explanation for the discrepancy between the density of IA and that of Kv4.2 immunolabelling is, that the oblique dendrites or dendritic spines or axon terminals contain a high density of Kv4.2 subunit, which are superimposed and therefore mask the increasing, but lower density of Kv4.2 subunit in the main apical dendrites. Although Kv4.2 subunits have been localized to the dendritic region of the CA1 area with light microscopy, it is still unknown if the increased current density in the apical dendrites of CA1 PCs is indeed the result of an increased channel number.
1.2.3. The importance of Kir3 channels in the brain
Potassium channels formed by the Kir3 subunits are the effectors of many G- protein coupled receptors and are potent regulators of neuronal excitability. Mammals express four Kir3 channel subunits: Kir3.1-3.4. In the brain, Kir3.1-3.3 subunits are common, (Lujan et al., 2009; Luscher & Slesinger, 2010), whereas Kir3.4 expression is low and therefore does not make a substantial contribution to cerebral Kir3 currents (Wickman et al., 2000). Out of the three main neuronal Kir3 subunits, the Kir3.2 subunit is unique in that it can form homotetramers as well as heterotetramers with other Kir3 subunits (e.g. Kir3.1–Kir3.2 and Kir3.2–Kir3.3; (Kofuji et al., 1995; Lesage et al., 1995;
Slesinger et al., 1996)). It is an essential part of the functional channel, determining its cell surface localization (Ma et al., 2002). Biochemical and molecular studies have shown that the Kir3.1–Kir3.2 variant is the predominant form of Kir3 channels in the brain (Liao et al., 1996). Lack of Kir3.2 subunit leads to reduced Kir3.1 subunit expression (Liao et al., 1996; Signorini et al., 1997) and to the loss of slow inhibitory postsynaptic responses in hippocampal PCs (Luscher et al., 1997). Mice without the Kir3.2 subunit also have high susceptibility for epilepsy (Signorini et al., 1997). A major G-protein-coupled receptor activating Kir3 channels is the metabotropic GABAB receptor (GABABRs; (Luscher et al., 1997)). Recent studies have suggested the
16
existence of a signalling complex that contains GABABRs, G proteins and Kir3 channels (David et al., 2006; Fowler et al., 2007). These studies further emphasize the role of Kir3 channels in mediating slow inhibition onto the postsynaptic cell.
Whole-cell patch-clamp and cell-attached recordings have shown the dendritic localization of Kir3 channels in neocortical neurons and in hippocampal CA1 PCs (Takigawa & Alzheimer, 1999; Chen & Johnston, 2005). Moreover, in hippocampal CA1 PCs the level of spontaneous channel activity was significantly higher in apical dendrites than in somata (Takigawa & Alzheimer, 1999; Chen & Johnston, 2005). This increase may come from increased open probability of the channels or increased channel numbers. Indeed, light microscopic immunohistochemistry revealed a gradual increase in the strength of immunoreactivity for the Kir3.1, Kir3.2 and Kir3.3 subunits in distal SR and SLM (Ponce et al., 1996; Koyrakh et al., 2005; Kulik et al., 2006;
Fernandez-Alacid et al., 2011). However, the strength of the immunoreaction cannot be taken as direct evidence for an increased channel number in the distal apical dendrites of CA1 PCs. The increased immunoreactivity might have pre- or postsynaptic origin, thus it is possible that axon terminals or oblique dendrites and spines have higher Kir3 channel density, which masks the lower but increasing density of Kir3 channels in the apical dendrites. Electron microscopic immunogold studies have revealed that these subunits are mainly concentrated to dendritic shafts and spines in dendritic layers of the CA1 area, and occasionally gold particles were observed in axon terminals (Koyrakh et al., 2005; Kulik et al., 2006; Fernandez-Alacid et al., 2011). In spite of detailed subcellular localization studies, the relative densities of Kir3 channels in different axo- somato-dendritic compartments at increasing distances from the soma are still unknown.
1.3. The role of GABAergic inhibition in controlling neuronal excitability
Cortical information processing reflects the interplay of synaptic excitation and inhibition. The combination of these two synaptic conductances has a great impact on the membrane potential and input resistance of principal cells, and plays a fundamental role in regulating neuronal output. However, a special interest was attributed to inhibition because of its key role in shaping cortical activity. Perisomatic inhibition mediated by basket cells expressing either the molecular marker parvalbumin (PV) or
17
cholecystokinin (Somogyi & Klausberger, 2005) has a special role in controlling the output of principal cells. These cells were shown to control sodium-dependent APs (Miles et al., 1996) and spike timing in CA1 PCs (Pouille & Scanziani, 2001) by limiting the temporal summation of EPSPs within a narrow time window (less than 2 milliseconds), thus making PCs coincidence detectors (Konig et al., 1996). In addition to this, several studies described the role of perisomatic inhibition in network oscillations (Cobb et al., 1995; Losonczy et al., 2010; Royer et al., 2012).
Cortical INs exert their activation by releasing the major inhibitory neurotransmitter molecule GABA, which activates ionotropic GABAARs and metabotropic GABABRs. The GABABR is Gi/Go protein-coupled, and thus in addition to association with membrane channels (i.e. Kir3, Cav), it has effects on adenylate cyclase activity. As a result, activation of GABABRs has a slow modulatory effect on distinct neuronal compartments (Bettler et al., 2004; Chalifoux & Carter, 2011). In contrast, ionotropic GABAARs, permeable to Cl- and HCO3-, mediate fast, phasic inhibition, when concentrated in synapses (Farrant & Nusser, 2005). However, activation of GABAARs outside the synapse can also affect neuronal excitability, but these ionic currents are regarded as tonic currents (Farrant & Nusser, 2005). GABAARs are the subject of the second part of my dissertation, therefore in the following chapters I will present a detailed description of the receptor superfamily.
1.3.1. Molecular and functional diversity of GABAA receptors
GABAARs are the major inhibitory receptors in the central nervous system (CNS) and belong to the ligand-gated ion channel superfamily. GABAARs are pentamers, each subunit is composed of four transmembrane α-helices that form an intrinsic anion selective channel (Fig. 5). With the complete sequence of the human genome and few other vertebrate species, it is now clear that there are 19 genes for GABAARs (Simon et al., 2004). These include: six α, three β, three γ, one δ, one ε, one π and one θ GABAARs subunits, and three ρ subunits, which have been called GABAC
receptors (Zhang et al., 2001). Many GABAAR subtypes contain the α-, β- and γ- subunits with the likely stoichiometry of two α, two β and one γ (Olsen & Sieghart, 2008), which are arranged pseudo-symmetrically around the ion channel in the sequence
18
FIGURE 5. Structure of GABAARs. Five subunits from seven subunit subfamilies (α, β, γ, δ, ε, θ and π) assemble to form a heteropentameric Cl--permeable channel. Usually two α subunits, two β subunits and one γ subunit forms the ion channel; the γ subunit can be replaced by δ, ε, θ or π subunits. Binding of the neurotransmitter GABA occurs at the interface between the α and β subunits, and the benzodiazepine (BZs) binding occurs at the interface between the α and γ subunits. (Jacob et al., 2008)
of γ–β–α–β–α, anti-clockwise when viewed from the synaptic cleft (Baumann et al., 2002). It is thought, that the majority of GABAARs contain a single type of α- and β- subunit variant. The α1β2γ2 heteropentamer constitutes the largest population of GABAARs in the CNS, followed by the α2β3γ2 and α3β3γ2 isoforms (Benke et al., 1991a; Benke et al., 1991b; Somogyi et al., 1996). Receptors that incorporate the α4- α5-or α6-subunits, or the β1-, γ1-, γ3-, δ-, ε- and θ-subunits, are less numerous. GABA binding occurs at the β–α subunit interface and the γ–α subunit interface creates the benzodiazepine binding site. A second site for benzodiazepine binding has recently been shown to occur at the β–α interface (Sigel & Luscher, 2011).
The combinatorial co-assembly of these various subunit proteins underlies the structural heterogeneity of GABAARs which is the key determinant of their pharmacological and functional diversity. The pharmacology of GABAARs will be influenced by the γ and the α subunits, without major contribution of the β subunit.
Receptors containing the γ2 subunit exhibit higher benzodiazepine sensitivity than the ones containing the γ1 subunit (Sieghart, 1995; Khom et al., 2006). Receptors containing the γ3 subunit are modulated by benzodiazepine ligands, but with altered selectivity (Sieghart, 1995; Hevers & Luddens, 1998). The type of α subunit gives
19
another layer of complexity to the receptor pharmacology; distinct α subunit-containing receptors show different sensitivity to the benzodiazepine site ligands (Olsen &
Sieghart, 2008). The type of subunit does not only determine receptor pharmacology, but the kinetic properties of GABAAR-mediated inhibitory postsynaptic currents (IPSCs) are also influenced (Eyre et al., 2012). Furthermore, the subunit composition greatly determines the cell surface distribution and dynamic regulation of GABAARs (Farrant & Nusser, 2005). With the development of subunit-specific antibodies it became evident that different brain regions and cell-types show unique expression patterns for most of the GABAARs, whereas the γ2 subunit is expressed in almost every brain region and cell type (Wisden et al., 1992; Fritschy & Mohler, 1995; Pirker et al., 2000).
1.3.2. The role of the γ2 subunit in clustering GABAA receptors at inhibitory postsynaptic specializations
Studies using light microscopic immunofluorescence and electron microscopic immunogold methods allowed the precise subcellular localization of GABAAR α1, α2, α3, α6, β2/3 and γ2 subunits within the postsynaptic specializations of GABAergic synapses in many brain regions, including the cerebellum, globus pallidus, hippocampus and neocortex (Fritschy & Mohler, 1995; Nusser et al., 1995; Somogyi et al., 1996;
Nusser et al., 1998; Panzanelli et al., 2011). Some of these subunits were also found in extrasynaptic plasma membranes (Farrant & Nusser, 2005; Kasugai et al., 2010); cell surface receptors are highly mobile, they can distribute dynamically between synaptic and extrasynaptic locations (Jacob et al., 2005; Triller & Choquet, 2005; Bogdanov et al., 2006).
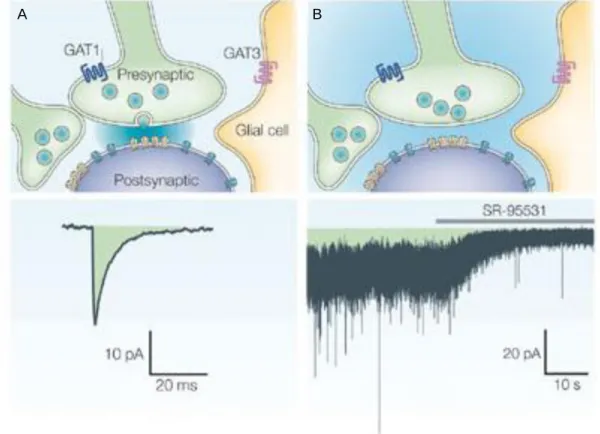
Receptors incorporating the γ2 subunit cluster at GABAergic synapses and they mediate fast inhibitory synaptic currents, regarded as phasic inhibition (Fig.6.A.) (Farrant & Nusser, 2005). This is particularly important, as the rapid synchronous activation of postsynaptic GABAARs exerts a spatially and temporally localized inhibitory conductance to the postsynaptic neuron. In a subset of cells, the δ subunit is incorporated into the heteropentamer receptor channel in the place of the γ2 subunit, but these receptors were found exclusively in the extrasynaptic plasma membrane, where
20
they respond to the ambient concentration of GABA and exert a slow tonic inhibition onto the postsynaptic cell (Fig. 6.B.) (Farrant & Nusser, 2005). The δ subunit forms receptors specifically with the α6 and β2/3 subunits in cerebellar granule cells (GCs), and with the α4 and α1 subunits in thalamus and dentate gyrus (DG) GCs (Olsen &
Sieghart, 2008), and in a subset of DG INs, respectively (Glykys et al., 2007).
FIGURE 6. GABAAR localization and modes of activation. (A) GABAARs clustered in the membrane beneath the release site (yellow) will be activated by the release of a single vesicle from the presynaptic nerve terminal. The blue shading indicates the spread of released GABA. Below the image averaged waveform of miniature inhibitory postsynaptic currents (mIPSCs) is shown. (B) Low concentration of ambient GABA (blue shading) activates GABAARs localized in the extrasynaptic plasma membrane.
The trace shows the tonic current that results from stochastic opening of these GABAARs, with superimposed phasic currents. The GABAAR antagonist, SR-95531 blocks the phasic current and the tonic current, causing an outward shift in the holding current. Modified from (Farrant & Nusser, 2005).
The PSD of GABAergic synapses contains a large repertoire of proteins which were shown to have a role in the targeting and stabilization of GABAARs at the synapse.
Gephyrin is the most important scaffolding protein for the stabilization of GABAARs at both GABAergic and glycinergic synapses (Fritschy et al., 2008; Tyagarajan &
A B
21
Fritschy, 2014). In addition to this, the role of neuroligin-2 (NL-2) and collybistin was also described (Luscher et al., 2011); NL-2 can interact with gephyrin to specifically activate collybistin, and subsequently guide membrane tethering of the inhibitory postsynaptic scaffold, together with the recruitment of GABAARs to these sites (Poulopoulos et al., 2009). However, some studies (Essrich et al., 1998; Schweizer et al., 2003) indicate the crucial role of γ2 subunits, as its deletion resulted in profound reduction in the clustering of both GABAARs and gephyrin.
The uniqueness of the γ2 subunit is further emphasized by the fact that genetic deletion of the 2, but not the and subunits, led to early postnatal lethality (Gunther et al., 1995; Homanics et al., 1997; Sur et al., 2001; Vicini et al., 2001). This rendered more difficult the study of γ2 subunit function in the CNS; therefore early studies were performed either in new-born animals (Gunther et al., 1995), cell cultures (Essrich et al., 1998; Brunig et al., 2002; Alldred et al., 2005) or upon developmentally-timed, Cre- recombinase-mediated deletion (Schweizer et al., 2003). Although the study by Gunther et al. (Gunther et al., 1995) reported no change in the mRNA expression and regional and subcellular distribution of major GABAAR subunits, other gene deletion studies (Essrich et al., 1998; Brunig et al., 2002; Schweizer et al., 2003; Alldred et al., 2005;
Sumegi et al., 2012; Rovo et al., 2014) have unequivocally found that clustering of the
1, 2 and 2/3 subunits in cells obtained from 2-/- mice were disrupted. Interestingly, Essrich et al. (Essrich et al., 1998) reported that some of the cultured neurons from 2-/- mice exhibited GABAAR-mediated IPSCs, despite the complete removal of the γ2 subunit. A previous study from our laboratory (Sumegi et al., 2012) also detected GABAAR-mediated IPSCs in 2-/- cultured neurons, demonstrating that GABAARs could still generate synaptic-like currents without the 2 subunit. However, it should be noted that the presence of synaptic-like currents does not necessarily mean that the underlying GABAARs are concentrated within the GABAergic postsynaptic specializations.
1.4. Structural organization of the studied brain areas
The cerebral cortex is the thin outer layer of the cerebral hemispheres that is responsible for much of the planning and execution of actions in everyday life.
22
Phylogenetically, the most recent part of the cortex is the neocortex, and the more ancient part of the cortex is the archicortex, which includes the hippocampus. In order to understand how such complex structures operate, one has to break down to its elementary structures (i.e. cells) and study the molecular organization of individual nerve cells, moreover the properties of individual synapses which together greatly influence the function of nerve cells. To address the aims of my dissertation, I studied the rodent hippocampus (Chapter 4.1. and 4.2.) and somatosensory cortex (Chapter 4.3).
The neocortex has six layers, which are numbered with Roman numerals from superficial to deep. Layer I is the molecular layer, which contains the dendrites of the cells located in the deeper layers, and very few neurons; layer II the external granular layer, is composed of small spherical cells; layer III the external pyramidal layer, contains many cell types; layer IV the internal granular layer; layer V is the internal pyramidal layer; and layer VI the multiform, or fusiform layer. The number of layers and the structural organization vary throughout the cortex; for example, the primary visual cortex has an extremely prominent layer IV that typically is further subdivided into at least three sublayer, in contrast, the primary motor cortex has no layer IV (Shepherd, 2004).
There are two basic types of neurons: projection neurons with spiny dendrites, which are excitatory (i.e. stellate cells and PCs), and local INs with smooth dendrites, which are inhibitory (Fig. 7.). Stellate and PCs are confined to layers II/III, IV, V and VI, whereas INs can be found throughout the cortical layers, where contact distinct subcellular compartments of principal cells, and comprise the most diverse cell population of the cortex. On one hand, their heterogeneity arises from their morphological diversity, which is attributable to their axonal arborisations that selectively target different compartments of PCs; e.g. basket cells inhibit the somatic and proximal dendritic region of principal cells, axo-axonic or Chandelier cells target the AIS, and Martinotti cells synapse on the apical dendritic region of PCs. On the other hand, the electrophysiological properties confer another layer of diversity; based on firing pattern, INs are classified as fast-spiking, non-adapting non-fast spiking, adapting, irregular spiking, intrinsic bursting and accelerating (Ascoli et al., 2008).
Finally, the protein expression is also characteristic to certain IN subtypes (Somogyi &
23
Klausberger, 2005; Klausberger & Somogyi, 2008; Eyre et al., 2009; DeFelipe et al., 2013).
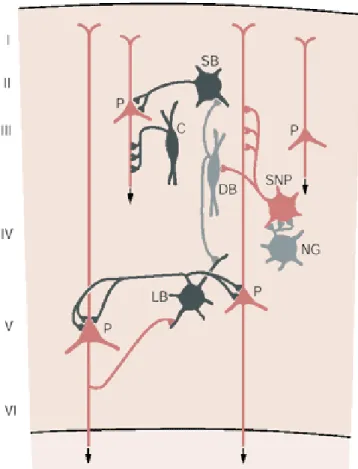
FIGURE 7. Synaptic organization of the neocortex. Principal cells (red) of the neocortex, including pyramidal cells (P) and spiny non-pyramidal cells (SNP) are localized to different layers and send long range excitatory connections to subcortical and cortical areas. Different types of GABAergic interneurons (grey) have different connections with principal cells. Chandelier cells (C) terminate exclusively on the axon initial segment of pyramidal cells; the large and small basket cells (LB, SB) innervate the perisomatic region; double bouquet cells (DB) innervate other interneurons; the neurogliaform cells (NG) can also inhibit other nearby cortical neurons by releasing the neurotransmitter GABA into the extracellular space. Adapted from (Kandel, 2000 )
The neocortex receives input from the thalamus (layer IV), from other cortical regions on both sides of the brain (layer I to III) and from a variety of other sources, including the locus coeruleus (axons containing noradrenalin, mostly in layer VI), the ventral tegmental area and substantia nigra (dopaminergic pathway in all layers, except layer IV), the raphe (serotoninergic fibres in all layers), and the basal forebrain (cholinergic fibres in all layers; (Shepherd, 2004)). Layers V and VI, primarily connect the neocortex with subcortical regions, whereas layer II/III PCs give rise to corticocortical projections.
24
The hippocampus is probably the most widely studied and most thoroughly characterized region of the brain, which is attributable to its relative simple anatomical structure and its critical role in learning and memory, revealed in the 1950s (Scoville &
Milner, 1957). The hippocampal formation includes the DG, hippocampus (Cornu Ammonis, CA), and subiculum. The hippocampus was further divided into subregions, termed CA1, CA2 and CA3 region. The hippocampal formation has also laminar organization; however, in contrast to the neocortex has a single cell layer, containing the principal cells. There are two types of principal cells in the hippocampus: the GCs in the DG, which lie in the granule cell layer, and the PCs in CA1 to CA3 regions, found in the pyramidal cell layer (PCL). Layers below and above the principal cell layer contain the local INs, which based on axonal target area, differently influence the activity of principal cells (Somogyi & Klausberger, 2005; Klausberger & Somogyi, 2008).
FIGURE 8. The thri-synaptic circuit of the hippocampus. The main input of the hippocampus originates from the entorhinal cortex (EC) that forms connections on granule cells of the dentate gyrus (DG) and pyramidal neurons of the hippocampus (CA3 to CA1) via the perforant path (PP). CA3 pyramidal neurons also receive input from the DG via the mossy fibers (MF). They send axons to the CA1 pyramidal cells via the Schaffer collaterals (SC) and to the contralateral CA1 region via the associational commissural pathway (AC). CA1 neurons send axons to the pyramidal cells of the subiculum (Sb), which send axons back to the EC. Adapted from University of Bristol, Centre for Synaptic Plasticity (http://www.bristol.ac.uk/synaptic/pathways)
The DG is the first stage of the hippocampal tri-synaptic circuit (Fig. 8.). Its main input is the perforant path, which originates from the superficial layers of the entorhinal cortex. In addition, the DG receives GABAergic and cholinergic input from the medial septum and the diagonal band of Broca. The principal neurons of the DG are the GCs,
25
which give rise to unmyelinated axons called the mossy fibres that project to the CA3 region.
The CA3 region receives input from the mossy fibres of DG GCs and the perforant path from the entorhinal cortex. The mossy fibre pathway terminates on the proximal dendrites of PCs, in the stratum lucidum, while the perforant path terminates on the distal dendrites of CA3 PCs, in the stratum lacunosum-moleculare (SLM). PCs of the CA3 region project towards the CA2 and CA1 areas (where form the Schaffer collaterals). CA3 PCs also send recurrent connections to other CA3 cells in the septal or dorsal direction. In addition, the CA3 region sends output fibres to the lateral septum. CA2 is a small region between CA3 and CA1. It receives perforant path input but does not receive mossy fibre connections, and its PCs are more similar to those in CA3 than those in the CA1 region.
The CA1 region forms the most significant output of the hippocampal circuit to the subiculum and to the layer V of the entorhinal cortex. It receives input from the superficial entorhinal cortex along the perforant pathway, which terminates in the SLM on the distal dendrites of CA1 PCs. Schaffer collaterals synapse on the proximal dendrites, in the stratum radiatum (SR). Unlike CA3, the CA1 region contains very few recurrent connections, which enter the stratum oriens (SO) and the PCL.
The subiculum receives its primary input from the CA1 region and from layer III of entorhinal cortex. Sends output to layer V of entorhinal cortex, but it also projects into many other areas, including the nucleus accumbens, the anterior thalamic nuclei, the medial mammillary nucleus, the lateral septum, and the presubiculum.
1.5. SDS-digested freeze-fracture replica labelling electron microscopy to study the two-dimensional distribution of membrane proteins
Most of our knowledge on the distribution of ion channels comes from light microscopic immunofluorescence and immunoperoxidase reactions (Fritschy & Mohler, 1995; Ponce et al., 1996; Pirker et al., 2000; Trimmer & Rhodes, 2004; Koyrakh et al., 2005; Panzanelli et al., 2011). Although these methods have high sensitivity, it does not allow the determination of exact ion channel densities, and it has been difficult to study sub-synaptic structures because the small size of the synapse is close to the diffraction- limited resolution of light microscopy. Nowadays with the development of new super- resolution techniques (stimulation emission depletion (STED); stochastic optical
26
reconstruction microscopy; photoactivation localization microscopy (PALM); reviewed by Maglione and Sigrist (Maglione & Sigrist, 2013)) it become possible to study the protein architecture of small subcellular structures such as synapses (Kittel et al., 2006;
Dani et al., 2010). However, unlike electron microscopy, they do not provide intrinsic contrast of membranes, which is particularly powerful for identifying structures such as the synaptic cleft or vesicles or when the plasma membrane distribution of a given ion channel is investigated in distinct axo-somato-dendritic compartments. Electron microscopic immunoperoxidase studies of potassium channel subunits Kv4.2 (Alonso &
Widmer, 1997) and Kv3.1b (Sekirnjak et al., 1997) revealed the first plasma membrane labelling. However, due to the diffusible nature of the reaction end-product of the peroxidase enzyme reaction, this method is not suitable for quantification. In contrast, pre-embedding and post-embedding immunogold methods are more suitable for high- resolution localization and quantification of molecules (Nusser, 1999). However, gold particles representing membrane protein epitopes are distributed on either side of the membrane, therefore specific control must be done to confirm that the antibody recognizes the desired target. A limitation of the post-embedding immunogold method is imposed by resins, which restrict antibody diffusion; therefore only those antigen molecules are detected which are exposed at the section surface (Amiry-Moghaddam &
Ottersen, 2013). Limitations of these electron microscopic techniques were overcome, by a new electron microscopic immunogold technique, the sodium dodecylsulphate- digested freeze-fracture replica labelling (SDS-FRL; (Fujimoto, 1995)).
Freeze-fracture electron microscopy has been established as a major technique in ultrastructure research since the 1950s (Steere, 1957). The technique provided great advances in our understanding of the two-dimensional structural organisation of cellular membranes and organelles. However, it was as late as in the 1990s, when it became possible to identify the chemical nature of the structural components of cell membranes revealed by freeze-fracture electron microscopy. By combining the freeze-fracture technique with immunogold cytochemistry (what has been called SDS-FRL), Fujimoto was the first to describe immunogold labelling of intercellular junction proteins (Fujimoto, 1995). This was followed by many other descriptions as well as quantitative analysis of the molecular components of the neuronal plasma membrane, including gap junction proteins, plasma membrane receptors, ion channels and proteins related to the
27
release machinery (Nagy et al., 2004; Hagiwara et al., 2005; Tanaka et al., 2005;
Masugi-Tokita & Shigemoto, 2007; Tarusawa et al., 2009; Kasugai et al., 2010;
Kaufmann et al., 2010; Indriati et al., 2013).
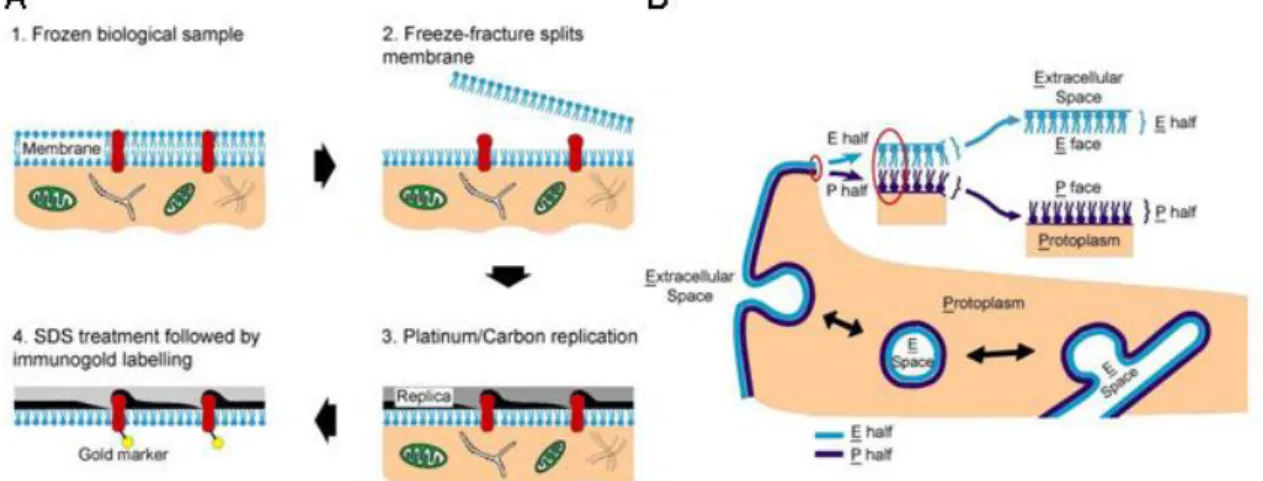
The critical feature of the SDS-FRL technique is the fracture plane, which often follows a plane through the central hydrophobic core of the frozen membranes, splitting them into half-membrane leaflets (Fig. 9.A). The result is a three-dimensional view of the plasma membrane, with en face views of the membrane interior. The fractured membrane halves correspond to a phospholipid monolayer with associated proteins: the membrane half located adjacent to the protoplasm is called protoplasmic-face (P-face), while the membrane half adjacent to the extracellular space is called exoplasmic-face (E-face; Fig. 9.B). Details of the plasma membrane are made visible in the electron microscope by making a thin carbon-platinum-carbon replica of the fracture plane. The platinum is evaporated onto the specimen at an angle, so that it is deposited in varying thicknesses according to the topography of the fractured surface. As a result, high- resolution details of membrane structure are revealed, so that the integral membrane proteins (regarded as intramembrane particles (IMPs)) become visible. The tissue from the replica is removed by digestion with sodium dodecylsulphate (SDS). Although SDS dissolves unfractured portions of the membrane, it would not digest the split membrane halves, as their apolar domains are positioned against, and stabilized by, their carbon/
FIGURE 9. SDS-digested freeze-fracture replica-labelling. (A) The key steps in SDS-FRL: 1. Tissue is frozen. 2. The freeze-fracture process splits the lipid bilayer exposing the fracture face. 3. The specimen is evaporated by carbon/platinum/carbon. 4.
The replica is treated with SDS to remove the tissue, followed by immunogold labelling. (B) Schematic illustrations of the two membrane halves after freeze- fracturing. Modified from (Robenek & Severs, 2008).
28
platinum/carbon casts (Fujimoto, 1995), therefore it is possible to label both the inner (P-face) and the outer (E-face) leaflets of the cellular membranes. Depending on the epitope of a given primary antibody against the studied membrane protein, the immunogold labelling will be visualized either on the P-face or the E-face. The key steps of performing SDS-FRL are illustrated in Fig. 9., and will be described in details in Chapter 3.5. The major advantage of the technique is its high sensitivity (Tanaka et al., 2005) and the possibility of multiple labelling. Therefore, to address the aims of my dissertation I adopted the SDS-FRL technique.
29 2. AIMS OF THE DISSERTATION
In the first part of the dissertation my general aims were to investigate the cell surface distribution of two different potassium channels in rat CA1 PCs by using the highly selective high-resolution SDS-FRL method. In the second part of the dissertation I used the Cre-dependent virus-mediated 2 subunit deletion strategy in combination with light microscopic immunofluorescent and electron microscopic SDS-FRL techniques to challenge the longstanding view on the role of γ2 subunits in clustering GABAARs at inhibitory postsynaptic specializations.
My specific aims for the first part are:
1. What is the precise subcellular distribution pattern of the two potassium channel subunit (Kv4.2, Kir3.2) on distinct axo-somato-dendritic compartments in CA1 PCs?
2. Does the Kv4.2 channel density follow the six-fold increase in IA density along the proximo-distal axis of PCs?
3. Is the increased Kir3 channel activity in the distal dendrites of CA1 PCs mirrored by an increased channel density?
My specific aims for the second part are:
1. Is the γ2 subunit necessary for clustering GABAARs at inhibitory postsynaptic specializations in the sensorimotor cortex of GABAARγ277Iloxmice?
2. What is the precise subcellular location of GABAARs underlying the miniature IPSCs (mIPSCs) in cortical layer 2/3 cells lacking the 2 subunit?
3. What is the subunit composition and densities of synaptic GABAARsin neurons lacking the 2 subunit?
Contributions:
The study on the role of the γ2 subunit (Chapter 4.3) was done in collaboration with my colleague Dr. Mark D. Eyre. He performed all whole-cell patch-clamp recordings that I am not going to present in this dissertation, while I carried out all light microscopic immunofluorescent and electron microscopic immunogold labellings of distinct GABAAR subunits. In addition, the tonic GABAAR-mediated current recordings presented in Chapter 4.3.3 were performed by Mark Eyre.
30 3. MATERIALS AND METHODS
All experimental procedures were carried out in accordance with the ethical guidelines of the Institute of Experimental Medicine of the Hungarian Academy of Sciences, which is in line with the European Union regulation of animal experimentations.
3.1. Virus injection
Male and female mice in which the γ2 gene is flanked by two loxP sites, and the 77th amino acid is mutated from phenylalanine to isoleucine (GABAARγ277Ilox mice;
(Wulff et al., 2007) between 22 and 40 days postnatal (P) were anaesthetized with a mixture of ketamine:piplophen:xylazine (62.5:6.25:12.5 μg (g body weight)−1) and 0.6 μl adeno-associated virus expressing a Cre-GFP fusion protein with a nuclear localization signal motif under a human synapsin promoter (AAV2/9 .hSynapsin.
hGHintron. GFP-Cre. WPRE. SV40 (p1848), University of Pennsylvania Vector Core, Philadelphia, USA) was stereotaxically injected into the somatosensory cortex at 0.1 μl min−1 flow rate. The Cre-lox system is a tool for generating tissue-specific knockout mice and reporter mouse strains (Nagy, 2000). The Cre-recombinase of the P1 bacteriophage belongs to the integrase family of site-specific recombinases. It catalyses the recombination between two of its recognition sites, called loxP (Hamilton &
Abremski, 1984). When the target gene (in my dissertation the γ2 gene) is flanked by two loxP sites oriented in the same direction, upon Cre-recombinase activation (here introduced virally into a small portion of the somatosensory cortex), the target gene will be deleted.
After the surgery the animals were allowed to recover either 2 weeks or 6 weeks.
Slices for electrophysiological recordings were prepared 2 weeks after injection.
3.2. Tissue preparation for fluorescent immunohistochemistry and SDS-FRL
Adult male Wistar rats (P25‒P52; n = 17), male wild-type (n = 3) and Kv4.2-/- mice (P68‒P217; kindly provided by Prof. Daniel Johnston; n = 3) as well as male and
31
female GABAARγ277Ilox mice (P36‒P80; n = 22) were deeply anesthetized with ketamine (0.5ml/100g). The animals were transcardially perfused with ice cold saline solution for one minute than followed by a fixative. For light microscopic immunofluorescent reactions animals were perfused with a fixative containing either 2
% or 4 % paraformaldehyde (PFA) and 15v/v % picric acid (PA) made up in 0.1 M phosphate buffer (PB) for 15‒20 minutes, or with 2 % PFA in 0.1M Na-acetate for 15 minutes. Some animals were perfused with ice cold oxygenated artificial cerebrospinal fluid (ACSF) for 4 minutes followed by 50 minutes postfixation in 4 % PFA and 15v/v
% PA in 0.1 M BP (Notter et al., 2014). Afterwards 60 or 70 µm coronal forebrain sections were cut with a vibratome (VT1000S; Leica Microsystems, Wetzlar, Germany). For SDS-FRL animals were perfused with a fixative containing 2 % PFA and 15v/v % PA in 0.1 M PB for 15‒16 minutes. Coronal sections of 80 µm thickness were cut, and then small tissue blocks from the dorsal hippocampus and from injected somatosensory cortex were trimmed. Tissue blocks from the injected cortical area were cut out based on the endogenous GFP signal in a way that a small non-injected area surrounded the injection zone. Sections were then cryoprotected overnight in 30 % glycerol.
3.3. Acute slice preparation for tonic GABAA receptor-mediated current recordings
Injected mice (n = 12) were deeply anaesthetized with Isoflurane (Abbott Laboratories Kft., Budapest, Hungary). After decapitation, the brain was removed and placed into ice-cold ACSF containing (in mM): 230 sucrose, 2.5 KCl, 25 glucose, 1.25 NaH2PO4, 24 NaHCO3, 4 MgCl2, and 0.5 CaCl2. Coronal slices from the cerebral cortex were cut at 250 µm thickness with a vibratome (VT1000S; Leica Microsystems) and were stored in ACSF containing (in mM): 126 NaCl, 2.5 KCl, 25 glucose, 1.25 NaH2PO4, 24 NaHCO3, 2 MgCl2 and 2 CaCl2. All extracellular solutions were bubbled continuously with 95% O2 and 5% CO2, resulting in a pH of 7.4. After a 30 minute recovery period at 33 °C, slices were further incubated at room temperature until they were transferred to the recording chamber.
32 3.4. Fluorescent immunohistochemistry
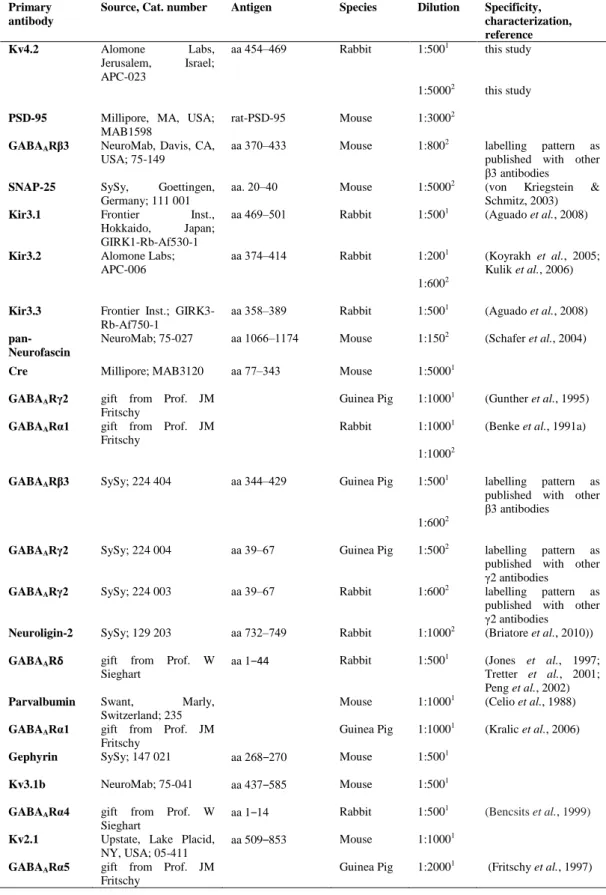
Following several washings in 0.1 M PB and Tris-buffered saline (TBS), free- floating sections were blocked in 10 % normal goat serum (NGS), followed by an overnight incubation in the primary antibody solution made up in TBS containing 2 % NGS and 0.1 % Triton X-100. The used primary antibodies are listed in Table 1. Next, sections were incubated in a mixture of secondary antibody solutions made up in TBS containing 2 % NGS with or without 0.1 % Triton X-100 for 2 hours. The following secondary antibodies were used: A488-conjugated goat anti-rabbit (1:500; Life Technologies, Carlsbad, CA, USA) and goat anti-guinea pig IgGs (1:500; Life Technologies), Cy3-conjugated goat anti-rabbit (1:1000; Jackson ImmunoResearch Europe Ltd, Newmarket, UK ) and donkey anti-guinea pig IgGs (1:1000, Jackson) and Cy5-conjugated goat anti-mouse IgGs (1:500, Jackson). Finally, the sections were washed and mounted on glass slides in Vectashield (Vector Laboratories, Burlingame, CA, USA). Images from the CA1 region and from injected or non-injected cortices were acquired using a confocal laser scanning microscope (FV1000; Olympus, Tokyo, Japan) with 10X (NA = 0.4), 20X (NA = 0.75) or 60X (NA = 1.35) objectives.
3.5. SDS-FRL
Small tissue blocks from the CA1 region and injected cortex were frozen in a high-pressure freezing machine (HPM 100, Leica Microsystems, Vienna, Austria) and fractured at -135 ºC in a freeze-fracture machine (BAF060, Leica Microsystems). The fractured tissue surfaces were coated with thin layers of carbon (5 nm), platinum (2 nm) and carbon (20 nm). Tissue debris from the replicas were digested in a solution containing 2.5 % SDS and 20 % sucrose in TBS (pH = 8.3) at 80 ºC overnight.
Following several washes in TBS containing 0.05 % bovine serum albumin (BSA), replicas were blocked in TBS containing 0.1 %‒5 % BSA for 1 hour, then incubated overnight in blocking solution containing the primary antibodies listed in Table 1.
Replicas were then incubated for 2 hours in TBS containing either 1 % or 5 % BSA and the following secondary antibodies: goat anti-rabbit IgGs coupled to 10 nm gold particles (1:100; British Biocell International, Cardiff, UK), goat anti-mouse IgGs