Cell type-specific molecular anatomy of the endocannabinoid system at cortical synapses
Ph.D. thesis
Barna Dudok
Semmelweis University
János Szentágothai Doctoral School of Neurosciences
Supervisor: István Katona, DSc
Official Reviewers of the Ph.D. Dissertation: Zoltán Kisvárday, DSc Zita Puskár, PhD
Members of the Final Examination Board: János Réthelyi, PhD Alán Alpár, PhD Ágnes Kittel,DSc
Budapest
2016
1
Table of Contents
List of abbreviations ... 3
1. Introduction ... 5
1.1. Endocannabinoid signaling... 6
1.1.1. Discovery of the endocannabinoid system ... 6
1.1.2. Enzymatic pathways of the endocannabinoid system ... 7
1.1.3. Cannabinoid receptors ... 10
1.1.4. Endocannabinoid-mediated synaptic plasticity ... 13
1.2. Organization of the hippocampal circuit ... 15
1.2.1. Anatomical organization of the hippocampal formation ... 15
1.2.2. Structure and connectivity in the CA1 ... 17
1.2.3. Diversity of interneurons ... 18
1.3. Subtypes and roles of CB1–expressing interneurons in the CA1 ... 20
1.3.1. Distinctive features of CB1-expressing interneurons ... 20
1.3.2. Role of CB1–expressing interneurons in network function ... 21
1.4. Super-resolution microscopy methods ... 21
1.4.1. Principle of super-resolution microscopy ... 21
1.4.2. Multi-channel and three-dimensional STORM imaging ... 25
1.4.3. Determining the resolution, and visualizing STORM data ... 26
2. Objectives ... 28
3. Methods ... 29
3.1. Animals ... 29
3.2. Chronic drug treatment... 30
3.3. Patch-clamp recording ... 30
3.4. Cell culture ... 31
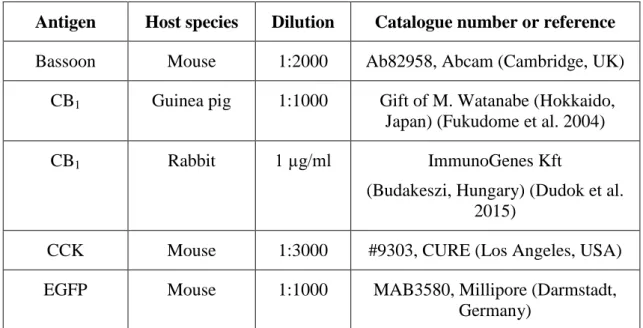
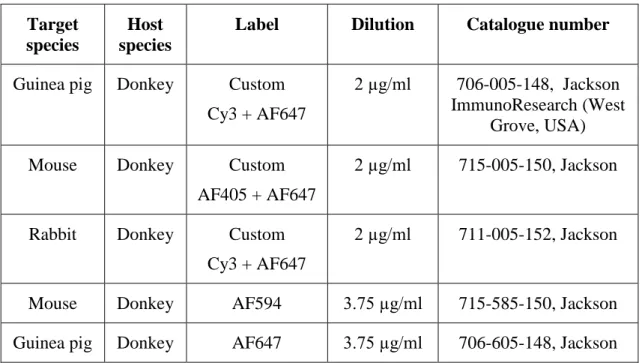
3.5. Immunostaining ... 31
3.6. Microscopy ... 33
3.7. Image analysis ... 35
3.8. Statistical analysis and figure preparation ... 37
3.9. Personal contribution to the results ... 38
4. Results ... 40
4.1. STORM super-resolution imaging in cell culture model ... 40
2
4.1.1. Assessing the quantitative power of STORM ... 40
4.1.2. Optical sectioning properties of 3D-STORM ... 44
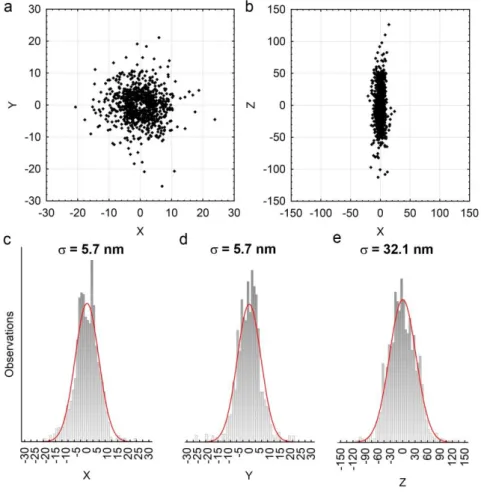
4.1.3. Determining the localization precision of STORM images ... 45
4.2. STORM super-resolution imaging of cannabinoid receptors in brain tissue ... 47
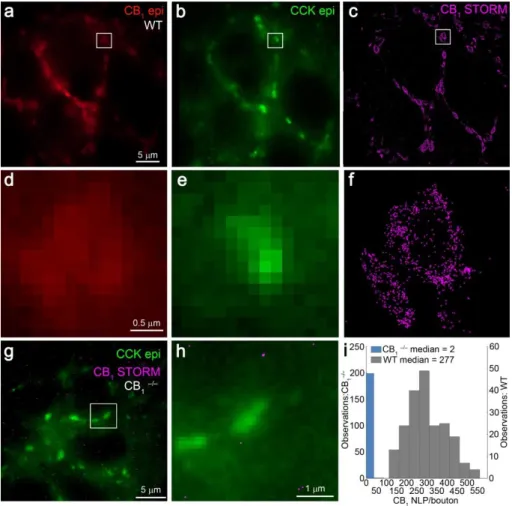
4.2.1. Validating the immunostaining and imaging protocol ... 47
4.2.2. Implementing STORM for studying identified neurons ... 50
4.3. Distribution of CB1 on axon terminals of perisomatically and dendritically targeting interneurons ... 56
4.3.1. The abundance of CB1 on GABAergic axon terminals ... 56
4.3.2. Validation of the CB1 density measurements ... 59
4.3.3. Nanoscale distribution of CB1 on the membrane of GABAergic axon terminals 61 4.4. Organization of presynaptic active zones in CB1-positive axon terminals ... 66
4.4.1. Nanoscale distribution of bassoon STORM labeling ... 66
4.4.2. Cell type-specific alterations in local CB1 receptor to effector ratio ... 69
4.5. Dynamic reorganization of CB1 distribution on agonist application ... 73
4.5.1. Effects of endocannabinoids on CB1 localization ... 73
4.5.2. Effect of exogenous THC on CB1 localization ... 75
5. Discussion ... 80
5.1. Cell-specific STORM enables relative quantitative nanoscale imaging on axon terminals of identified neurons... 80
5.2. Uniform distribution of presynaptic CB1 receptors ... 82
5.3. Implications for the cannabinoid control of synapses ... 83
5.4. Different presynaptic active zone architecture in perisomatically- and dendritically- targeting interneurons ... 84
5.5. Distinctive features of cannabinoid signaling at GABAergic synapses ... 85
5.6. Molecular background of cannabinoid tolerance ... 86
6. Conclusions ... 89
7. Summary ... 90
8. Összefoglalás ... 91
9. References ... 92
10. List of publications ... 117
11. Acknowledgements ... 118
3
List of abbreviations
2-AG 2-arahydonoylglycerol
ABHD α/β-Hydrolase Domain Containing (protein)
ACSF Artificial Cerebrospinal Fluid
AF Alexa Fluor (a family of fluorescent dye molecules)
BDI Bouton Distribution Index
CA Cornu ammonis, hippocampus
CBD Cannabidiol
CCK Cholecystokinin
CNS Central Nervous System
COX Cyclooxygenase
CV Coefficient of Variation
Cy3 Cyanine3 (a fluorescent dye molecule)
DMSO Dimethyl sulfoxide
DPBS Dulbecco’s Phosphate Buffered Saline
DSI Depolarization-induced Suppression of Inhibition
DtIN Dendritically-targeting interneuron
EGFP Enhanced Green Fluorescent Protein
EMCCD Electron-Multiplying Charge Coupled Device (camera)
FAAH Fatty acid amide hydrolase
GABA Gamma-Aminobutyric Acid
GPCR G-protein coupled receptor
HEK Human Embryonic Kidney (cell line)
IgG Immunoglobulin G
IQR Interquartile Range
JZL JZL184, an inhibitor for monoacylglycerol lipase
KO Knockout
LP Localization Point
LTD Long-Term Depression
4
LTP Long-Term Potentiation
MGL Monoacylglycerol Lipase
NAE N-acyl-ethanolamine
NAPE-PLD N-acyl-phosphatidylethanolamine-hydrolyzing phospholipase D
NLP Number of Localization Points
NMDA N-methyl-D-aspartate (type of glutamate receptor)
PALM Photoactivated Localization Microscopy
PB Phosphate Buffer
PF PF3845, an inhibitor of fatty acid amide hydrolase
PFA Paraformaldehyde
PLC Phospholipase C
PSD Postsynaptic density
PSF Point Spread Function
PtIN Perisomatically-targeting interneuron
PV Parvalbumin
RIM Regulating synaptic membrane exocytosis (protein)
ROI Region of Interest
SEM Standard error of the mean
SIM Structured Illumination Microscopy
SMLM Single Molecule Localization Microscopy
SNR Signal to Noise Ratio
SST Somatostatin
STED Stimulated Emission Depletion Microscopy
STORM Stochastic Optical Reconstruction Microscopy
TBS Tris-Buffered Saline
THC Δ9-tetrahydrocannabinol
TIRF Total Internal Reflection Fluorescence
VGCC Voltage Gated Calcium Channel
VIP Vasoactive Intestinal Polypeptide
WT Wild Type
5
1. Introduction
The precise control of the strength of synaptic connections between neurons is the basis of the ability of the nervous system to produce adaptive, behaviorally relevant output. One of the most widespread means for synaptic depression, the negative regulation of synaptic strength, is endocannabinoid signaling. The endocannabinoid system consists of retrograde lipid messengers, most importantly 2-arachydonoyl- glycerol (2-AG) or anandamide, their respective synthetic and degradative enzymes, and cannabinoid receptors (Castillo et al. 2012). Activation of the CB1 cannabinoid receptor leads to decreased neurotransmitter release due to the G-protein-mediated inhibition of voltage-gated Ca2+ channels and molecular constituents of the vesicle release machinery, and thus, CB1 activity is an important regulator of network activity (Katona and Freund 2008). The endocannabinoid system regulates synaptic strength in a multitude of regions and cell types of the central nervous system (CNS) (Katona and Freund 2012), and its impaired function has been implicated in numerous severe pathological states, including epilepsy, neurodegenerative disorders and Fragile X mental retardation (Busquets-Garcia et al. 2013; Di Marzo et al. 2015; Katona and Freund 2008; Pacher et al. 2006; Soltesz et al. 2015). In each of the implicated pathologies, different sites of the brain circuits are involved, and thus the exact role of endocannabinoid signaling is also varied. Our general aim is to elucidate the molecular composition of endocannabinoid signaling at specific synapse populations.
Understanding molecular differences between particular cell types is required for understanding physiological and pathophysiological processes, but, in the immensely complex brain circuit, this has been an unresolved challenge for neuroscience (Lichtman and Denk 2011; O'Rourke et al. 2012). Therefore, we aimed to develop a method based on Stochastic Optical Reconstruction Microscopy (STORM) to allow cell-specific nanoscale imaging. STORM is a single molecule localization super-resolution microscopy method, capable of multichannel, 3-dimensional imaging of immunostaining at 10 nm lateral resolution (Bates et al. 2007; Huang et al. 2008b; Rust et al. 2006). While STORM has been used successfully to map the distribution of synaptic proteins in brain sections (Dani et al. 2010), existing methods did not visualize the cellular and subcellular context of the molecular localization data, and thus, did not
6
facilitate the cell type-specific analysis of such images. We have applied this method to resolve a paradox in endocannabinoid signaling at hippocampal GABAergic inhibitory synapses. Both perisomatically- and dendritically-targeting interneurons express presynaptic CB1, but, for hitherto unknown reasons, synapses of the former cell type are more sensitive to cannabinoids and exhibit tonic endocannabinoid signaling, while synapses of the latter are less sensitive and don’t express tonic signaling (Lee et al.
2010a; Lenkey et al. 2015).
In this chapter, I will introduce the molecular background of endocannabinoid signaling, the anatomical organization of the hippocampus and the CA1 region, the specific features of cannabinoid receptor-expressing hippocampal interneurons, and the recent advances in super-resolution microscopy methods.
1.1. Endocannabinoid signaling
1.1.1. Discovery of the endocannabinoid system
The Cannabis sativa plant has been used for medicinal and recreational purposes since ancient times. Its major psychoactive constituent, Δ9-tetrahydrocannabinol (THC), was identified as early as the 1960s, however, the mode of action of this substance has remained elusive (Gaoni and Mechoulam 1964; Mechoulam et al. 1970). The discovery of the brain’s endogenous cannabinoid system began with the identification of the molecular target of THC, CB1, a G-protein coupled receptor (GPCR) of the rhodopsin family, which was found to be expressed throughout the brain at high levels (Devane et al. 1988; Herkenham et al. 1991; Herkenham et al. 1990; Matsuda et al. 1990). Soon after, endogenous ligands of CB1 were also discovered, and, unlike most signaling molecules, endocannabinoids proved to be lipids (Devane et al. 1992; Mechoulam et al.
1995; Sugiura et al. 1995). The identification of endocannabinoids as retrograde messengers inhibiting neurotransmitter release at synapses was regarded as one of the most important discoveries in synapse research, and led to the birth of an exciting field of study (Ohno-Shosaku et al. 2001; Sudhof and Malenka 2008; Wilson and Nicoll 2001). Since then, various roles of the endocannabinoid system in the function of the central nervous system (CNS) have been uncovered, and it became evident that impairment of endocannabinoid signaling is involved in a plethora of brain disorders (Castillo et al. 2012; Katona and Freund 2012; Pacher et al. 2006). In the following
7
sections, I will briefly overview the molecular components of endocannabinoid signaling, and their role in controlling synapses.
1.1.2. Enzymatic pathways of the endocannabinoid system
The first endocannabinoid to be isolated from brain was N- arachidonoylethanolamine, also known as anandamide (Devane et al. 1992).
Anandamide levels in the brain are two orders of magnitude lower than the concentration of 2-arachidonoylglycerol (2-AG), the second endocannabinoid discovered three years later (Sugiura et al. 1995). Anandamide and 2-AG share structural similarities, but also express fundamental differences. While both molecules contain arachidonic acid as their polyunsaturated fatty acid moiety, they have different efficacy on CB1 (anandamide and 2-AG being partial and full agonists on CB1, respectively), and their biosynthesis and degradation are regulated by distinct enzymatic pathways (Ahn et al. 2008). Blocking the biodegradation of both anandamide and 2-AG together mimics and occludes the physiological effect of THC, while blocking the degradation of only one mimics only some aspects of the response (Alger and Kim 2011).
Originally, cannabinoid receptors were considered as the endogenous molecular targets of anandamide, and the role of anandamide in certain forms of CB1-mediated synaptic plasticity remains established (Ade and Lovinger 2007; Azad et al. 2003; Kim and Alger 2010; Lovinger 2007). However, after the emergence of decisive evidence for the involvement of 2-AG in numerous endocannabinoid-mediated paradigms (Tanimura et al. 2010), reports concentrate on effects through vanilloid receptors, making anandamide primarily an endovanilloid, not and endocannabinoid (Chávez et al. 2010;
Grueter et al. 2010; Lee et al. 2015; van der Stelt et al. 2005). Anandamide is a member of the highly diverse family of N-acyl-ethanolamine molecules (NAEs) (Di Marzo et al.
1994; Schmid et al. 2002; Ueda et al. 2013). In the canonical pathway, these are synthesized by an N-acyl-phosphatidylethanolamine (NAPE)-hydrolyzing phospholipase D enzyme (NAPE-PLD) in a calcium-dependent manner, and degraded by fatty acid amide hydrolase (FAAH) (Cravatt et al. 2001; Cravatt et al. 1996;
Okamoto et al. 2004). Interestingly, in NAPE-PLD-deficient mice, anandamide levels remain largely unchanged, while the level of long chain unsaturated (oleoyl- and
8
palmitoyl-) NAEs is decreased (Leung et al. 2006; Okamoto et al. 2007). These findings highlight the presence of alternative enzymatic pathways for anandamide metabolism (Rahman et al. 2014). While biochemical evidence suggests multiple synthetic routes through glycerophospho- or phospho-NAPE intermediates catalyzed by α/β-hydrolase domain containing (ABHD)-4 and glycerophosphodiesterase-1, or NAPE-phospholipase C and phospholipase B, respectively, it is not clear how these pathways contribute to brain anandamide levels (Ahn et al. 2008).
In situ hybridization against NAPE-PLD mRNA, and immunostaining against the enzyme revealed that NAPE-PLD is expressed in various populations of glutamatergic cells throughout the forebrain, with high levels in mossy fibers of granule cells of the dentate gyrus (Egertova et al. 2008; Nyilas et al. 2008). High-resolution immunogold labeling revealed that the enzyme is localized to intracellular membrane structures, resembling the cisternae of the smooth endoplasmic reticulum (Nyilas et al. 2008;
Reguero et al. 2014). Presynaptic targeting of the enzyme can predict its role in anterograde signaling (Egertova et al. 2008), or in intracellular signaling within axons.
Unlike the elusive enzymatic pathways for anandamide synthesis, solid evidence supports that the major degradative enzyme of NAEs in the CNS is FAAH, as knockout (KO) mice exhibit a great increase in endogenous anandamide levels (Cravatt et al.
2001; Cravatt et al. 1996). Besides the degradation by FAAH, minor oxidative pathways catalyzed by cyclooxygenase (COX)-2, 15-lipoxygenase, and cytochrome p450 oxidases have also been described (Maccarrone et al. 2010). Oxidation of anandamide by COX-2 leads to the generation of prostamide E-2, a molecule with neuroprotective effects. FAAH was found to be expressed postsynaptically targeted to the endoplasmic reticulum, in weak association with the plasma membrane (Egertova et al. 2008; Gulyas et al. 2004). In FAAH KO mice, the proliferation of neural progenitors is increased, suggesting the role of anandamide in this process (Aguado et al. 2005).
The second major endocannabinoid, 2-AG, belongs to the family of monoacylglycerols. At least three distinct enzymes can produce 2-AG from its phosphatidylinositol bisphosphate precursor found in the lipophilic layer of the plasma membrane. The physiologically most relevant pathway is the two-step reaction catalyzed by phospholipase C (PLC) β and diacylglycerol lipase (DGL)-α, as indicated
9
by the abolishment of endocannabinoid-mediated synaptic plasticity in the brain of DGL-α KO mice (Bisogno et al. 2003; Gao et al. 2010; Jung et al. 2007; Tanimura et al.
2010). The synthesis of 2-AG is promoted by the activation of metabotropic (Gq/11- coupled) receptors and/or elevated intracellular calcium concentrations, leading to on- demand production of 2-AG from the precursor pool (Alger and Kim 2011; Jung et al.
2005). The receptors and enzymes required for 2-AG synthesis are precisely targeted to the perisynaptic nanodomain of synapses (termed the “perisynaptic machinery”), further indicating the direct connection between the site of production and site of effect (Katona and Freund 2008; Katona et al. 2006). However, this configuration does not explain every observation. It cannot be ruled out that multiple pools of 2-AG, or separate functional sites of DGL-α activity exist, due to some experiments showing different effects between chronic (genetic) or acute (pharmacological) blockade of synthesis, and between 2-AG release triggered by calcium or by metabotropic receptor activation (Edwards et al. 2006; Hashimotodani et al. 2005; Lerner and Kreitzer 2012; Zhang et al.
2011). Moreover, it was shown that the same synapse can release either 2-AG or anandamide contingent on the mode of metabotropic receptor activation or on stimulus protocol (Puente et al. 2011; Ramikie et al. 2014).
Alternative enzymatic pathways of 2-AG biosynthesis include DGLβ, which was shown to be important during development and immune response, but its physiological role in 2-AG production in the adult brain is not clear (Hsu et al. 2012; Williams et al.
2003). Lastly, 2-AG can be synthesized via phospholipase A and lyso-PLC enzymes, but the contribution of this pathway to brain 2-AG levels is not known (Ueda et al.
2013).
The degradation of 2-AG can occur via hydrolysis or oxygenation. Hydrolysis of 2-AG can be catalyzed by multiple enzymes, with monoacylglycerol lipase (MGL) being the most important regulator of brain 2-AG levels (Dinh et al. 2002; Taschler et al. 2011). The same reaction can also be catalyzed by ABHD6, ABHD12 and FAAH (Ahn et al. 2008). MGL was found to be expressed presynaptically, strategically positioned to terminate 2-AG signaling on CB1 receptors, thus, MGL activity limits the duration of endocannabinoid signaling (Gulyas et al. 2004; Pan et al. 2011;
Uchigashima et al. 2011). The oxidation of 2-AG, mediated by COX-2, leads to the
10
production of prostaglandin E2 glycerol ester, a substance which has complementary effect on synaptic transmission compared to 2-AG. Thus, this pathway constitutes a molecular switch on the influence of endocannabinoid signaling on network activity (Katona and Freund 2012).
How lipophilic endocannabinoids can serve as messengers in the aqueous intracellular environment is a fundamental question of the field, however, lies outside the scope of this introduction. According to the general, albeit challenged view, endocannabinoids are not stored, but synthesized on demand, and degraded constitutively (Alger and Kim 2011; Min et al. 2010). Some interesting results suggest that, for anandamide at least, membrane channels and shuttle proteins regulate transport (Nicolussi and Gertsch 2015).
1.1.3. Cannabinoid receptors
The first studies identifying the receptor of psychoactive phytocannabinoids pinned down CB1 and CB2, G-protein coupled receptors of the rhodopsin family (Howlett et al.
1990; Matsuda et al. 1990; Munro et al. 1993). In the next decades, several receptors from all of the branches of the family were shown to be activated by phyto-, synthetic, and endocannabinoids (Brown 2007). However, the major behavioral effects of cannabinoids, also called the tetrad assay (hypolocomotion, hypothermia, analgesia, catalepsy), as well as the regulation of synapses by endocannabinoids are mediated by CB1 (Kawamura et al. 2006; Wilson et al. 2001; Zimmer et al. 1999). Being one of the most abundant GPCRs in the brain, CB1 is present in diverse cell- and synapse populations, and its multiple roles in the development and function of the CNS has been reviewed extensively (Alger 2012; Busquets-Garcia et al. 2015; Kano et al. 2009;
Katona and Freund 2012). The involvement of CB1 has been discovered in a number of disease conditions, such as epilepsy, addiction, mental- and neurodegenerative disorders (Di Marzo et al. 2015; Fattore 2015; Parsons and Hurd 2015; Soltesz et al. 2015; Volk and Lewis 2015). Presynaptic CB1 receptors were first described on the axon terminals of specific hippocampal interneurons, but CB1 expression is abundant throughout the brain, and presynaptic receptors are present on a number of cell types (Herkenham et al.
1990; Katona et al. 2001; Katona et al. 1999; Katona et al. 2006; Kawamura et al. 2006;
11
Uchigashima et al. 2007). While the number of receptors on an axon terminal ranges from barely detectable to several hundred between different synapse populations, CB1- mediated synaptic plasticity is a robust physiological phenomenon throughout the brain (Heifets and Castillo 2009; Katona et al. 2006; Nyiri et al. 2005). What factors regulate the levels of presynaptic CB1 receptors? How is the subcellular distribution of the receptor shaped, and how the abundance and positioning of receptors determine endocannabinoid-mediated signaling? Despite some emerging results, these questions remained largely elusive.
While a low level of receptors is detectable in the somatodendritic compartment of neurons, and there are functional implications for the role of somatodendritic receptors, the axonal enrichment of CB1 is striking, especially in neurons expressing the receptor at high levels (Bacci et al. 2004; Bodor et al. 2005; Katona et al. 1999; Maroso et al.
2016). What mechanisms ensure the accumulation of CB1 in axons and axon terminals?
Synaptic proteins are often anchored to or trapped at nanodomains by specific scaffolding proteins in a highly organized manner (Choquet and Triller 2013; Südhof 2012; Tang et al. 2016). Although a cannabinoid receptor interacting protein (CRIP 1a) has been described, neither this, nor other binding partners of CB1 were found to be required for axonal targeting of the receptor, or for phasic endocannabinoid signaling (Howlett et al. 2010; Niehaus et al. 2007; Smith et al. 2015). On the other hand, agonist- induced and constitutive internalization of the receptors emerged as major factors regulating CB1 surface expression and distribution. Agonist application leads to rapid internalization of CB1, followed by recycling (Coutts et al. 2001; Hsieh et al. 1999).
However, the affinity of CB1 for endocytosis appears to be different in the somatodendritic and axonal compartments, with augmented constitutive endocytosis in the somatodendritic membrane (Leterrier et al. 2006; McDonald et al. 2007).
Interestingly, when CB1 was overexpressed in cultured neurons, the striking axonal targeting was preserved irrespectively of the type of the transfected neuron, suggesting the autonomous preferential trafficking of the receptor without the presence of cell type- specific auxiliary molecules. In axon terminals, CB1 diffusion is somewhat confined to the area of the bouton, as opposed to the free diffusion in connecting axonal segments (Mikasova et al. 2008). Brief treatment with CB1 agonist resulted in desensitization of the receptors, coupled with exclusion from synaptic domains and decreased mobility,
12
which suggests the existence of some synapse- or axon terminal-specific interactions. In contrast, long-term exposure to agonists lead to loss of surface receptors in axons, accumulation of intracellular labeling, and transport to the cell body for degradation (Coutts et al. 2001; Thibault et al. 2013). Endocytosis is likely to happen in the boutons and not in the preterminal axonal segments, as also suggested by the higher relative density of receptors in the latter (Leterrier et al. 2006; Nyiri et al. 2005). Altogether, these observations suggest that CB1 can diffuse freely in presynaptic membranes, but can probably interact with axon terminal-specific proteins.
An interesting property of CB1 is its tonic activity. The application of antagonists/inverse agonists of CB1 increases the release probability above baseline levels, uncovering presynaptic tonic endocannabinoid signaling (Losonczy et al. 2004;
Neu et al. 2007). The existence of the CB1 tone has been partially attributed to ambient levels of endocannabinoids (Katona and Freund 2012), and recent discoveries have shown that the molecular background of tonic and phasic endocannabinoid signaling is different (Földy et al. 2013; Lee et al. 2015). In particular, transsynaptic complexes formed by presynaptic neurexin and postsynaptic neuroligin have been shown to specifically modulate tonic endocannabinoid signaling (Anderson et al. 2015; Földy et al. 2013). In neuroligin-3 KO mice, synaptic transmission is enhanced by abolished tonic, but not phasic endocannabinoid signaling (Földy et al. 2013).
Apart from their function in regulating neuronal activity, the role of CB1 and endocannabinoid signaling in the development of the CNS is also pivotal, regulating the proliferation, differentiation, migration and axonal growth of neurons. But these aspects are outside the scope of this chapter, and are reviewed in abundance (Gaffuri et al.
2012; Harkany et al. 2007; Harkany et al. 2008).
Among non-CB1 cannabinoid receptors, CB2 has been studied the most extensively.
CB2 is present on peripheral immune cells, and microglia and oligodendrocytes in the brain, and the therapeutic immune properties of cannabis are mediated through this close evolutionary relative of CB1 (Dhopeshwarkar and Mackie 2014). Recently, convincing evidences for its neuronal expression and function have emerged (Li and Kim 2016; Stempel et al. 2016). Long-chain NAEs are known to be the endogenous ligands of peroxisome proliferator-activated nuclear receptors (PPAR-α), which are able
13
to regulate the excitability of neurons, and are co-expressed with NAPE-PLD in hippocampal neurons (Fu et al. 2003; Melis et al. 2008; Rivera et al. 2014). However, lipid messengers liberated in axon terminals are highly unlikely to reach nuclear receptors. Recently deorphanized GPCRs, GPR55 and GPR119 are also activated by NAEs, and GPR18 binds N-arachydonoylglycine, but, to date, very little is known about their physiological role (Godlewski et al. 2009). Endocannabinoids were shown to act on a number of targets in the brain, such as NMDA and glycine receptors, various transient receptor potential channels, T-type calcium and two-pore-domain potassium channels, but it is not known if these interactions in fact occur during physiological processes (Katona and Freund 2012).
1.1.4. Endocannabinoid-mediated synaptic plasticity
Retrograde endocannabinoid signaling acting on presynaptic CB1 regulates neurotransmitter release in the majority of CNS synapses. In line with its widespread expression in various cell types, the downstream effectors of CB1 signaling exhibit fundamental variability. The first example of such regulation was the discovery of depolarization-induced suppression of inhibition (DSI), a decrease in the strength of GABAergic inhibitory synapses after second-long depolarization of pyramidal cells (Pitler and Alger 1992). The link between DSI and endocannabinoids was revealed a decade later, with the demonstration of presynaptic CB1 inhibiting voltage-gated calcium channels (VGCC) (Wilson et al. 2001; Wilson and Nicoll 2001). This inhibition occurs directly, via the βγ subunit of G proteins, and results in short-term synaptic plasticity not only in inhibitory synapses, but also excitatory synapses of the cortex and other brain areas (Castillo et al. 2012). Long-term effects of CB1 are based on separate mechanisms, mostly the inhibition of the vesicle release machinery (Rab3B and RIM1α) via the α subunit of Gi/o proteins. This signaling is indirect, and involves the downregulation of adenylate cyclase and protein kinase A (Chevaleyre et al. 2007).
Coincidently with CB1 activation, presynaptic calcium influx and calcineurin activity are also necessary for the induction of long-term plasticity (Heifets et al. 2008).
Importantly, blocking this second limb prevents LTD but leaves DSI intact, thus, molecular mechanisms of short- and long-term depression by CB1 are indeed different.
At cerebellar synapses, the downstream effect of CB1 also involves the activation of G
14
protein-gated inwardly rectifying and other potassium channels, thus regulating the excitability of the presynaptic membrane (Daniel et al. 2004).
Endocannabinoid-mediated long-term depression (LTD) of excitatory or inhibitory (i-LTD) synapses can be induced with multiple protocols, including low-frequency stimulation of inputs, pharmacological activation of postsynaptic metabotropic receptors, or paired pre- and postsynaptic discharges (spike timing-dependent plasticity) with specific delays (Castillo et al. 2012). A recent study suggested that the direction of spike timing-dependent endocannabinoid-mediated depression or potentiation depends on the temporal dynamics of CB1 activity (Cui et al. 2016). Endocannabinoid signaling does not always happen in a retrograde, homosynaptic manner. First, it is also an important player in neuron-glia interactions. In astrocytes, CB1-induced glutamate release occurs via Gq/11 mediated signaling and rise in astrocytic calcium concentrations (Min and Nevian 2012). The resulting increase in extrasynaptic glutamate concentration could induce LTD by activating presynaptic NMDA and metabotropic glutamate receptors. Second, in inhibitory synapses, 2-AG liberated by a neighboring glutamatergic synapse can induce heterosynaptic i-LTD (Chevaleyre and Castillo 2003).
Finally, postsynaptic CB1 or CB2 can influence the somatodendritic excitability of neurons (Bacci et al. 2004; Maroso et al. 2016; Stempel et al. 2016).
The role of endocannabinoid signaling has also been implied in metaplasticity (i.e.
the plasticity of plasticity), and homeostatic plasticity. Metaplasticity has been described both as a potentiation of the magnitude of DSI after repetitive stimulation of Schaffer collaterals, or as an increased likelihood of LTP in the glutamatergic input synapses of a cell that undergone i-LTD at the GABAergic synapses (Chen et al. 2007; Chevaleyre and Castillo 2004; Edwards et al. 2008). The homeostatic regulation of GABAergic synaptic strength has been shown to occur via tonic endocannabinoid signaling mediated by ambient levels of anandamide (Kim and Alger 2010).
While KO mice lacking CB1, DGL-α or MGL are viable, fine-tuning of synaptic strengths by endocannabinoids is important in several aspects. To conclude this chapter, I would like to highlight a few physiological and pathophysiological examples for the role of endocannabinoid signaling in brain function (Heifets and Castillo 2009). During sensory map formation, competition between inputs on neocortical principal cells
15
involves endocannabinoid-mediated LTD of the weakening inputs. Thus, CB1 is required for both the reorganization following sensory deprivation, and for normal developmental map formation (Crozier et al. 2007; Deshmukh et al. 2007). The role of CB1 in associative learning is underlined by the necessity of endocannabinoid signaling for the extinction of conditioned fear, which requires LTD in amygdala synapses, and the facilitation of fear extinction when endocannabinoid signaling is enhanced (Chhatwal et al. 2005; Lutz et al. 2015; Marsicano et al. 2002). In Parkinson’s disease, reduced endocannabinoid production in the striatal medium spiny neurons of the indirect pathway contributes to increased corticostriatral excitability, and thus is an important aspect of the pathomechanism and also a therapeutic target (Kreitzer and Malenka 2007; More and Choi 2015). Endocannabinoid control of glutamatergic and GABAergic synapses is crucial for the balance of excitation and inhibition, and therefore in the pathogenesis of epilepsy (Soltesz et al. 2015). Accordingly, downregulation of CB1 was described on excitatory, but not inhibitory synapses of human epileptic patients, and impaired endocannabinoid signaling in the lack of DGL-α leads to increased epileptogenesis in mice (Ludanyi et al. 2008; Sugaya et al. 2016). In a mouse model of Fragile X mental retardation, synaptic endocannabinoid signaling is reduced concurrent with a mismatch in the precise synaptic targeting of DGL-α at glutamatergic synapses. The change in localization manifested in mere 50 nm difference in the distance of DGL-α from synapses between healthy and impaired animals (Jung et al. 2012).
Together, these examples show that endocannabinoid signaling regulates synaptic strength in a multitude of brain regions and cell types, with considerable variability in its molecular organization and function. Gaining insight into how the involved receptors and enzymes participate in signaling at specific synapse populations thus leads to deeper understanding of the healthy and diseased brain.
1.2. Organization of the hippocampal circuit
1.2.1. Anatomical organization of the hippocampal formation
The hippocampal formation is a group of brain areas of archicortical developmental origin, formed in the medial wall of the telencephalic ventricle. It is part of the limbic system, and receives highly processed multimodal sensory input from a multitude of
16
brain regions, cortical and subcortical alike. It plays especially critical role in long-term memory storage and recall, as exemplified by the famous case of the patient H.M., who has developed severe memory impairment after surgical removal of the hippocampi (Squire 2009). Because the rodent hippocampus is one of the most widespread model systems of neuroscience, extensive literature is available to review its anatomy (Andersen 2007; van Strien et al. 2009). What differentiates the hippocampal formation from all other cortical brain areas is its unique organization of associational connections, resulting, in a simplified view, in unidirectional flow of information along its subregions, namely the dentate gyrus, the sensu stricto hippocampus, the subiculum, the pre- and parasubiculum and the entorhinal cortex. The hippocampus comprises three well-defined anatomical regions, the CA1, CA2 and CA3. While the name hippocampus, originating from the sea horse-like shape of this structure in the human brain, is commonly used to refer to the three regions together (and often including the dentate gyrus), the regions themselves are usually abbreviated CA, after Cornu ammonis, another historical name of the same formation. In rodents, the relative size of the hippocampus (especially the dorsal hippocampus) compared to the neocortex is especially large, due to its prominent role in spatial memory and navigation.
Canonically, information flow through the hippocampus has been described as the trisynaptic circuit, in which superficial pyramidal cells of the entorhinal cortex innervate dentate granule cells through the perforant path, granule cells in turn innervate CA3 pyramidal cells via the mossy fibers, those then project to CA1 pyramidal cells through the Schaffer collaterals, and finally CA1 pyramidal cells project to the subiculum and back to the entorhinal cortex. The organization of principal cell somata in a single layer, and the strict laminar organization of inputs are also distinctive features of the hippocampus. Apart from the unidirectional trisynaptic pathway described above, the structure of the circuit is more complex, and regions of the hippocampal formation are extensively interconnected with other brain regions. First of all, the perforant path of entorhinal pyramidal cells projects directly to the CA1, also known as the temporoammonic pathway. The dentate granule cells massively innervate local interneurons, more so than CA3 pyramidal cells, and give rise to commissural afferents.
The network of CA3 is characterized by the dense recurrent interconnection of its pyramidal cells, and the Schaffer collaterals also give rise to contralateral projections.
17
The hippocampal formation receives important subcortical, mostly modulatory input from the septum, supramamillary nucleus, locus coeruleus, ventral tegmental area and raphe, and many of these connections is reciprocal. Apart from the entorhinal and subicular cortices, CA1 pyramidal cells also innervate the retrosplenial cortex, amygdala and septum. In this study, I focus on local interneurons of the CA1, therefore in the next section I provide a brief overview of the specificities of the CA1 network.
1.2.2. Structure and connectivity in the CA1
The principal cell type of the CA1 is the pyramidal cell, probably the most studied cell type in the brain. These neurons exhibit remarkably homogenous dendritic morphology, and in rodents are organized into a single lamina of up to five cell layers thickness. Although pyramidal cells of the CA1 were originally considered a homogenous population based on their morphological uniformity, recent evidence shows the existence of several distinct populations of pyramidal cells, segregated by sublaminar localization, connectivity, neurochemical features, and transcriptome (Cembrowski et al. 2016; Lee et al. 2014; Mizuseki et al. 2011; Zeisel et al. 2015). The deepest part of the CA1, which is actually situated dorsally, due to the “upside down”
position of CA1 in the brain, is the alveus, white matter containing myelinated fibers of the temporoammonic pathway. The first layer, oriens, contains basal dendrites of the pyramidal cells, and is innervated by Schaffer collaterals from the CA3. The pyramidal layer contains pyramidal cell somata, while cell bodies of interneurons can be found in every layer. The radiatum contains apical dendrites of pyramidal cells, also receiving innervation from Schaffer collaterals, and from commissural fibers of the CA3. Lastly, the most superficial lacunosum-moleculare layer, adjacent to the dentate gyrus, contains distal dendritic tufts of pyramidal cells, innervated by entorhinal afferents. The axons of CA1 pyramidal cells give local collaterals to innervate interneurons, but not other CA1 pyramidal cells, and leave the hippocampus through the alveus, projecting primarily to the subiculum.
One of the most exciting functional features of the hippocampus is its role in spatial representation. Pyramidal cells of the CA1 have unique spatial receptive fields, as, in contrast to sparse baseline firing activity, they discharge at high frequency in specific places of the environment (O'Keefe and Dostrovsky 1971). This “place cell” activity is
18
maintained even in the absence of Schaffer collateral input, by the perforant path alone.
These findings and others highlight the function of the hippocampus and the CA1 circuit as an integrator of complex, highly processed sensory representation, exhibiting both pattern completion and pattern separation, encoding the spatial, temporal, sequence, and contextual features of events (Moser et al. 2008). Inhibition plays a fundamentally important role in these functions, by balancing excitation, maintaining and modulating rhythmic activity, tuning the firing of pyramidal cells, and filtering dendritic integration. Understanding the diverse network role of IN subtypes in the hippocampal circuit is one of the long-standing and most exciting challenges of neuroscience (Freund and Buzsaki 1996; Roux and Buzsáki 2015; Somogyi and Klausberger 2005). In the next chapter, I will briefly introduce the diversity of inhibitory interneurons of the CA1.
1.2.3. Diversity of interneurons
What defines an interneuron subtype? GABAergic interneurons, while they are ten times less numerous compared to the relatively homogenous pyramidal cells, exhibit substantial variability. This variability constitutes in their different developmental origins, specific organization of input and output synapses, molecular expression patterns, intrinsic electrophysiological properties such as discharge modes, and their characteristic firing patterns in intact circuits in vivo (Klausberger and Somogyi 2008;
Markram et al. 2004). As none of these features define clear, uniform types of interneurons, classifications based on just one parameter often lead to contradictions.
Nevertheless, despite the presence of many axes in the multidimensional space of diversity, specific types of interneurons are defined, and the existence of disjunctive clusters of cells can be identified based on their transcriptome (Tasic et al. 2016; Telley et al. 2016; Zeisel et al. 2015). The most striking anatomical feature of interneurons is the specialized targeting of distinct subdomains of postsynaptic pyramidal cells. Based on preferential target profiles, there are perisomatic interneurons, targeting the somata and proximal dendrites of neurons, dendritic interneurons, synapsing on the basal and apical dendrites, tuft-targeting cells, which selectively innervate the most distal segments of the dendritic tree, and axo-axonic cells, which preferentially target the axon hillock and axon initial segment. It is important to note, however, that cells belonging to
19
the same morphological type can be very different in every other parameter (Freund and Katona 2007).
The neurochemical classification of interneurons is based on the combinatorial expression profile of calcium binding proteins and neuropeptides, which is strongly related to the developmental origin of the cell. Cortical interneurons, unlike pyramidal cells, are not generated in the ventricular zone of the given brain area, but are produced in the ganglionic eminences at the lateral ventricle of the ventral telencephalon (Butt et al. 2005; Wonders and Anderson 2006). Typically, interneurons derived from the medial ganglionic eminence express either parvalbumin (PV) or somatostatin (SST), while neurons from the central ganglionic eminence express reelin or vasoactive intestinal polypeptide (VIP). More recently, a three-way classification based on mutually exclusive expression of PV, SST or ionotropic serotonin receptor 3A has been suggested (Lee et al. 2010b; Rudy et al. 2011). In the hippocampus, a considerable fraction of interneurons is derived from the preoptic area of the hypothalamus. Again, it has to be stressed that interneurons expressing one of these markers can show significant heterogeneity in their other parameters (Klausberger and Somogyi 2008).
During electrophysiological recordings, the most straightforward identification of an interneuron is the response it displays upon current injections. The types of discharge patterns include fast spiking (non-accommodating), bursting, regular-spiking (accommodating), irregular spiking and stuttering. Relying solely on intrinsic properties to identify neurons, however, can be misleading, as multiple subtypes can display indistinguishable electrophysiological responses (Markram et al. 2004).
Finally, the timing of interneuron firing in relation to oscillatory network activity, and the recruitment of interneuron activity by feedforward or feedback circuits are critical parameters in understanding their function in vivo. Based on the above detailed parameters, Klausberger and Somogyi in their classical work have used an immense body of accumulated knowledge to outline 21 distinct classes of GABAergic interneurons in the CA1 region (Bezaire and Soltesz 2013; Klausberger and Somogyi 2008; Somogyi and Klausberger 2005). In this study, I will focus on specific types of these interneurons, the few classes that express CB1 cannabinoid receptors.
20
1.3. Subtypes and roles of CB1–expressing interneurons in the CA1 1.3.1. Distinctive features of CB1-expressing interneurons
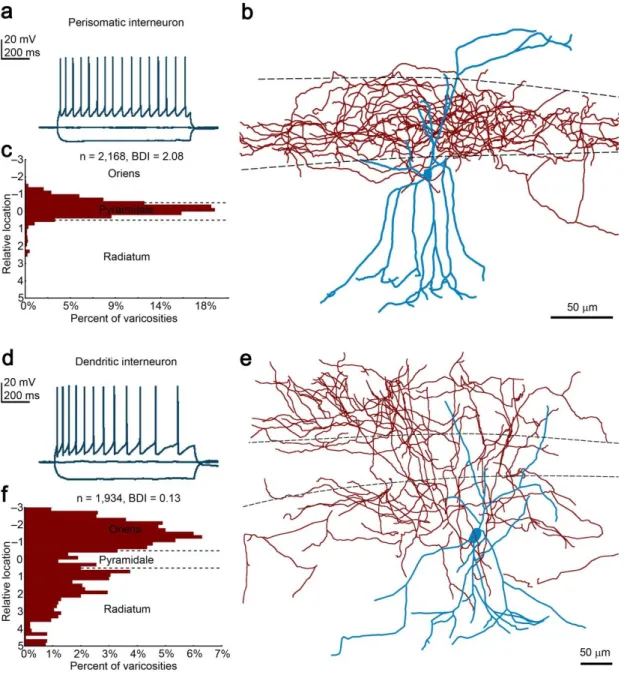
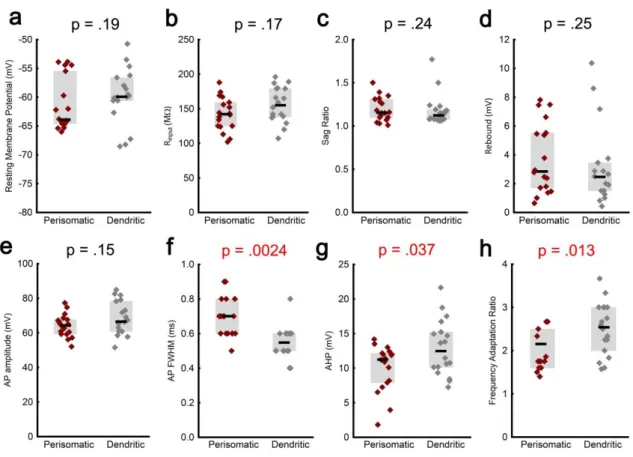
The first evidence for the presynaptic expression of CB1 on axon terminals came from interneurons of the CA1 region (Katona et al. 1999). These cells were containing the neuropeptide cholecystokinin (CCK), and were morphologically characterized as perisomatically targeting (also called basket cells, based on the basket-like appearance of their axon terminals enclosing pyramidal cell somata in the neocortex). Later studies identified more subtypes of CCK-positive interneurons, including VIP or vesicular glutamate transporter 3-positive cells and dendritically-targeting interneurons (Ali and Todorova 2010; Cope et al. 2002; Lee et al. 2010a; Somogyi et al. 2004). Thus, CB1- positive cells can be divided into three morphological categories: one perisomatically targeting type (basket cells), and two dendritically-targeting types, Schaffer collateral- associated and perforant path-associated cells. Each of these morphological types express regular spiking (accommodating) firing pattern, and are often reciprocally connected through both chemical and electrical synapses. Although all CCK-positive cells express CB1, and both markers can be used interchangeably for many purposes, it is noteworthy that not all CB1-positive cells express CCK, and single-cell transcriptomic studies identified multiple CB1-positive cell types (Bezaire and Soltesz 2013; Zeisel et al. 2015). Another feature of CCK/CB1 interneurons that separates them from other interneurons is their role in integration of the excitation from multiple afferents of the hippocampus. These cells receive specific input from modulatory brainstem nuclei, and express postsynaptic receptors for serotonin and acetylcholine, and presynaptically, on their axon terminals, estrogen and GABAB receptors (Freund and Katona 2007).
The inhibition delivered by CCK/CB1-positive cells is characterized by asynchronous GABA release. Presynaptically, they express N-type (Cav 2.2) calcium channels, which are loosely coupled to the vesicle release sites (Hefft and Jonas 2005).
The asynchronicity of release is further aggravated by activity of CB1 receptors (Ali and Todorova 2010).
21
1.3.2. Role of CB1–expressing interneurons in network function
Although CCK/CB1-expressing interneurons are not numerous in the CA1, they have a fundamental role in the regulation of pyramidal cell networks. During rhythmic network activity, these cells discharge at the phase of theta oscillation when place cells (pyramidal cells within their place field) fire (Klausberger et al. 2005). This pattern, together with the plasticity endowed by CB1 expression led to the hypothesis that these cells are important in the generation of neuronal assemblies and promoting sparse coding, by effectively suppressing pyramidal cell populations, while place cells firing at higher rate can lift the inhibition from CB1-positive interneurons via endocannabinoid signaling (Freund and Katona 2007).
Recent studies revealed that CCK/CB1-positive interneurons are also important in regulating dendritic integration and synaptic plasticity, as well as gating excitation in pyramidal cells. Surprisingly, CCK/CB1 cells provide by far the strongest feedforward inhibition recruited by Schaffer collateral activity, the downregulation of which is a major component of the potentiation of entorhino-hippocampal (perforant path) synapses (Basu et al. 2013). Moreover, long-range inhibitory projections from the entorhinal cortex selectively inhibit CCK/CB1 interneurons, which underlies the gating of entorhino-hippocampal information flow (Basu et al. 2016).
1.4. Super-resolution microscopy methods
1.4.1. Principle of super-resolution microscopy
Fluorescence microscopy is one of the most widely applied methods in life sciences, due to the relative ease of use, versatile labeling modes, and potential for real- time dynamic observations. The resolution of any far-field microscope is limited by the diffraction of the rays used for imaging, photons in the case of light microscopy. This diffraction limit, often called Abbe’s law, comes from the fact that imaging is the reverse of projection, and just as light cannot be focused to an infinitely small spot, the image of a very small light source can also not be infinitely small. Thus, if the size of the light source is below half the wavelength of the light, the resulting image does not depend on the size or shape of the light source, but only on some parameters of imaging, namely the wavelength of light, the refractive index of the imaging medium, and the numerical aperture of the objective. This image, called the Airy-disc, or point spread
22
function (PSF), is a Gaussian spot surrounded by a series of ever fading rings. As a result, light sources that are close together, cannot be separated based on their image. In other terms, the PSF is the highest spatial frequency the microscope can transmit. Due to physical limitations, glass objectives cannot resolve two neighboring point-like emitters if they are separated by less than 200 nm (Requejo-Isidro 2013; Tønnesen and Nägerl 2013). This distance is an order of magnitude larger than macromolecules, and in the size range of synapses and dendritic spines, thus, for biological applications of light microscopy, the diffraction limit was indeed a limitation, already in the time of Cajal. Electron microscopy, by using electrons instead of photons and electromagnetic lenses instead of glass, can achieve extremely high resolutions, exceeding the requirements of biological applications; however, it has its own limitations. Pre- embedding immunogold electron microscopy is able to reveal endogenous protein distribution with sufficient resolution, but it suffers from low sensitivity, and from the possibility of artefacts due to the required strong aldehyde fixation and resin embedding. High pressure freezing and replica labeling has the ability to reveal distribution with superior sensitivity and resolution, but it is limited to proteins located in randomly fractured membrane areas instead of complete anatomical profiles (Tanaka et al. 2005). Importantly, none of these methods can be applied on live, dynamic samples.
In the past decades, while the theory of the diffraction limit remained valid, multiple innovative approaches, collectively termed super-resolution microscopy, enabled fluorescence imaging with up to nanometer-scale resolution (Godin et al. 2014;
Maglione and Sigrist 2013; Oddone et al. 2014; Yamanaka et al. 2014). The numerous published methods are all using one of the following three independent approaches to break the diffraction limit. The first group of methods is based on reversible saturable optical fluorescence transition, and, similarly to a confocal microscope, is using laser scanning. The most widespread variant, stimulated emission depletion microscopy (STED), works by pairing the excitation beam with a doughnut-shaped depletion beam with a non-diffraction-limited zero intensity spot at the center, to prohibit fluorescence emission from the periphery of the excitation beam, and thus, to engineer the effective excitation PSF to be smaller than dictated by diffraction (Hell and Wichmann 1994).
This does not improve the imaged PSF, however, as the microscope is performing raster
23
scanning of one pixel at a time, it is known that the detected fluorescence is always originating from the zero intensity spot of the STED beam. The confinement of this spot is determined by laser power, thus, in biological applications, the resolution is in the range of 25-50 nm (Tam and Merino 2015). The second group of methods is called structural illumination microscopy (SIM). In this method, multiple widefield images are acquired on a camera from the same field of view, each illuminated with a different pattern. The interference fringes (Moiré pattern) in the resulting images carry high- frequency spatial information of the sample in one direction in a lower frequency, which can be resolved by the microscope. An image with increased resolution thus can be calculated from all the images taken with different directions of the illumination pattern (Gustafsson 2000). The theoretical limit of resolution improvement using SIM is twofold, practically 120 nm.
The third group of methods, single molecule localization microscopy (SMLM), is based on the temporally separated detection of light from individual emitters, and includes photoactivation localization microscopy (PALM) and stochastic optical reconstruction microscopy (STORM) (Betzig et al. 2006; Hess et al. 2006; Rust et al.
2006). These are based on the switching between non-fluorescent and fluorescent states of individual molecules, fluorescent proteins and organic dyes, respectively (Allen et al.
2013). In the present study, we have been utilizing STORM, thus, I will focus on this method in details. The limit that diffraction poses on resolution applies to the case of simultaneous imaging of multiple fluorescence emitters with spatially overlapping PSFs. The position of a single emitter, or several emitters present in a sufficiently low density, however, can be determined with great accuracy, by calculating the centroid of the PSFs. This method has been in use for single particle tracing since the 1980s (Gelles et al. 1988; Oddone et al. 2014). To exploit the precision of single molecule localization in densely labeled samples, it is necessary to control the fluorescence of emitters to maintain simultaneous emission from multiple sources at a very low density. Upon continuous illumination of the entire field of view with sufficiently high light intensity, the photoswitchable fluorophores emit photons, and, after a short time, enter a non- fluorescent state. This transformation is reversible, in contrast to photobleaching which involves irreversible oxidation of the fluorophore. After sending the fluorophores within the field of view to dark state, the stochastic return to excitable state results in the sparse
24
blinking of individual fluorophores, which can be recorded on a fast camera to calculate the position of each event and reconstruct the spatial distribution of the signal (Rust et al. 2006).
Although the principle of STORM does not require any special modification to the microscope or treatment of the sample to work, several improvements were necessary to make it practical for imaging biological samples. In recent applications, both the conversion of fluorophores to dark state and the return to excitable state are controlled to achieve optimal conditions. First of all, a more stable dark state is obtained by the covalent binding of a thiol group from chemicals of the special imaging medium, and irreversible photobleaching is avoided by the constant enzymatic scavenging of reactive oxygen species (Dani et al. 2010; Dempsey et al. 2009; Rust et al. 2006). Activation of fluorophores, i.e. increasing the probability to return to excitable state, is necessary to build adequate reconstruction of the sample within practically manageable time. For optimal results, oblique illumination with a laser TIRF illuminator, a sensitive electron multiplying EMCCD or scientific complementary metal–oxide–semiconductor camera, and a high numerical aperture TIRF objective has been used (Barna et al. 2016; Dani et al. 2010).
The method for activation differentiates two approaches. The original reports of STORM used activator-reporter dye pairs, that is, labeled the probes with two different dyes, one used for imaging (reporter), and one not excited during acquisition, but periodically illuminated with low-intensity light (activator). The spatial proximity of the two dyes results in the probabilistic return of the reporter to excitable state after the activator is illuminated, through a mechanism which is to date not understood. In this configuration, acquisition is performed through cycles of one activation and multiple imaging frames (Rust et al. 2006). In the second approach, known as direct STORM or dSTORM, a single dye species is activated directly, without the involvement of a dye, with higher energy (405nm) photons (Heilemann et al. 2008; van de Linde et al. 2011).
25
1.4.2. Multi-channel and three-dimensional STORM imaging
One of the most attractive features of fluorescence microscopy is the ease of multiplexing different labels by exploiting the specific excitation and emission wavelengths of different dyes. It is possible to perform simultaneous or sequential multi-channel imaging also with STORM using three different approaches. Firstly, when using activator-reporter dye pairs, multiple probes can be labeled with the same reporter, but different activator dyes to selectively activate each subset of probes (Bates et al. 2012; Bates et al. 2007; Shroff et al. 2008). Thus, by alternating the wavelength used for activation, blinking events detected immediately after activation can be assigned to the respective channel. The advantages of this method are that it allows simultaneous detection of multiple channels, and that it doesn’t suffer from chromatic aberration. The drawback is that channel assignment is probabilistic, and thus crosstalk between channels is inevitable (Dani et al. 2010). The second approach relies on the separation of emission from different reporter dyes using optical filters, which is becoming more available as an increasing number of fluorophores are being tested for SMLM (Dempsey et al. 2011; Lehmann et al. 2015a; Lehmann et al. 2015b). This method rules out crosstalk, but doesn’t allow simultaneous acquisition of channels, and introduces chromatic aberration. Finally, multi-channel imaging with spectral unmixing of different reporters allows simultaneous detection and prevents crosstalk, however, it requires splitting the emitted light and thus reduces intensity (Bates et al. 2012; Lampe et al. 2012; Zhang et al. 2015).
Thus far, I’ve focused on the two-dimensional resolution of microscopic images, and methods improving lateral resolution. However, the diffraction limit also applies for axial resolution, which is, in widefield microscopy, very poor. Confocal microscopy can significantly improve this by rejecting off-focus light using a pinhole in the back focal plane of the objective, but the achieved resolution is still low (>500 nm). Each of the aforementioned three domains of super-resolution microscopy have developed means to achieve super-resolution in the axial dimension too. In STORM, this is achieved exploiting astigmatism (Huang et al. 2008b). By placing a cylindrical lens in the light path at the camera port of the microscope, the image of the emitter is not affected if the emitter is located exactly at the focal plane of the objective. However, if the emitter is out of focus, the image is elongated horizontally or vertically depending on the axial
26
position in relation to the focal plane. After calibration with sub-resolution emitters immobilized in a monolayer on the coverslip surface, the axial position of each blinking event can be determined from the parameters of an ellipse fitted on the distorted image of the emitter. Using this method, 3D-STORM images with an axial resolution of 40 nm can be recorded from a thin volume while improvements of the method offer the imaging of larger volumes (Huang et al. 2008a; Lakadamyali et al. 2012; Min et al.
2014).
1.4.3. Determining the resolution, and visualizing STORM data
The resolution of an SMLM image is determined by two key factors: the density of detected molecules and the localization precision (Oddone et al. 2014). The precision of determining the position of a single-molecule image is not limited by the PSF of the microscope or by the pixel size of the camera. While both of these factors need to be taken into account, the accuracy of the fitting mainly depends on the number of photons detected from a blinking event. This measure of resolution, called localization precision, can be calculated analytically, but can also be determined experimentally by measuring the standard deviation of the centroids of multiple localizations of the same fluorophore.
According to the Nyquist criterion of sampling, structural features smaller than the double of the distance of the nearest fluorophores cannot be resolved. Consequently, the density of detected fluorophores also contributes to the resolution of the reconstructed image. Mathematical means of providing exact numerical measures of resolution are available in the literature (Dempsey et al. 2011; Nieuwenhuizen et al. 2013; Thompson et al. 2002).
Finally, it is important to note that SMLM does not produce an image of the sample, but rather a list of coordinates of individual localization points. Therefore, the visualization of the microscopy data requires some form of rendering. The earliest publications simply used scatterplots of positions, which are accurate, but do not facilitate the intuitive interpretation of images (Rust et al. 2006). It is common in the literature to generate pixelated images where the greyscale intensity reflects the number of molecules per pixel, this method, however, sacrifices resolution at well-sampled, and introduces erroneous details in undersampled regions of the image (Baddeley et al.
2010). The molecule list can also be represented with Gaussian spots at the position of
27
each localization point, with the spread of the spot representing the localization precision of the given point. Such images represent the information content of the molecule list more faithfully, and allow the rendering of the STORM image at arbitrary zoom level (Dani et al. 2010).
28
2. Objectives
How the molecular composition of specific neurons underlies their circuit function is a fundamental question of neuroscience. However, the required integrated analysis of electrophysiological, structural and nanoscale molecular features of individual cells has been technically challenging. The CB1 cannabinoid receptor is a major regulator of synaptic strength throughout the CNS, but the determinants of the cell type-specific variability in endocannabinoid signaling are poorly understood. Therefore in this study our specific aims are:
1) To develop a method for cell-specific molecular imaging
Evaluate whether STORM super-resolution imaging can be used for quantitative purposes
Optimize STORM for imaging CB1 distribution in brain tissue
Optimize the correlated acquisition and analysis of confocal and STORM images of individually labeled neurons
2) To determine cell type-specific alterations in the molecular organization of synaptic endocannabinoid signaling
Compare the abundance and distribution of CB1 between perisomatically- and dendritically-targeting interneurons
Compare the nanoscale organization of synaptic active zones between perisomatically- and dendritically-targeting interneurons
3) To investigate the dynamic rearrangement of CB1 receptors in response to cannabinoid agonists
Determine the effect of acute elevation of endocannabinoid levels
Determine the effect of chronic THC treatment
Determine molecular basis of the dose-dependence and recovery of cannabinoid tolerance