Cell type-specific molecular anatomy of the endocannabinoid system at cortical synapses
Ph.D. thesis
Barna Dudok
Semmelweis University
János Szentágothai Doctoral School of Neurosciences
Supervisor: István Katona, DSc., scientific advisor Official Reviewers of the Ph.D. Dissertation:
Zoltán Kisvárday, DSc., associate professor Zita Puskár, PhD., senior research fellow
President of the Final Examination Board:
János Réthelyi, PhD., associate professor Members of the Final Examination Board:
Alán Alpár, PhD., associate professor Ágnes Kittel,DSc., scientific advisor
Budapest
2016
1
1. Introduction
The precise control of the strength of synaptic connections between neurons is the basis of the ability of the nervous system to produce adaptive, behaviorally relevant output.
One of the most widespread means for synaptic depression, the negative regulation of synaptic strength, is endocannabinoid signaling. The endocannabinoid system consists of retrograde lipid messengers, most importantly 2-arachydonoyl-glycerol (2-AG) or anandamide, their respective synthetic and degradative enzymes, and cannabinoid receptors.
Activation of the CB1 cannabinoid receptor leads to decreased neurotransmitter release due to the G-protein-mediated inhibition of voltage-gated Ca2+ channels and molecular constituents of the vesicle release machinery, and thus, CB1 activity is an important regulator of network activity. Signaling by anandamide and 2-AG is terminated by their enzymatic degradation by fatty acid amide hydrolase (FAAH) and monoacylglyerol lipase (MGL), respectively. The endocannabinoid system regulates synaptic strength in a multitude of CNS regions and cell types, and its impaired function is involved in the pathogenesis of numerous severe disease states, including epilepsy, neurodegenerative disorders and Fragile X mental retardation. In each of the implicated pathologies, different sites of the brain circuits are involved, and thus the exact role of endocannabinoid signaling is also varied.
Our general aim is to elucidate the molecular composition of endocannabinoid signaling at specific synapse populations.
Understanding molecular differences between particular cell types is required for understanding physiological and pathophysiological processes, but, in the immensely complex brain circuit, this has been an unresolved challenge for neuroscience. Stochastic Optical Reconstruction Microscopy (STORM) is a single molecule localization super- resolution microscopy method, capable of multichannel, 3-dimensional imaging of immunostaining at 10 nm lateral resolution. While STORM has been used successfully to map the distribution of synaptic proteins in brain sections, existing methods did not visualize the cellular and subcellular context of the molecular localization data, and thus, did not facilitate the cell type-specific analysis of such images. Therefore, we aimed to develop a method based on STORM to allow cell-specific nanoscale imaging.
We have applied this method to resolve a paradox in endocannabinoid signaling at hippocampal GABAergic inhibitory synapses. The hippocampus is a brain region involved in spatial navigation and episodic memory. In the CA1 region of the hippocampus, pyramidal cells receive excitatory input from the CA3 as part of the canonical trisynaptic circuit through the Schaffer collaterals, and direct input from the entorhinal cortex through the perforant path. The integration of the activity of excitatory afferents, as well as the discharge of pyramidal cells is delicately regulated by a multitude of local interneuron classes. Inhibition delivered by multiple types of CB1-expressing interneurons plays a key role in controlling the associative plasticity of inputs on pyramidal cells, and gating information flow. Both perisomatically- and dendritically-targeting interneurons express presynaptic CB1, but, for hitherto unknown reasons, synapses of the former cell type are more sensitive to cannabinoids and exhibit tonic endocannabinoid signaling, while synapses of the latter are less sensitive and don’t express tonic signaling. Thus, we aimed to ascertain the molecular differences in endocannabinoid signaling between these two cell types.
The CB1 receptor has been discovered as the molecular target of the psychoactive compound of Cannabis sativa, Δ9-tetrahydrocannabinol (THC). Repeated cannabis use results in tolerance and impairment of memory and cognitive functions. In mouse models of THC tolerance, the cannabinoid control of GABA release is impaired; however, the
2
underlying molecular reorganization has not been investigated. Therefore, we aimed to study how the activation of CB1 by endogenous or exogenous agonists modifies the nanoscale distribution of CB1 on GABAergic axon terminals.
2. Objectives
How the molecular composition of specific neurons underlies their circuit function is a fundamental question of neuroscience. However, the required integrated analysis of electrophysiological, structural and nanoscale molecular features of individual cells has been technically challenging. The CB1 cannabinoid receptor is a major regulator of synaptic strength throughout the CNS, but the determinants of the cell type-specific variability in endocannabinoid signaling are poorly understood. Therefore in this study our specific aims are:
1) To develop a method for cell-specific molecular profiling
Validate the use of STORM super-resolution imaging for quantitative studies
Optimize STORM for imaging CB1 distribution in brain tissue
Optimize the correlated acquisition and analysis of confocal and STORM images of individually labeled neurons
2) To determine cell type-specific alterations in the molecular organization of synaptic endocannabinoid signaling
Compare the abundance and distribution of CB1 between perisomatically- and dendritically-targeting interneurons
Compare the nanoscale organization of synaptic active zones between perisomatically- and dendritically-targeting interneurons
3) To investigate the dynamic rearrangement of CB1 receptors in response to cannabinoid agonists
Determine the effect of acute elevation of endocannabinoid levels
Determine the effect of chronic THC treatment
Determine molecular basis of the dose-dependence and recovery of cannabinoid tolerance
3
3. Methods
3.1. Animals and cell culture
Adult male littermate CB1+/+ and CB1–/– (Gift of Andreas Zimmer) C57BL/6H mice were anesthetized, and perfused transcardially with 0.9% saline for 2 mins, followed by 4%
paraformaldehyde (PFA) in 0.1 M phosphate buffer (PB, pH = 7.4) for 20 mins. After post- fixing in 4% PFA for 2 hours, 50 µm thick coronal vibratome sections were collected, and washed extensively in PB. Acute hippocampal slice preparations were obtained from male C57BL/6N mice (postnatal day 25-40) under isoflurane anesthesia. For chronic drug treatment, male C57BL/6J mice (postnatal day 22–31) were injected twice daily intraperitoneally with vehicle (1% ethanol, 2% Tween 80 and saline) or THC for 6.5 days.
HEK293 cells were maintained under routine conditions. Cells were transfected with the construct coding N-terminally EGFP-tagged CB1 in poly-D-lysine coated glass-bottom petri dishes using Lipofectamine 2000. After incubation for 18 hours to allow the expression, cells were fixed in 4 % paraformaldehyde for 15 mins.
3.2. Patch-clamp recording
Electrophysiological recordings from pyramidal cells and interneurons were carried out at 33°C in oxygenated artificial cerebrospinal fluid, using micropipettes (3–4 MΩ) filled with internal solution containing 0.2% biocytin. Cells were recorded in whole-cell patch- clamp configuration. After recording, the sections were transferred into 4% PFA in, and fixed for 40 hours at 4°C.
3.3. Immunostaining
All tissue samples were stained free-floating, in 24-well tissue culture dishes. The following primary antibodies were used: bassoon (Mouse, 1:2000, Ab82958, Abcam), CB1
(Guinea pig 1:1000, Gift of M. Watanabe), CB1 (Rabbit, 1 µg/ml, ImmunoGenes), CCK (Mouse, 1:3000 #9303, CURE).
Custom-labeled secondary antibodies were prepared using amino-reactive dyes Alexa Fluor (AF) 405 or Cy3 and AF647; and unlabeled antibodies (donkey anti Guinea pig, mouse or rabbit, Jackson). Labeled fluorescent secondary antibodies were purchased from Jackson (AF594 donkey anti mouse and AF647 donkey anti Guinea pig).
For the staining of HEK cells, petri dishes with fixed cells were washed three times in PB, permeabilized for 10 minutes in 0.05M Tris-buffered saline (TBS, 0.9% NaCl, pH = 7.4) with 0.1% Triton X-100, and then incubated with primary antibody for 1 hr. After 3 washes in TBS, secondary antibodies were added for 1 hour, and dishes were washed twice in TBS and twice in PB, and stored in PB with 0.05% NaN3 until imaging.
Slices containing biocytin-filled neurons were developed, mounted in Vectashield, and imaged by confocal microscopy (see below). Then, slices embedded in 2% agarose, and sectioned on a Vibratome to 20 µm thickness. Sections were washed extensively in TBS, and then incubated in blocking solution containing 1% bovine or human serum albumin in TBS, incubated overnight in TBS containing one or two of the primary antibodies, washed extensively in TBS, and then incubated in the respective secondary antibodies for 4 hours.
Finally, sections were washed again in TBS and PB, the hippocampi were trimmed, and mounted on glass coverslips in PB, and stored dry at 4°C until imaging.
4
3.4. Microscopy
For the imaging of cellular morphology, confocal z-stacks were recorded from the field of view containing the filled cell with a 20x objective (0.75 NA) on an A1R or C2 confocal microscope (Nikon). All STORM imaging was carried out on an N-STORM system (Nikon), consisting of a Ti-E microscope equipped with laser TIRF illuminator, 405, 488, 562 and 647 nm lasers, an Andor iXon DU-897 EMCCD, a C2 confocal scanhead, and a 100x TIRF objective (1.49 NA). Before imaging each specimen, fresh imaging medium was prepared, containing 5% glucose, 0.1 M 2-Mercaptoethylamine, 1 mg/ml glucose oxidase (Sigma) and 1500 U/ml catalase (Sigma) in Dulbecco’s phosphate buffered saline.
For HEK cells, GFP-positive cells were imaged in confocal then in STORM mode with 2000 cycles of 1 activation (561 nm, low power) and 3 reporter (647 nm, maximal power) frames each, 30 ms exposure time. For tissue sections, axon terminals were imaged with confocal and then single-channel or dual-channel 3D-STORM microscopy (1000 cycles per channel, 1 activation (405 or 561 nm, low power) and 3 reporter (647nm, maximal power) frames, 30 ms each, per cycle).
3.5. Image analysis
Low-magnification confocal images of filled neurons were analyzed in ImageJ, or reconstructed in Neurolucida 10 (MBF Bioscience). Measurements for bouton distribution index calculations were performed in ImageJ using custom macros. High magnification confocal stacks (used for correlated STORM analysis) were deconvolved with Huygens Professional (SVI), and STORM images were processed with NIS Elements STORM Module (Nikon). Localization points belonging to the filled axon terminal of the labeled neuron were selected using custom ImageJ macros. The resulting molecule lists were analyzed with custom-written scripts in ImageJ, Matlab or Python languages. Visualization of the STORM images was obtained with NIS-Elements STORM module as two- dimensional Gaussian representations, or with VMD (University of Illinois) as 3D renderings. Statistical analysis and plotting graphs were carried out using Statistica (Dell), and figures were prepared using Photoshop (Adobe).
5
4. Results
4.1. STORM super-resolution imaging in cell culture model
To validate the use of STORM for studying the nanoscale subcellular distribution of CB1 cannabinoid receptors, we have first used the simplified model of a heterologous expression system. Human embryonic kidney cells (HEK-293) were transiently transfected with N-terminally EGFP-tagged CB1. After immunostaining against CB1, the chimeric protein construct can be imaged using confocal microscopy by detecting the intrinsic fluorescence of EGFP, and also by STORM to detect the reporter dyes. Thus, if the anti-CB1
immunostaining and STORM imaging are sensitive, specific and quantitative, the number of detected molecules in STORM is expected to be proportional to the EGFP fluorescence intensity. To test these hypotheses, we have compared correlated image pairs of transfected HEK cells, and found that intrinsic EGFP fluorescence was strongly correlated to the number of localization points (NLP) in the CB1 STORM image (n = 46 cells, Spearman’s rank order correlation, R = 0.92, p < 0.001). The experimentally determined localization precision was 5.7 nm in the lateral and 32.1 nm in the axial dimensions, respectively.
4.2. STORM super-resolution imaging of cannabinoid receptors in brain tissue To validate the use of STORM in mouse brain tissue, we have used sections from the hippocampi of WT and CB1 KO mice, immunostained against both CB1, and the neuropeptide colecystokinin (CCK), which is widely used as a marker of CB1-expressing interneurons. In the pyramidal layer of the CA1 subfield, CB1- and CCK positive varicosities surrounded the immunonegative somata of pyramidal neurons in basket-like arrays. STORM images of the axon terminals revealed hollow, ring-shaped CB1 labeling.
Quantification of the number of CB1 STORM localization points (NLP) in axon terminals (rectangular ROIs selected based on the correlated epifluorescent image of CCK labeling) revealed less than 1% background in the CB1 immunostaining (n = 208 and 200 ROIs from 3 WT and 2 KO mice, respectively). These results indicate that similarly to our previous observations in cell cultures, CB1 immunostaining detected by STORM is also sensitive and specific in fixed hippocampal sections.
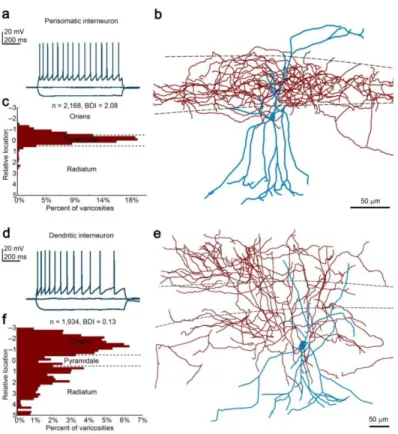
Multiple subclasses of interneurons express CB1 in the CA1 region, and different populations of CCK/CB1-positive interneurons show fundamentally different sensitivity to both exogenous and endogenous cannabinoids. Thus, we aimed to develop a cell-specific bouton sampling approach which allows the integrated analysis of morphological, physiological and nanoscale molecular parameters of neurons. To this end, we have carried out patch-clamp electrophysiological recordings in acute hippocampal slices and labeled the recorded cells with biocytin. We have recorded from large multipolar neurons located in the stratum radiatum of the CA1, with regular spiking firing pattern, a characteristic electrophysiological feature of CCK/CB1-expressing interneurons. Post-hoc morphological characterization of axonal distribution (Figure 1) revealed that most cells belonged to either of two distinctive morphological types: perisomatically targeting (PtIN) and dendritically targeting interneurons (DtIN). To avoid examining heterogeneous cell populations, we have developed a quantitative bouton distribution index (BDI) for the characterization of axonal morphology. Cells with BDI > 1 were included as PtIN, whereas cells with BDI < 0.5 were included as DtIN. Intermediate cells, accounting for less than 5% of all recorded cells, were excluded from the sample.
6
Figure 1. Morphological classification of regular-spiking interneurons. (a) Voltage traces recorded in multipolar CA1 radiatum neurons show regular spiking (accommodating) pattern. (b) Reconstruction of a representative perisomatic interneuron. (c) Quantitative evaluation of the distribution of axonal varicosities allows unbiased morphological categorization. (d-f) The same experimental workflow revealed similar firing pattern, but remarkably different distribution of the axons of a DtIN.
After the morphological classification of the cells, we have compared their active and passive electrophysiological properties across cell types (n = 14 and 18 perisomatic and dendritic cells, respectively, Mann-Whitney U test). We found no significant difference in the resting membrane potential, input resistance, relative sag amplitude, rebound potential, and action potential amplitude. However, PtINs expressed wider action potentials, smaller afterhyperpolarization, and slower initial firing, resulting in a lesser degree of frequency adaptation compared to dendritic cells (p<0.05).
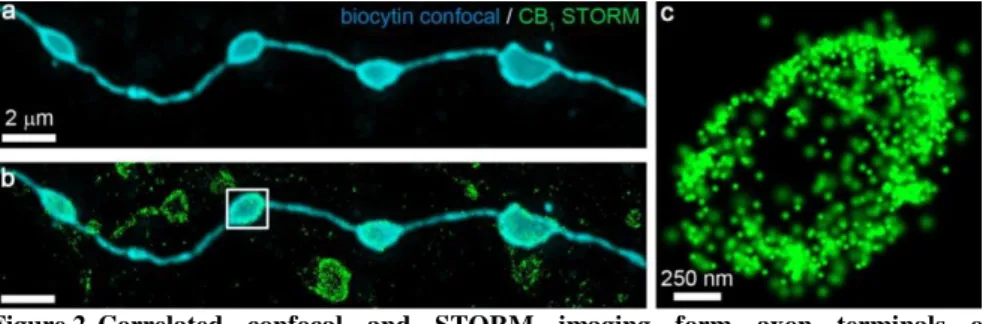
Next, we aimed to obtain high resolution molecular localization data from the axon terminals of the identified neurons using correlated confocal and STORM imaging. We have localized the labeled axonal varicosities of the filled interneurons, and captured confocal
7
image stacks of the biocytin fluorescence, followed by 3D-STORM imaging of anti-CB1
immunostaining (Figure 2). After alignment of the respective image pairs, it became possible to dissect the STORM LPs belonging to a given axon terminal. Throughout the study, we have used this correlative imaging approach to obtain nanoscale molecular distribution data from the axon terminals of identified interneurons.
Figure 2. Correlated confocal and STORM imaging form axon terminals of individually labeled neurons. (a) Deconvolved confocal image of a biocytin-labeled string of boutons from an identified, morphologically and electrophysiologically characterized interneuron. (b) Overlaying the STORM image reveals dense CB1 immunolabeling on the surface of axon terminals and on connecting axonal segments. (c) STORM image of the boxed axon terminal illustrates the doughnut-shaped distribution of CB1.
4.3. Distribution of CB1 on axon terminals of perisomatically and dendritically targeting interneurons
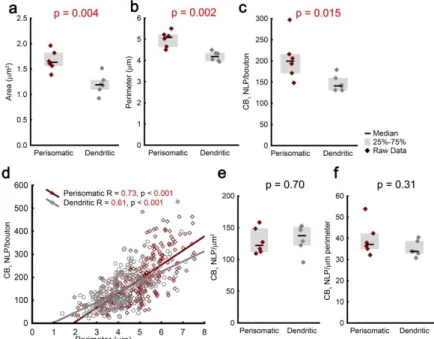
Could the higher cannabinoid sensitivity of PtINs be simply explained by more CB1
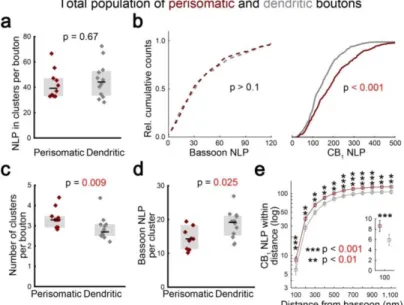
receptors on their axon terminals? To test this hypothesis, we have first measured the CB1 content of on average 50 ± 3 axon terminals form 6 perisomatic and 6 dendritic interneurons. From the confocal images of the biocytin cell fill, we have also determined the size of the axon terminals. Perisomatic cells had 39% larger axon terminals compared to dendritic interneurons (Mann-Whitney U test, Figure 3a-b), and the CB1 NLP was also 40%
higher on the axon terminals of PtINs (Figure 3c).
Does the similar effect size in the cell type-specific differences in bouton size and CB1 NLP reflect correlation between the two parameters? Indeed, CB1 levels expressed a moderately strong correlation with perimeter in the boutons of PtINs and DtINs (n = 279 and 334 terminals, respectively, Spearman’s rank order correlation, Figure 3d). The density of CB1 was similar between PtINs and DtINs (Figure 3e-f). Taken together, bouton size is a major predictor of the number of CB1 receptors, and while additional factors may contribute to the variability between axon terminals, both investigated interneuron subclasses express presynaptic CB1 in a similar density.
8
Figure 3. The CB1 content scales with the size of inhibitory axon terminals. (a-b) Axon terminals of PtINs are larger than those of DtINs. (c) In parallel, perisomatic boutons contain more CB1 receptors. (d) CB1 NLP is correlated with bouton size at the level of individual axon terminals. (e-f) On average, perisomatic and dendritic interneurons contain similar density of presynaptic CB1 receptors. Graphs show median ± IQR.
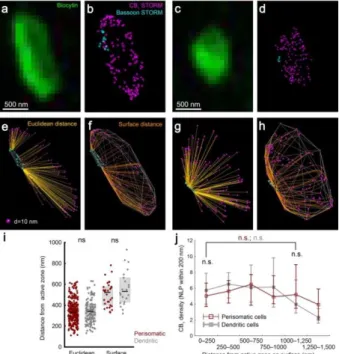
The similar density of CB1 receptors on the boutons of both PtINs and DtINs is in apparent contradiction with the higher efficacy of cannabinoids on perisomatic inhibition, suggesting that the abundance of presynaptic CB1 receptors per se is not the main factor setting the cannabinoid sensitivity of synapses. Thus, in the next set of experiments we tested whether the CB1 NLP in the vicinity of synapses, where the receptors can effectively control neurotransmitter release through plasma membrane-delimited GPCR signaling, is similar between cell types. To study the synapse-related nanoscale distribution of CB1, we have utilized immunostaining against bassoon to label synaptic active zones. We have carried out dual-channel STORM experiment against CB1 and bassoon on slices containing filled PtINs and DtINs. On the biocytin-labeled axon terminals of electrophysiologically and morphologically characterized interneurons, first we have measured the 3D Euclidean distance of each CB1 LP form the nearest bassoon LP (Figure 4e,g). On average, the CB1-to- bassoon distances were similar in the axon terminals of PtINs and DtINs (Figure 4i, n = 311 and 141 axon terminals from 10 perisomatic and 10 dendritic cells, Mann-Whitney U test, p
= 0.69). Additionally, we have measured the length of the shortest path between LPs on the surface of the convex hull fitted on the CB1 channel. The mean surface distance of CB1 LPs from bassoon LPs was similar between cell types (Figure 4i, n = 33 and 22 axon terminals from 8 perisomatic and 5 dendritic cells, Mann-Whitney U test, p = 0.31).
9
Figure 4. Homogenous distribution of CB1 on the surface of axon terminals. (a-b) Axon terminal of a PtIN filled with biocytin, immunostained against CB1 and bassoon, and imaged using dual-channel STORM. While CB1 labeling decorated the entire surface of the bouton, bassoon labeling was restricted to clusters at the edge of axon terminals. (c-d) The same approach was used to label axon terminals of DtINs. (e-h) 3-D renderings of the optical sections of two axon terminals showing the CB1 and bassoon LPs, together with the trajectories used for distance measurements (yellow), and the convex hull fitted on the CB1 points (silver). (i) The mean distance of CB1 from bassoon was similar between axon terminals of PtINs and DtINs (j) The spatial density of CB1 LPs, measured at random points of the surface of the convex hull was similar between cell types, and was independent of the distance from bassoon-labeled active zones (median ± IQR).
To determine if CB1 is specifically enriched in the proximity of synaptic active zones, we directly measured the density of LPs on the surface defined by the convex hulls.
Surprisingly, we have found that the surface density of CB1 near synaptic active zones was identical between PtINs and DtINs (n = 33 and 22, respectively, p = 0.86, Mann-Whitney U test). Altogether, these data suggest that CB1 receptors cover the extrasynaptic axonal membrane of GABAergic interneurons homogenously, with similar density between subtypes of CB1-positive interneurons. Therefore, the number and nanodomain-specific positioning of receptors is not likely to underlie cell type-specific alterations in the cannabinoid sensitivity of synaptic transmission.
10
4.4. Organization of presynaptic active zones in CB1-positive axon terminals The endocannabinoid system regulates GABA release by inhibiting the function of presynaptic molecules that promote vesicle fusion. The degree of overall inhibition should depend not only on the number of activated receptors, but also on the number of effector molecules to be controlled by those receptors. The observation that CB1 receptor densities are uniform between cell types lead us to hypothesize that a difference in the ratio of receptor and effector molecules can underlie the difference in cannabinoid sensitivity. But how to measure the number of relevant effector molecules to be controlled by CB1? The size of presynaptic active zones was shown to correlate tightly with release probability, with the amplitude of calcium transients, and also with the abundance of VGCCs and RIM proteins.
Thus, active zone size can serve as a proxy to measure the potency of the axon terminal for vesicle release. As bassoon expression selectively labels presynaptic active zones, we have performed single-channel STORM imaging of bassoon in labeled axon terminals of identified interneurons.
Consistently with the active zone-restricted distribution of bassoon, STORM images of anti-bassoon immunostaining show the accumulation of bassoon in distinct puncta near the edge of the axon terminals. Unlike in the case of dual-channel STORM, the lack of crosstalk allowed uncompromised quantification of the distribution of bassoon in this experiment. Because of the conspicuous accumulation of bassoon in multiple spots, we sought to assess the spatial clustering of STORM. Despite the larger size of perisomatic axon terminals (see Figure 3), axon terminals of both PtINs and DtINs contained similar numbers of bassoon LPs (Figure 5a, n = 349 and 374 boutons from 10 perisomatic and 12 dendritic cells, respectively, Mann-Whitney U test), which is in stark contrast with the difference in CB1 NLPs measured in a separate single-staining experiment (Figure 5b, two- sample Kolmogorov-Smirnov test). However, after spatial clustering of the bassoon LPs, we have detected a higher number of clusters in perisomatic axon terminals (Figure 5c).
Consequently, the size of individual clusters was smaller, indicating a more fragmented nanoscale organization of the presynaptic active zone in perisomatic synapses (Figure 5d).
This observation, together with the previously established homogenous distribution of CB1 receptors across the plasma membrane of axon terminals, lead us to hypothesize that individual presynaptic active zones of PtINs express an increased local ratio of CB1 and bassoon LPs, which may be important due to the limited distance within which CB1 downstream signaling can affect release sites. Indeed, we have found that in dual-channel CB1-bassoon STORM data, there are 49% more CB1 LPs in the vicinity of bassoon clusters at perisomatic synapses (Figure 5e).
11
Figure 5. Fragmented active zone architecture results in higher CB1 receptor to effector ratio in axon terminals of perisomatically targeting interneurons. (a) Quantification of single-channel bassoon STORM labeling in biocytin-labeled axon terminals of PtINs or DtINs. (b) Cumulative histograms comparing bassoon- and CB1- content of perisomatic and dendritic axon terminals. (c) Perisomatic axon terminals contain more clusters of bassoon STORM labeling. (d) Individual clusters in PtIN axon terminals contain fewer bassoon LPs compared to DtINs. (e) In dual-channel STORM images, the number of CB1 NLP within any given distance limit from bassoon is higher in perisomatic axon terminals (median ± IQR, insert shows results for the 100 nm distance limit).
Altogether, the integrated analysis of results from single-channel and dual-channel STORM experiments revealed that the average cluster comprises fewer copies of bassoon in terminals of PtINs compared to DtINs, while it is surrounded by the same density of CB1 receptors. This configuration leads to an increased putative ratio of CB1 receptors and their downstream effectors at perisomatic synapses, which might explain the increased sensitivity to endogenous and exogenous cannabinoids of PtIN to pyramidal cell connections.
4.5. Dynamic reorganization of CB1 distribution on agonist application
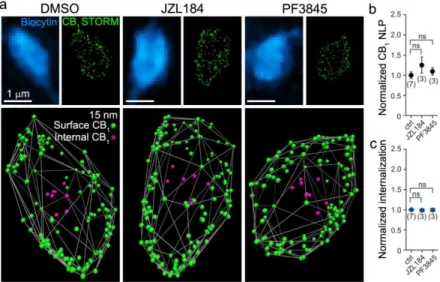
Thus far, we have determined the principles underlying steady-state distribution of CB1 receptors, showing homogenous density of CB1 across the extrasynaptic plasma membrane of GABAergic axon terminals. After activation by binding of a ligand, GPCR signaling is terminated by receptor internalization. Thus, we have predicted that increased levels of endogenous or exogenous cannabinoid agonists may lead to reorganization of CB1 on axon terminals. To test this hypothesis, we first investigated nanoscale CB1 distribution with the cell-specific STORM approach after pharmacologically elevating the levels of endocannabinoids in slices. Incubation of acute brain slices with 100 nM JZL184 (JZL), a
12
selective inhibitor of MGL, or with 1 µM PF3845 (PF), a FAAH inhibitor, doubles the levels of 2-AG and anandamide, respectively, by preventing their enzymatic degradation.
Surprisingly, the treatment did not affect CB1 NLP, or the ratio of internalized CB1 receptors (n = 3, 3 and 7 cells, respectively, 22±12 boutons per cell, Kruskal-Wallis ANOVA and median test, Figure 6b-c).
Figure 6. The membrane expression of CB1 is not affected by increased levels of endocannabinoids. (a) Axon terminals of individually filled PtINs from slices acutely treated with vehicle or with JZL or PF, increasing tissue levels of 2-AG or anandamide, respectively. (b) Acute elevation of endocannabinoid levels did not alter CB1 NLP on axon terminals. (c) The treatment had no effect on the internalization of CB1 LPs (mean ± SEM).
The results showing no reorganization of CB1 receptors upon MGL inhibition are surprising, because chronic MGL blockade has been shown to lead to behavioral tolerance and CB1 downregulation. One possible explanation for this contradiction is that the duration of preincubation is too short compared to the time scale of the dynamics of surface CB1
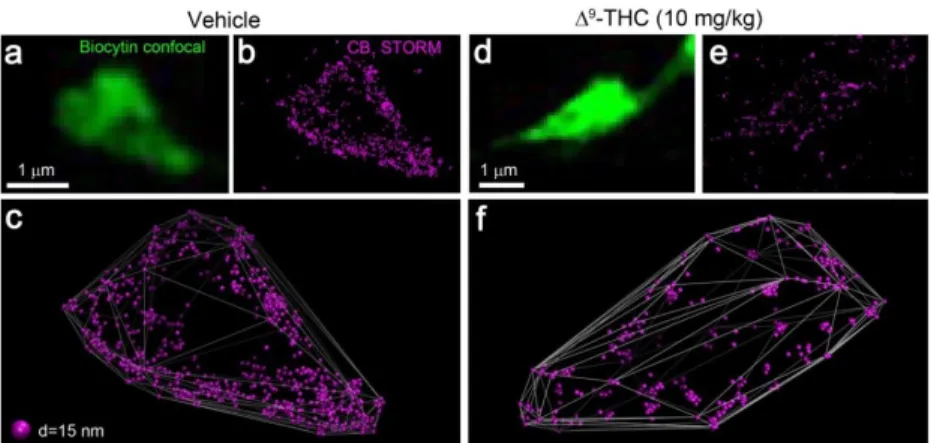
density. To robustly test the long-term changes in presynaptic CB1 expression at GABAergic axon terminals, we have turned to an in vivo animal model. We have carried out an established chronic THC administration protocol known to induce behavioral and functional tolerance for CB1 agonists, by injecting mice intraperitoneally with 10 mg/kg THC twice daily for 6.5 days. To assess the reorganization of presynaptic CB1 receptors at GABAergic axon terminals, PtINs were recorded from slices from vehicle- and THC-treated mice and processed for cell-specific CB1 STORM. On the axon terminals of PtINs, CB1 STORM LPs covered the surface in high density (Figure 7a-c). Strikingly, in neurons of THC-treated mice, the CB1 STORM signal did no longer outline the biocytin-containing axon terminals clearly, and clusters of LPs were observed inside the convex hulls, unlike in cells from vehicle-treated mice (Figure 7d-f).
13
Figure 7. Chronic THC treatment leads to remodeling of CB1 distribution. (a) Axon terminal of an identified PtIN filled in a section from vehicle-treated mouse. (b) Correlated CB1 STORM image of the labeled axon terminal. (c) Three-dimensional rendering of CB1
LPs. CB1 decorates the surface of the axon terminal. (d-f) CB1 STORM signal after chronic THC treatment. The amount of CB1 labeling is markedly reduced, and clusters of LPs are detected inside the axon terminals.
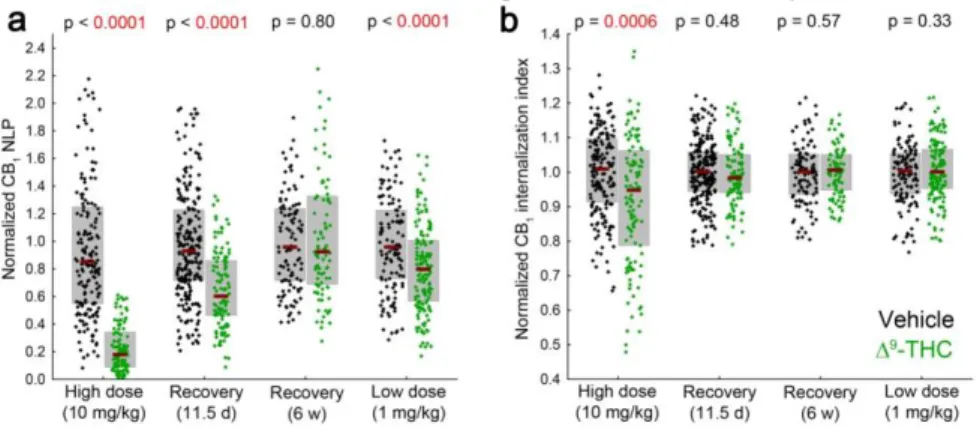
To quantitatively evaluate the redistribution of labeling, we have measured the NLP and the internalization index of PtIN axon terminals (n = 185 and 117 axon terminals from 3 vehicle- and 2 THC-treated mice, Mann-Whitney U test). The amount of CB1 labeling per bouton has decreased significantly by 74% after THC treatment (Figure 8a), and this change was accompanied by a significant shift of the remaining LPs from the surface towards the center of the axon terminals (Figure 8b). Together, these results show that chronic treatment with a high dose of THC induces significant reorganization of CB1 receptors at GABAergic synapses.
Next, we have studied whether THC-induced reorganization of CB1 is reversible. To examine the correlation between behavioral tolerance and molecular reorganization, we have studied recovery after 11.5 days, when behavioral tolerance induced by the chronic THC treatment is completely restored, and, as a positive control for recovery, after 6 weeks, when all known studies of THC tolerance report complete restoration of receptor levels and function. After 11.5 days of recovery, the CB1 NLP in THC-treated mice was still below control levels by 35%, while increased internalization of CB1 was no longer evident (Figure 8a-b, n = 283 and 113 boutons from 3 vehicle- and 3 THC-injected mice). After the longer recovery period of 6 weeks, both CB1 NLP and the internalization index were undistinguishable between treatment groups (Figure 8, n = 113 and 92 boutons from 2 vehicle- and 3 THC-injected mice).
The 10 mg/kg dose of THC used in the above experiments is considered high, as it has been established for the purpose of inducing tolerance. In the therapeutic dosing of THC, for instance in the case of Sativex, a combined THC and CBD preparation with indication for multiple sclerosis, a lower dose is used to avoid psychoactive effects and the development of
14
tolerance. To test whether the significant rearrangement of CB1 distribution is prevented when lower, therapeutically relevant doses are administered, we have repeated the experiment with 1 mg/kg dosing. We have detected slight (16%), but significant decrease in CB1 NLP on axon terminals of PtINs, without any noticeable effect on the internalization index (Figure 8, n = 113 and 92 boutons from 2 vehicle- and 3 THC-injected mice).
Together, these experiments show that chronic exogenous cannabinoid application leads to a dose-dependent and reversible loss of CB1 from the surface of hippocampal GABAergic axon terminals, with different time-scale of receptor internalization and degradation.
Figure 8. Recovery and dose-dependence of molecular reorganization after chronic THC exposure. (a) The NLP on axon terminals of individually labeled PtINs was determined after THC treatment in four separate experiments, each including vehicle-treated mice for designated controls. Chronic THC injections resulted in a marked loss of CB1 from axon terminals, which effect recovered only partially within 11.5 days, and completely within 6 weeks. A lower, therapeutically relevant dosing resulted in a lesser degree of reduction in CB1 NLP. (b) The CB1 internalization index was measured on the same axon terminals. Internalization of CB1 was evident only after high dose THC treatment, and recovered quickly.
15
5. Conclusions
We have shown that STORM super-resolution microscopy, combined with the labeling of single identified neurons during patch-clamp recording, is an efficient approach for the correlated analysis of electrophysiological and morphological features together with the underlying molecular properties of neurons. The NLP in a STORM image is correlated to protein abundance, allowing relative quantitative molecular imaging with a resolution rivalling that of immunogold electron microscopy (6 nm lateral, and 41 nm axial localization precision).
We have applied this approach to show that on the axon terminals of CB1-expressing hippocampal interneurons, the size of the terminal is a strong predictor of CB1 content, and PtINs have larger axon terminals with 39% more CB1 NLP compared to DtINs. The density of CB1 along the extrasynaptic plasma membrane is uniform and homogenous in both cell types. These results are in contrast with the greater cannabinoid sensitivity of PtINs, suggesting that receptor density alone does not determine the strength of functional CB1- mediated signaling.
The axon terminals of both cell types contain similar levels of bassoon, clustered into more, but smaller individual active zones in PtINs compared to DtINs. Consequently, 49%
more CB1 LPs are found within the active zone nanodomains of PtIN axon terminals. Thus, the relative nanodomain concentration of CB1 and its downstream effector molecules near vesicle release sites may determine the efficiency of cannabinoid-induced synaptic regulation, and explain the increased cannabinoid sensitivity and tonic endocannabinoid signaling at these synapses.
Acute elevation of endocannabinoid levels by blocking the degradative enzymes of anandamide or 2-AG does not result in a change in the CB1 levels of PtIN axon terminals, or in the ratio of internalized receptors. Chronic in vivo THC treatment, however, induces large, 74% reduction in CB1 NLP on axon terminals of identified PtINs, and increased ratio of internalized receptors. The chronic reorganization of CB1 distribution recovered partially (53% of lost signal was restored) after 11.5 days of THC withdrawal, and complete recovery was reached after 6 weeks. Chronic treatment with low, therapeutically relevant dose of THC induced minor decrease by 16% in presynaptic CB1 NLP without detectable change in the ratio of internalized receptors. Taken together, our results demonstrate the dose- dependent, reversible removal of CB1 receptors from hippocampal GABAergic axon terminals during THC tolerance, which is likely the molecular background of cannabis- induced cognitive deficits.
16
6. List of publications
Publications related to this thesis
Dudok B1, Barna L1, Ledri M1, Szabó SZI, Szabadits E, Pintér B, Woodhams SG, Henstridge CM, Balla GY, Nyilas R, Varga C, Lee SH, Matolcsi M, Cervenak J, Kacskovics I, Watanabe M, Shaggedu C, Melis M, Pistis M, Soltesz I, Katona I (2015) Cell type-specific STORM super-resolution imaging reveals nanoscale organization of cannabinoid signalling at hippocampal GABAergic synapses. Nature Neuroscience 18:75- 86.
Lee SH, Ledri M, Tóth B, Marchionni I, Henstridge CM, Dudok B, Kenesei K, Barna L, Szabó SZI, Renkecz T, Oberoi MK, Watanabe M, Limoli C, Horvai G, Soltesz I, Katona I (2015) Multiple Forms of Endocannabinoid and Endovanilloid Signaling Regulate the Tonic Control of GABA Release. Jornal of Neuroscience 35:10039-10057.
Other publications
Barna L1, Dudok B1, Miczán V, Horváth A, László ZSI, Katona I (2016) Correlated confocal and super-resolution imaging by VividSTORM. Nature Protocols 11:163-183.
Neuhofer D, Henstridge CM, Dudok B, Sepers M, Lassalle O, Katona I, Manzoni OJJ (2015) Functional and structural deficits at accumbens synapses in a mouse model of Fragile X. Frontiers in Cellular Neuroscience 9:100.
Nyilas R, Dudok B, Urbán GM, Mackie K, Watanabe M, Cravatt BF, Freund TF, Katona I (2008) Enzymatic machinery for endocannabinoid biosynthesis associated with calcium stores in glutamatergic axon terminals. Journal of Neuroscience 28:1058-1063.
1equal contribution