THE ROLE OF THREE-DIMENSIONAL ECHOCARDIOGRAPHY
IN THE EVALUATION OF PHYSIOLOGICAL AND PATHOLOGICAL RIGHT VENTRICULAR REMODELING
Doctoral Thesis
Doronina Alexandra M.D.
Semmelweis University
Doctoral School of Basic and Translational Medicine
Supervisors: Béla Merkely M.D., Ph.D., D.Sc.
Attila Kovács M.D., Ph.D.
Official Reviewers: Réka Faludi M.D., Ph.D.
Gergely Szabó M.D., Ph.D.
Head of Final Examination Committee:
Katalin Darvas M.D., Ph.D.
Members of Final Examination Committee:
Leila Seres M.D., Ph.D.
Viktor Horváth M.D., Ph.D.
Budapest
2018
1 TABLE OF CONTENTS
1. ABBREVIATIONS ... 4
2. INTRODUCTION ... 7
2.1 Comparison of anatomical features and physiology of the left and right ventricles .... 9
2.1.1 Left ventricle ... 9
2.1.2 Right ventricle ... 11
2.2 The impact of intense exercise of strength or endurance types of training: Morganroth theory. ... 14
2.3 Cardiac adaptation to intense exercise ... 16
2.3.1 Left ventricular adaptation to intense exercise. ... 16
2.3.2 Right ventricular adaptation to intense exercise. Right ventricular exercise- induced dysfunction. ... 18
2.4 Female athlete’s heart ... 21
2.5 Basic principles and importance in SCD of athletes ... 22
2.5.1 Etiology of SCD in athletes ... 23
2.6 Hypertrophic cardiomyopathy ... 25
2.7 Arrhythmogenic cardiomyopathy ... 26
2.8 Pre-participation screening ... 30
2.9 Ultrasound ... 31
2.9.1 Basic principles and conventional parameters ... 31
2.9.2 2D deformation imaging ... 36
2.9.3 Three-dimensional echocardiography: basic principles ... 38
2.9.4 ReVISION method ... 42
2
2.9.5 3D echocardiography in clinical routine and in assessing physiological and
pathological RV remodeling ... 45
3. OBJECTIVES... 47
3.1 Investigation of cardiac remodeling in female athletes induced by different types of exercise training ... 47
3.2 Investigation of physiologic cardiac remodeling in elite male kayak and canoe athletes ... 47
4. METHODS ... 48
4.1 Study populations ... 48
4.1.1 Female athlete’s heart... 48
4.1.2 Elite male kayak or canoe athletes ... 48
4.1.3 HTX recipients ... 49
4.2 Methodology ... 50
4.2.1 Body composition measurement ... 50
4.2.2 Conventional echocardiography ... 50
4.2.3 3D echocardiography ... 51
4.3 Statistical analyses ... 52
5. RESULTS ... 53
5.1 Investigation of cardiac remodeling in female athletes induced by different types of exercise training ... 53
5.2 Investigation of physiologic cardiac remodeling in elite male kayak and canoe athletes ... 61
5.3 Determination of RV mechanical pattern in pathological RV remodelling ... 67
6. DISCUSSION... 76
3
6.1. Investigation of cardiac remodeling in female athletes induced by different types of
exercise training ... 76
6.2 Investigation of physiologic cardiac remodeling in elite male kayak and canoe athletes ... 79
6.3 Determination of RV mechanical pattern in pathological RV remodelling ... 81
6.4 Limitations ... 84
7. CONCLUSIONS ... 86
8. SUMMARY ... 87
9. ÖSSZEFOGLALÁS ... 88
10. ACKNOWLEDGEMENTS ... 89
11. BIBLIOGRAPHY ... 90
12. BIBLIOGRAPHY OF CANDIDATE`S PUBLICATIONS ... 115
12.1 Publications related to the present thesis ... 115
12.2 Publications not related to the present thesis ... 116
4 1. ABBREVIATIONS
2D Two-dimensional
3DE Three-dimensional echocardiography A Late wave of mitral inflow
a` Late diastolic velocity
AC Arrhythmogenic Cardiomyopathy
A4C Apical 4-chamber view
A2C Apical 2-chamber view
ANOVA Analysis of variance
BMI Body Mass Index
BSA Body Surface Area
CMR Cardiac Magnetic Resonance Imaging
CT Computed Tomography
DCT Deceleration time
DCM Dilated Cardiomyopathy
E Early wave of mitral valve inflow e` Early diastolic velocity
EDV End-diastolic volume EDVi End-diastolic volume index
EF Ejection Fraction
ESV End-systolic volume
ESVi End-diastolic volume index FAC Fractional Area Change FFMI Fat Free Mass Index
GCS Global Circumferencial Strain GLS Global Longitudinal Strain GRS Global Radial Strain
ID Internal Diameter
ICU Intensive Care Unit
5
IFBB International Federation of Bodybuilding and Fitness IGF Insulin-like Growth Factor
ISHLT International Society for Heart&Transplantation IVC Inferior Vena Cava
IVSd Interventricular Septum in end-diastole HCM Hypertrophic Cardiomyopathy
HR Heart rate
HTX Heart transplantation
LEF Longitudinal ejection fraction
LV Left Ventricle
LVEDV Left Ventricular end-diastolic volume LVESV Left ventricular end-systolic volume LVH Left Ventricular Hypertrophy
IVIDd Left Ventricular Internal Diameter LVMi Left Ventricular Mass index LVOT Left Ventricular Outflow Tract
LVPWd Left Ventricular Posterior Wall Diameter in end-diastole LVWT Left Ventricular Wall Thickness
M-mode Motion Mode
MRI Magnetic Resonance Imaging
PA Pulmonary Artery
pAMR2 Pathologic antibody-mediated reaction PASP Pulmonary arterial systolic pressure PVK Pulmonary vascular resistance
PW Posterior Wall
PW TDI s` Pulsed-Wave Tissue Doppler Imaging systolic velocity
RA Right Atrium
REF Radial ejection fraction
ReVISION Right VentrIcular Separate wall motIon quantificatiON
RV Right Ventricle
6 RVOT Right Ventricular Outflow Tract RVTD Right Ventricular Internal Diameter RWT Relative Wall Thickness
S End-systole
SBP Systolic blood pressure
SCD Sudden Cardiac Death
SV Stroke Volume
SVi Stroke Volume index
TAPSE Tricuspid Annular Plane Systolic Excursion TEF Total ejection fraction
TR Tricuspid regurgitation
7 2. INTRODUCTION
The right ventricle (RV) is the heart chamber that receives deoxygenated blood from the right atrium (RA) and then pumps it into the pulmonary artery (PA) to maintain the pulmonary circulation. Although there is no doubt that the RV is important for normal physiology, the role of the RV in cardiac pathology is frequently underestimated. Currently, there is clear evidence showing that the RV is a strong predictor of outcomes in a range of pathologic conditions, such as RV myocardial infarction, heart failure, pulmonary hypertension, myocarditis, and cardiomyopathies, in addition to heart transplant (HTX) patients (1). Echocardiography remains the routine clinical examination of choice to assess RV structure, function and hemodynamics (2, 3). However, it is complicated to analyze RV dysfunction based on a conventional echocardiographic examination because it is located in an anterior position right behind the sternum and has a complex geometry, prominent trabeculations and a poorly delineated endocardial border. Hence, the myocardial mechanics of the RV are not fully understood. Novel modalities, such as three-dimensional echocardiography (3DE) and speckle-tracking echocardiography, can be useful for overcoming these limitations and may provide a better understanding of the mechanical aspects of RV performance under physiological conditions (e.g., in athlete’s heart) and the mechanisms underlying cardiac diseases.
Athlete’s heart’ is an umbrella term that covers various cardiac effects resulting from regular intense exercise. It is a non-pathological complex of changes in the functional, structural and electrical characteristics of the heart and is also referred to as “athletic heart syndrome”, “athletic bradycardia” or “exercise-induced cardiomegaly”. It is a physiological, benign condition that makes intensive bouts of exercise more well-tolerated in athletes than in nonathletes in addition to playing an important physiological role heart adaptations that help a good athlete to become a great one. According to the law of Laplace,
“a larger heart can fill and empty larger volumes more efficiently” than does a smaller heart (4). Athlete’s heart has been a topic of great interest for cardiologists for almost two centuries and continues to be a popular topic today. The first study in the literature to describe the remarkable changes that occur in cardiac morphology in response to intensive
8
exercise appeared in the 19th century. The first such observations were initially presented in early 1890 by a Swedish clinician, Henschen (5) who described findings in elite Nordic skiers. Eugene Darling (6) from Harvard University used percussion and auscultation to determine whether cardiac dimensions were increased in university rowers. In the early 1900s, Paul Dudley White (7) provided the first report of sinus bradycardia at resting among long-distance runners. Chest X-rays later confirmed both Darling’s and Henschen’s findings by showing that the hearts of sportsmen are enlarged (4).
Sudden cardiac death (SCD) is a tragic event that occurs in professional athletes in all age groups. In athletes older than 35 years old, 80% of cases of SCD occur due to coronary artery disease, while in younger athletes (>35 years old), the most frequent causes of SCD are hypertrophic cardiomyopathy (HCM) and arrhythmogenic cardiomyopathy (AC) (8, 9).
Elite athletes train and perform at levels that exceed the capabilities of most others groups.
As a result, they may develop myocardial hypertrophy as a physiological response to intensive physical training. The degree of increased myocardial thickness as a result of athletic physiological adaptations is associated with the pathological hypertrophy observed in HCM, making it difficult to distinguish the two entities. Left ventricular (LV) wall thickness (LVWT) ranging between 12 and 16 mm represents the "gray zone" between the physiological adaptations exhibited by athletes and the pathological expression of HCM.
AC is a progressive inherited muscle disorder characterized by ventricular arrhythmia, heart failure and SCD that manifests predominantly in younger individuals. Traditionally, AC has been associated with the Mediterranean basin; however, the growing incidence of AC, around the world suggests that this disease may not be associated with ethnicity or geography (10). AC accounts for approximately 5% of the incidence of SCD in athletes and has an overall incidence of 1/1,000 in the general population (8, 11).
In athletes, it can be difficult to distinguish physiological from pathological alterations. A misdiagnosis can be devastating to an athlete because it can result in an unnecessary interruption in training or elimination from competition. Conversely, a false negative diagnosis could jeopardize a young life and prevent further risk stratification or the evaluation of family members for genetic conditions. Currently, interest in clinical and research studies aimed at evaluating adaptations in the RV is growing because of awareness
9
about AC and exercise-induced RV dysfunction. The aim of the present thesis is to discuss the role of 3DE in evaluating RV remodeling and determine whether it can be utilized to help clinicians assess physiological and pathological cardiac processes.
2.1 Comparison of anatomical features and physiology of the left and right ventricles
2.1.1 Left ventricle
The LV forms the left-lateral and diaphragmatic surface of the heart and represents a large part of the apex. A normal LV geometry has been described as a prolate ellipsoid shape with the long-axis directed from the apex to the base (12). When the heart is viewed from the anterior, most of the LV is hidden by the RV, and the LV outflow tract (LVOT) overlaps its inflow tract. The LV is essentially divided into inlet and outlet tracts, which are separated by the anterior leaflet of the mitral valve. The hallmark of the LV inflow tract is the mitral (bicuspid) valve apparatus, which consists of the annulus fibrosus, the mitral valve itself, the chordate tendinae and the papillary muscles. The outlet portion of the LV, also called the aortic vestibule or subaortic area, is a narrow cavity in which the interventricular septum forms the anterior wall, and the anterior cusp of the mitral valve forms the posterior wall and the aortic valve orifice. The apical portion contains fine trabeculations. The curved LV septum bulges into the RV cavity. The larger part of the LV has a muscular component, whereas the upper part is thin and consists of fibrous tissue (the so-called membranous ventricular septum or septum membranaceum) that is situated just beneath the aortic valve. After an individual reaches 60 years of age, the basal part of the muscular septum increases in size, giving it a sigmoid appearance that mimics HCM on echocardiography (13-15). Normally, the LV wall thins at the apex and gradually thickens toward its base. Even in hypertrophied ventricles, the myocardium is only 1–2 mm thick at its tip. The heart wall consists of a thin subepicardial layer and a thicker trabeculated subendocardial layer at a ratio of approximately 1:2. The papillary muscles supporting the mitral valve are essential structural components of the LV wall. In the parasternal short-axis
10
view, two distinct portions of papillary muscles are visible and are named, according to their positions, the anterolateral and posteromedial groups. The anterior muscular band is slightly larger than the posterior one, and each pillar consists of a major trunk with one or multiple heads from which chordae tendinae extend.
The apical and basal parts of the LV rotate in two opposite directions. The band in the subendocardium is a right-handed or counterclockwise helix that descends from the basal loop to the apex, while the band in the subendocardium is a left-handed or clockwise helix that ascends from the apex to the basal loop. The helix angle changes continuously from the subendocardium to the subepicardium and varies by 60 degrees. The initial contractile motion of the basal loop causes a stiffer shell muscle to form, constricting the LV. This motion causes the isovolumic phase of systole. The next motion is the contraction of the descending band, which leads to clockwise and counterclockwise twisting extending downward from the base to the apex. This torsion causes the myocardial fibers to shorten and thicken, resulting in ejection. Shortly after the activation of the inner band, the ascending loop starts contracting, and this phase lasts beyond the contraction of the descending loop. This results in twisting and thickening motions that occur in opposite directions, partially contributing to ejection. When the contraction of the descending bands stops, the contracting ascending band becomes more longitudinal, lengthening the LV and creating an avenue for suction. The last motion is a response that allows LV filling during the remaining part of diastole.
In summary, during the abovementioned complex myocardial mechanics, two major deformation directions are initiated: shortening along the long axis of the chamber (longitudinal deformation) and shortening of the myofibers along the short axis (circumferential deformation). These two mechanics result in radial thickening and subsequent ejection. Different deformation directions can be quantified by measuring myocardial strain. Strain indicates the deviation of a certain myocardial segment from its original length throughout the cardiac cycle and is measured as a percentage (16, 17). At the preclinical level, strain is considered the most sensitive parameter for identifying myocardial disease in numerous cardiac diseases. It has proven value for finding early signs and predicting outcomes in some conditions, such as ischemic heart disease, heart failure,
11
non-ischemic cardiomyopathies and arterial hypertension (18). In sports cardiology, strain is a parameter that is used to quantify LV systolic function and differentiate physiological, exercise-induced remodeling from asymptomatic HCM or hypertrophy induced by chronic arterial hypertension (18, 19). Longitudinal and circumferential shortenings are the main contributors to myocardial performance and ejection fraction (EF). Global longitudinal strain (GLS) is defined as the average peak regional systolic strain measured in all LV segments from the apical view (20). It is considered the most sensitive and accurate measurement and has important prognostic implications.
2.1.2 Right ventricle
The importance of RV function was first described in 1616 by Sir William Harvey in his thesis, De Motu Cordis: “Thus, the RV may be said to be made for the sake of transmitting blood through the lungs, not for nourishing them” (21, 22).
Under normal physiological conditions, the RV is the most anteriorly situated heart chamber. It is positioned directly behind the sternum and wraps around the LV. In contrast to the cone-shaped LV, the RV has a triangular or semilunar shape, depending on the projection (lateral or vertical) being observed. Its sharp right edge forms the acute margin of the heart. Because it has thin walls and a crescentic shape, the RV is more compliant and better able to adjust to augmentations in volume and pressure. The RV has a greater end- diastolic volume than does the LV. Thus, assuming similar stroke volumes, the RV EF is somewhat lower than that of the LV. The RV sections are separated into those with anterior, inferior and lateral walls as well as basal, mid, and apical sections (23).
Morphologically, RV includes three components (1) the inlet: tricuspid valve, chordae tendineae, and papillary muscles; (2) the heavily trabeculated myocardium of the apex; and (3) the outlet or the RV outflow tract (RVOT) (24). The anatomical features of the RV are the following: 1) the presence of prominent trabeculations and muscular bands (the parietal, septomarginal and moderator bands), 2) the trileaflet configuration of the atrioventricular valve with the septal attachment of the papillary muscles, 3) more than 3 layers of papillary
12
muscles, and 4) a more apically positioned tricuspid valve (25). Two layers of RV myocardium are present. In the subepicardial layer of the RV, the myocytes are oriented predominantly circumferentially and parallel to the atrioventricular groove. In contrast, the subendocardial muscle fibers of the RV are predominantly arranged longitudinally (these longitudinal fibers are found in the endocardial layer, while oblique fibers in the superficial layer) (26). Echocardiography reveals that there are dissimilarities between LV and RV wall thickness. The RV has a relatively thinner wall (3-4 mm) as it supports low-pressure pulmonary circulation. Conversely, the LV wall is thicker (6-11 mm) and is responsible for providing the systemic blood supply (27).
There are three main mechanisms contributing to RV systolic function: 1) inward movement of RV free wall (“bellows effect”) 2) longitudinal shortening of RV with traction of tricuspid annulus towards the apex 3) bulging of the interventricular septum towards the RV cavity secondary to LV contraction (28, 29). The RV contracts in a
“peristaltic” pattern that proceeds from the sinus, where fibers are predominantly oriented obliquely and have an average major radius of curvature of nearly 4 cm, to the infundibulum, where the fibers are circumconal and have a small radius of curvature of 0.8 cm (30, 31). During the isovolumic contraction phase, the subepicardial myocytes of the inflow tract displace the RV circumferentially. The subendocardial fibers are responsible for the longitudinal contraction of the RV during the ejection phase. Traditionally, this longitudinal contraction is considered a major contributor to RV performance. The circumferential contraction of the outflow tract is crucial to the maintenance of high tension during systole, which results in infundibular subvalvular support of the pulmonary valve unidirectional function. The interventricular septum also supports LV and RV functions.
These twists and rotations do not substantially contribute to RV pump functions (32, 33).
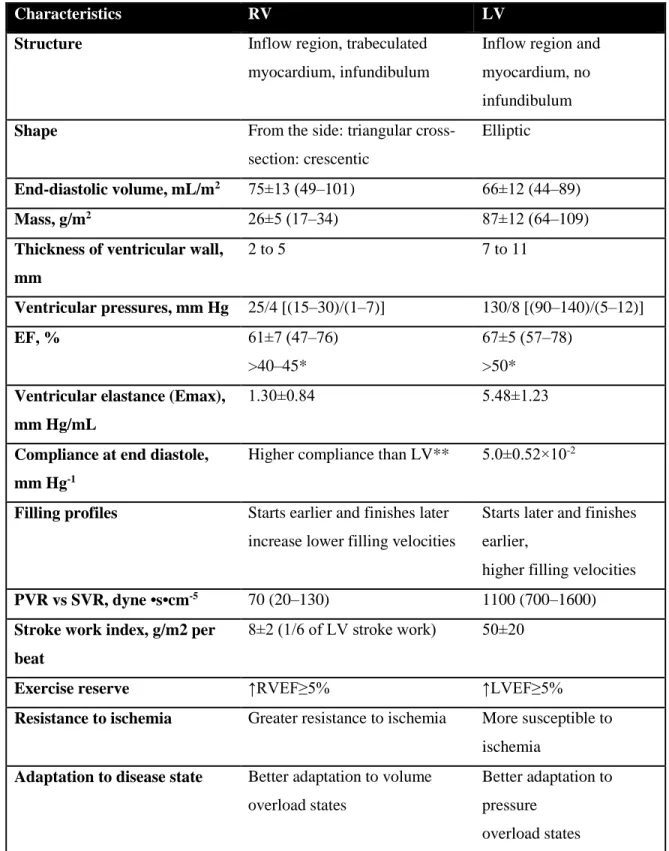
An overview of the differences between LV and RV structures and functions is represented in Table 1.
13
Table 1. Comparison of Normal RV and LV Structure and Function (adapted based on Haddad et al) (22).
Characteristics RV LV
Structure Inflow region, trabeculated myocardium, infundibulum
Inflow region and myocardium, no infundibulum Shape From the side: triangular cross-
section: crescentic
Elliptic
End-diastolic volume, mL/m2 75±13 (49–101) 66±12 (44–89)
Mass, g/m2 26±5 (17–34) 87±12 (64–109)
Thickness of ventricular wall, mm
2 to 5 7 to 11
Ventricular pressures, mm Hg 25/4 [(15–30)/(1–7)] 130/8 [(90–140)/(5–12)]
EF, % 61±7 (47–76)
>40–45*
67±5 (57–78)
>50*
Ventricular elastance (Emax), mm Hg/mL
1.30±0.84 5.48±1.23
Compliance at end diastole, mm Hg-1
Higher compliance than LV** 5.0±0.52×10⁻²
Filling profiles Starts earlier and finishes later increase lower filling velocities
Starts later and finishes earlier,
higher filling velocities PVR vs SVR, dyne •s•cm-5 70 (20–130) 1100 (700–1600) Stroke work index, g/m2 per
beat
8±2 (1/6 of LV stroke work) 50±20
Exercise reserve ↑RVEF≥5% ↑LVEF≥5%
Resistance to ischemia Greater resistance to ischemia More susceptible to ischemia
Adaptation to disease state Better adaptation to volume overload states
Better adaptation to pressure
overload states
14
PVR - pulmonary vascular resistance; SVR - systemic vascular resistance; *- Lower range of normal RV function used in clinical practice; lower value of normal described with radionuclide angiography; **- Based on sarcomere length–pressure curve relationship, limited data on end- diastolic passive compliance in humans; ↑-increase.
2.2 The impact of intense exercise of strength or endurance types of training:
Morganroth theory.
Since the 20th century, sports have broadly been categorized into three groups based on the intensity and type of exercise they require: dynamic (aerobic, isotonic), static (anaerobic, isometric) and combined (34, 35). The terms “dynamic” and “static exersice” are based on the mechanical action of muscles and are the most commonly applied in clinical practice.
According to the muscle metabolism type, the terms “aerobic” and “anaerobic” are used by specialists. The 3rd, so-called “combined type of exercise” group refers to the types of sports (such as football, basketball), where both aerobic and anaerobic activity is present.
Some of high resistance dynamic types of exercise (e.g., throwing (field events)), resistance band exercises, gymnastics) are classified as high-intensity static exercise due to the excessive cardiovascular demands.
Basically, aerobic exercise (e.g., kickboxing, walking, hiking, and aquaerobics) increases the heart rate (HR) and the oxygen supply to muscle tissues to sustain a certain level of training, resulting in increased cardiac output. In contrast, anaerobic exercise is the high- intensity exercise performed during short exertion sports (e.g., weightlifting and bodybuilding), which results in a high blood pressure load. Aerobic exercise can turn into anaerobic exercise when the work load is too high for a certain individual. However, several types of exercises considered to be isotonic (e.g., sprinting, cycling, and jumping) are performed primarily anaerobically (36).
15
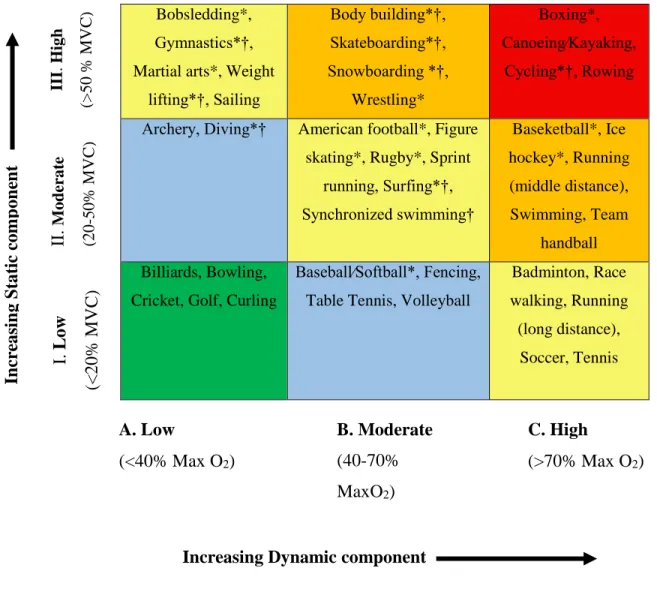
Table 2. Classification of sports (adapted based on Mitcel et al) (36).
Bobsledding*, Gymnastics*†, Martial arts*, Weight
lifting*†, Sailing
Body building*†, Skateboarding*†, Snowboarding *†,
Wrestling*
Boxing*, Canoeing∕Kayaking,
Cycling*†, Rowing
Archery, Diving*† American football*, Figure skating*, Rugby*, Sprint
running, Surfing*†, Synchronized swimming†
Baseketball*, Ice hockey*, Running (middle distance), Swimming, Team
handball Billiards, Bowling,
Cricket, Golf, Curling
Baseball∕Softball*, Fencing, Table Tennis, Volleyball
Badminton, Race walking, Running (long distance),
Soccer, Tennis
This classification is based on the peak static and dynamic components achieved during competition. The intensity of exercise is indicated by color: Green indicates the types of sports with the lowest total cardiovascular demand (cardiac output and blood pressure), while those with the highest are shown in red. Blue, yellow, and orange indicate those with low-moderate, moderate, and high-moderate total cardiovascular demand. MaxO2 indicates the maximum oxygen uptake, and MVC indicates the maximal voluntary contraction. * Danger of collision, † Increased risk in the presence of syncope.
II.Moderate (20-50% MVC)
A. Low
(<40% Max O2)
B. Moderate (40-70%
MaxO2)
C. High
(>70% Max O2)
Increasing Dynamic component
Increasing Static component I. Low (<20% MVC)
III. High (>50 % MVC)
16
Physiological changes in cardiac morphology and function occur if an athlete trains over 10 hours per week, and their development depends on the type of exercise (37). Endurance exercise results in eccentric cardiac remodeling during which cardiac adaptations are induced by a high “volume” load: increased ventricular volumes, moderate wall thickening, and a low resting HR. In strength-trained athletes, the cardiac phenotype is determined by the increased “pressure” load and results in concentric remodeling: increased wall thickness, relatively small ventricular volumes and a minimally changed HR. This notion was initially presented in 1975 by Morganroth et al. and subsequently called the
“Morganroth hypothesis” (38). This hypothesis is largely accepted and is currently used in sports cardiology. However, the theory has also been extensively criticized due to its oversimplification of the processes it describes and because its supporting data have become more controversial with progress in imaging modalities (e.g., echocardiography and cardiac resonance imaging, CMR). Some authors have provided questionable data about the inability of resistance athletes to have concentric remodeling. Resistance-trained athletes often perform a Valsalva maneuver that equalizes transmural pressures and afterload during exertion (39). A longitudinal study performed in football athletes at an American college confirmed the Morganroth hypothesis by showing that resistance-trained athletes exhibit concentric heart remodeling in response to prolonged athletic performance (40).
2.3 Cardiac adaptation to intense exercise
2.3.1 Left ventricular adaptation to intense exercise.
A large body of literature is devoted to the LV adaptations that occur in response to intense training. Regular intense exercise is traditionally associated with an enlargement in LV dimensions and mass compared to the parameters observed in sedentary controls.
Physiological sport-induced LV hypertrophy (LVH) is largely determined by demographic
17
factors: age, ethnicity, sex, body size, and type of sport discipline. Black athletes represent a large proportion of the athletes competing at the national level in the U.S. and United Kingdom. In black athletes, if LVWT ≤15 mm in an individual with an absence of cardiac symptoms and no family history of HCM, LVH is considered to be in the normal range, and no further investigation is needed (41). Although several studies have reported LVH of up to 19 mm in some ultra-endurance athletes, a maximal LVWT >16 mm can indicate pathology, and in these cases, HCM should be suspected (42, 43). In a study of 700 adolescent (16 years old) British endurance athletes, LVWT did not exceed 11 mm (44).
Subsequent studies performed in a large cohort of highly trained athletes have shown that only a small percentage of these athletes present an LVWT of more than 12 mm. A recent study that included 3500 intensively trained British athletes showed in that 1.5% of the athletes exhibited an LVWT >12 mm (45).
Figure 1. Diagram showing the distribution of LVWT in 3500 highly trained athletes. The results indicate that ⁓2% of the athletes exhibited a LVWT >12 mm (45).
The type of exercise and body surface area (BSA) are two essential determinants of LVH in athletes. Athletes performing ultra-endurance combined types of sport (e.g., cycling,
0 5 10 15 20 25 30 35
7 8 9 10 11 12 13 14 15 16
%
Left ventricular wall thickness (LVWT) (mm)
Athletes with LVWT>12mm (n=53, 1.5 %)
18
swimming, canoeing and ultra-endurance running) exhibit the greatest increases in LVWT.
Conversely, there is the generally accepted concept that athletes performing pure isometric sports, such as weightlifting and wrestling, rarely exhibit an LVWT >12 mm. A BSA>2.0 m2 increases the probability of identifying LVH (46, 47). The LV and RV response to intense endurance exercise varies: the LV primarily presents with concentric hypertrophy during the first 6 to 9 months after the initiation of endurance training, with the degree depending on the intensity and duration of the exercise. Subsequently, LV dilation occurs, resulting in eccentric remodeling. In contrast, the RV presents with eccentric remodeling at all levels of training (48). LVH and a lower HR are characteristically observed in young and adult athletes, but they are less marked in older athletes (49).
2.3.2 Right ventricular adaptation to intense exercise. Right ventricular exercise- induced dysfunction.
Intensive exercise results in RV enlargement and wall thickening. However, more significant changes are promoted by endurance exercise than strength training (50). This
"physiologic phenomenon" should be taken into consideration when evaluating athletes for sports eligibility (50). Regarding the RV, an athlete’s heart phenotype mainly develops after two years of regular physical training (49). Similar to the LV, racial differences are also observed in the RV. In a study of athletes in the Scandinavian football league, athletes with an African ancestry had significantly more concentric remodeling in the RV than was observed in the Caucasian athletes (51). In some athletes, the RV undergoes structural and electrical remodeling that may create a substrate for life-threatening arrhythmias, although SCD remains a rare event in young athletes (52). Intense exercise increases RV wall stress, and the RV is disproportionately affected (53). The increases in pulmonary artery pressures caused by intense training can be higher than the contractile reserve of the RV, an effect that can result in reduced cardiac output and exercise intolerance (54). Due to the lack of elasticity of the pulmonary artery and the reduced ability of the pulmonary circulation to dilate, RV afterload can become considerably augmented. In rodents, intense endurance
19
training can result in fibrosis of the RV myocardium (55). In humans, research performed in veteran endurance athletes confirmed the results of animal-model studies and demonstrated the presence of myocardial fibrosis in veteran competitive endurance athletes (>50 years old) (56). Research has also demonstrated that myocardial damage and a significant depletion in RV function are observed after intensive bouts of ultra-endurance training. Almost all such abnormalities resolve within 1 week (57). In humans, RVEF but not LVEF was lower in athletes with complex ventricular arrhythmias than in healthy athletes and sedentary volunteers without arrhythmias. During a short duration of maximal exercise, the RV experiences greater hemodynamic stress than does the LV, resulting in transient RV injury with possible long-term structural consequences (53, 58). Acute RV dysfunction with impaired RV systolic function was registered immediately after a prolonged endurance race. Regional differences in RV longitudinal function have been detected: while RV apical wall strain increased, RV basal wall strain did not significantly decrease during the season (59). This phenomenon can possibly be explained by the sequential activation of the RV myocardium and the influence of moderator band contraction on the wall motions of the apical and basal free walls. The irreversible RV structural and functional changes that occur as a consequence of long-term intensive endurance exercise training are now called “exercise-induced RV dysfunction” (60-62).
Kirchhof et al. were the first to suggest that exercise could modify the expression of AC in mice with a heterozygous deficiency in plakoglobin. In “athlete” mice, early functional changes resulted in RV dysfunction and arrhythmias (63). These findings were further supported by studies performed in human populations. The initial such investigation is described in Sen-Chowdhry et al., who registered that RV volumes were higher and RV function was lower in 11 endurance athletes than in a larger group of sedentary volunteers, and the reported diagnosis in these athletes was AC (64). These observations were confirmed in further studies in which athletes were at a higher risk of meeting the Task Force diagnostic criteria for AC (65, 66). The “threshold theory” of phenotypic expression was first proposed in 2003 before there was any clear evidence of a correlation between intense exercise and the AC-like phenotype (67). Although it remains controversial, The
“Heidbuchel syndrome” theory of exercise-induced AC was supported by the ‘marathon
20
rat’ studies (55). Further investigations conducted among professional cyclists who presented with palpitations showed that these athletes showed clinical evidence of RV arrhythmias and mild RV dysfunction, although in the vast majority of cases there was no family history of AC (68).
Figure 2. Threshold for phenotypic expression for AC as a spectrum of genetic and environmental risk (adapted based on La Gerche et al) (69).
The present diagram (Figure 2) demonstrates the interdependence of genetic and environmental factors (e.g., exercise), which combine to reach a threshold at which the AC phenotype is expressed.
A vast genetic risk can cause clinical AC with little aggravation from exercise. However, a low genetic risk may require a significant additional contribution from exercise stress to trigger AC. It remains controversial whether extreme exercise can cause an AC phenotype when there is little or no genetic risk.
Genetic risk Enviromental
(exercise)risk
?
Phenotypic expression
21
Further investigation is needed to explore the interconnection between intense exercise (as an environmental risk factor) and AC development (as a genetic risk factor) or to determine whether any other factors (e.g., dietary, lifestyle, or co-morbidities) may influence AC disease expression. Further studies aimed at finding other causes of SCD (e.g., channelopathies) is also required. Although the use of ICDs in clinical practice can prevent the development of exercise-triggered arrhythmias, we are now entering a world in which we will need to establish the effect of exercise on the disease substrate for each of these conditions (69).
Investigations of the RV in endurance athletes are justified by the need for a more complete understanding of athletic physiology and the clinical need for better risk stratification of athletes who present with any symptoms or arrhythmias.
2.4 Female athlete’s heart
Despite the large amount of data available about male athlete’s heart, female athlete’s heart has rarely been investigated in the literature. Research has shown that long-term endurance training induced very similar bi-ventricular remodeling in male and female athletes.
Independent of training load, however, RV size was larger and bi-ventricular resting function was lower in males (70). Female athletes have lower LV mass (LVM) than male sportsmen (71). There was a significant difference between the two aforementioned groups in LVMi (left ventricular mass index), indicating that gender differences in LVM are not be explained by the fact that body size is different between males and females. One possible mechanism for this finding is that the increase in absolute blood pressure with peak exercise is smaller in female athletes (72, 73). Additionally, estimated mean arterial blood pressure values are also lower in female than in male athletes (71). It has been suggested that androgenic hormone levels and genetic factors may play a role in the sex-related difference observed in athletes. Testosterone and estrogen-sensitive receptors are present in myocytes, but as myocardial mass increased, their protective effects against cardiac hypertrophy were diminished (74). However, the upper limits of LVWT did not exceed 11
22
mm in female athletes (44, 71, 75). The largest LVWT reported was 12 mm among 1000 female Italian athletes (76). When LVWT is greater than 12 in a female athlete, there is a high probability that HCM will be diagnosed. Endurance-trained female athletes had lower LV SV than were observed in male athletes. This can be explained by the fact that female athletes tend to have smaller body mass and smaller LV end-diastolic volumes (EDV) and therefore smaller SV. (44, 47, 76). SV was lower in females than in male controls, but there was no difference body mass relative to gender (77). Some racial differences are associated with female athlete’s heart. In Western countries, black female athletes form an increasing proportion of world class international competitors. In black female athletes, intensive physical exercise promotes higher LVH values and repolarization changes than are observed in age-matched and similar body size white female athletes competing in a similar sport. However, a maximal LVWT >13 mm or deep T-wave inversions in the inferior and lateral leads are rarely presented and require further investigation (78). Insulin- like growth factor (IGF) is considered an essential regulator of cell proliferation. Recent research has indicated that IGF mediates physiological LVH. The presence of race-related polymorphisms that affect IGF1 function within the African population may explain the greater prevalence of LVH in black athletes (79).
Generally, atrial volumes are significantly larger in athletes. However, only a small difference was found between female controls and female athletes, suggesting that atrial adjustment to training is more modest in women than in men (80).
2.5 Basic principles and importance in SCD of athletes
SCD is one of the most important causes of death worldwide. This disorder accounts for 5% to 10% of all sudden deaths resulting from unexplained reasons in individuals >65 years of age. It occurs in young adults and has a male to female ratio of 2.7:1. SCD accounts for an estimated 450,000 deaths or 15% of all annual deaths in the United States (81). Athletes are at greater risk of SCD than are their non-athletic matched groups due to the increased risks associated with vigorous exercise (8). When SCD occurs in an athlete, it
23
is viewed as a rare but dramatic tragedy and will generate significant media attention and discussion among medical specialists, sports communities, and laypersons alike. The incidence of SCD is higher in males than in females. The data provided for high school and college athletes indicates that the incidence of SCD is 5-fold higher in male than in female athletes (82). SCD appears to be more common in African (black) athletes, with a reported incidence rate of 5.6/100,000 per year in the U. S. (83).
2.5.1 Etiology of SCD in athletes
The most common causes of exercise-related SCD in young (<35 years old) athletes are cardiomyopathies, such as ARVC and HCM (9). Black athletes exhibit higher death rates from HCM than their white counterparts (20% vs. 10%, respectively) based on the U.S.
autopsy data (84). In older athletes (>35 years old), in 80% of cases SCD occurs due to coronary artery disease. The basic causes of SCD in young athletes are presented in Fig. 3.
24
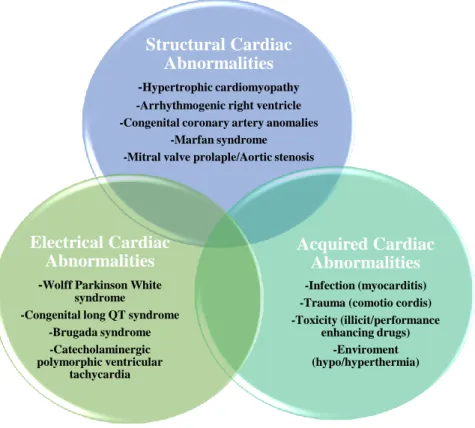
Figure 3. Groups of causes of SCD in Young Athletes (adapted based on Chandra N.
et al) (8, 85). The common causes of SCD in young athletes can be divided into structural, electrical, and acquired cardiac abnormalities. In the top circle the most frequently observed causes are depicted.
Sudden death occurs more frequently in certain types of sports. In the U. S. basketball and football have the largest prevalence, whereas in Europe, soccer predominates (86).
Structural Cardiac Abnormalities
-Hypertrophic cardiomyopathy -Arrhythmogenic right ventricle -Congenital coronary artery anomalies
-Marfan syndrome -Mitral valve prolaple/Aortic stenosis
Acquired Cardiac Abnormalities
-Infection (myocarditis) -Trauma (comotio cordis) -Toxicity (illicit/performance
enhancing drugs) -Enviroment (hypo/hyperthermia)
Electrical Cardiac Abnormalities
-Wolff Parkinson White syndrome
-Congenital long QT syndrome -Brugada syndrome -Catecholaminergic polymorphic ventricular
tachycardia
25 2.6 Hypertrophic cardiomyopathy
HCM is a primary myocardial disease with an autosomal dominant pattern of inheritance. It is characterized by LVH in the absence of another functional or structural cardiac abnormality (87). The reported prevalence of HCM is 0.2% in the general population and 0.07% to 0.08% in athletes (88). It is a genetic cardiac disorder caused by mutations in one of twelve sarcomeric genes.
The modern view of HCM was first introduced by Teare in 1958, who described it as an asymmetric hypertrophy in young adults (89). The generally accepted definition of HCM is a disease state characterized by unexplained LVH associated with nondilated ventricular chambers in the absence of another cardiac or systemic disease that itself would cause myocardial hypertrophy. The crucial role in diagnosis is played by echocardiographic examination where maximal LVWT≥15 mm (LVWT of 13 to 14 mm referred as borderline), in the presence of family history (reported HCM in first-line relatives) (87).
The differential diagnosis between athlete’s heart and HCM represents a vital clinical dilemma because at least 10% of adolescent patients with HCM may be at high risk for SCD (90). Nowadays the therapeutic strategies available for SCD prevention are: the ICD, disqualification of athletes with HCM from intense competitive sports (91).
SCD is caused by ventricular tachyarrhythmias (ventricular tachycardia/ventricular fibrillation) and usually occur in the presence of ≥1 the major risk factors (appropriate ICD interventions of 4% per year in patients implanted for primary prevention). However, some of patients (0.6% per year in non-ICD populations) with diagnosis of HCM may inexpectedly die in the absence of all conventional risk factors. Late gadolinium enhancement on CMR helps to determine scar tissue as a potential substrate of fatal arrhythmias (92, 93). A risk-stratification algorithm has been largely effective in identifying patients at highest risk who are eligible for primary prevention of sudden death with an ICD, thereby markedly reducing HCM-related mortality to 0.5% per year (94).
26 2.7 Arrhythmogenic cardiomyopathy
AC is a chronic, progressive, heritable myocardial disorder and is one of the leading causes of SCD in young, apparently healthy individuals (95). Three subtypes have been proposed:
right-dominant – generally referred to as AC,
biventricular forms with early biventricular involvement
left-dominant with predominant LV involvement.
First clinical signs reveal during adolescence and are exercise-related. They include (pre)syncope, dyspnea, palpitations, arrhythmic (pre)syncope and sudden cardiac arrest due to ventricular arrhythmias, which is typical for athletes. At later stages, heart failure may develop (96).
AC is a poorly understood and often underdiagnosed disorder of the RV. AC classified as 1 of the 5 primary cardiomyopathies in 1995. The prevalence of AC was estimated to be 1 in 5000 people and to account for up to 20% of all SCDs in people younger than 35 years old.
(97, 98). In a series of 86 cases of sudden death, AC was identified in 10.3% of the cases and found to be the second leading cause of SCD. AC can occur in both sexes at any age, but sudden deaths tend to occur in adults between 15 and 45 years old (mean age, approximately 30 years old) (99, 100). The strongest predictor of SCD during exertion is AC. Athletes with AC are 6 times more likely to die during exertion than are those with other cardiac pathologies (92% of SCD experienced on the athletic field) (101). In recent years, great advances have been made in the understanding of the pathogenesis of AC. The exact pathogenesis of AC is still unclear, but this involves a genetic factor: approximately 50% of patients with AC have one or more mutations in genes that encode desmosomal proteins (desmoglein-2, desmocollin-2, plakoglobin, plakophilin and desmoplakin). AC is considered to be “a disease of the desmosome” (102, 103). Currently, the genetic mutations known to be associated with AC include those in PG, PKP2, DSP, DSC2, DSG2, TGFb3, TMEM43, RYR2, TTN, and JUP (104).
27
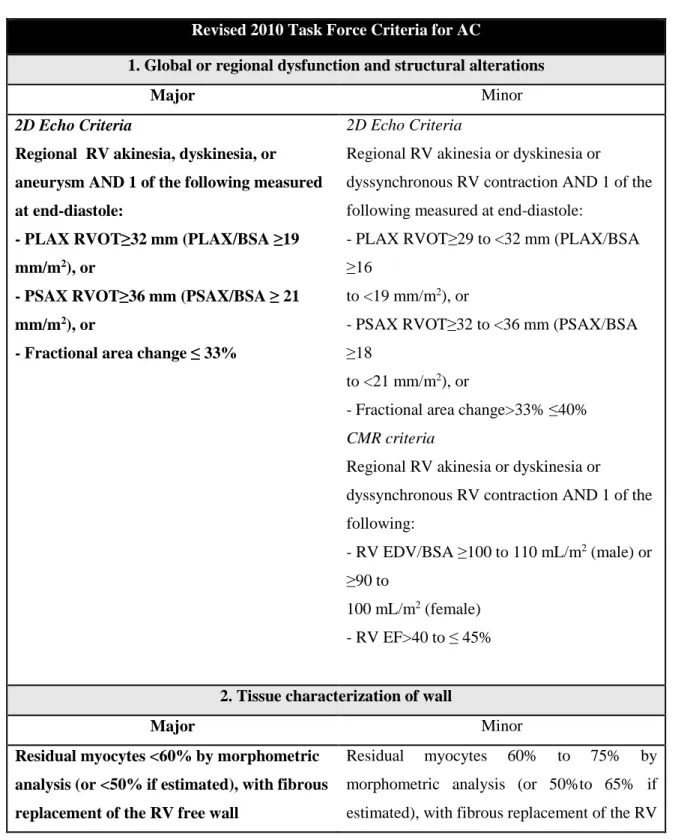
Table 3. Revised 2010 Task Force Criteria for AC (adapted based on Marcus F.) (105).
Revised 2010 Task Force Criteria for AC
1. Global or regional dysfunction and structural alterations
Major Minor
2D Echo Criteria
Regional RV akinesia, dyskinesia, or aneurysm AND 1 of the following measured at end-diastole:
- PLAX RVOT≥32 mm (PLAX/BSA ≥19 mm/m2), or
- PSAX RVOT≥36 mm (PSAX/BSA ≥ 21 mm/m2), or
- Fractional area change ≤ 33%
2D Echo Criteria
Regional RV akinesia or dyskinesia or
dyssynchronous RV contraction AND 1 of the following measured at end-diastole:
- PLAX RVOT≥29 to <32 mm (PLAX/BSA
≥16
to <19 mm/m2), or
- PSAX RVOT≥32 to <36 mm (PSAX/BSA
≥18
to <21 mm/m2), or
- Fractional area change>33% ≤40%
CMR criteria
Regional RV akinesia or dyskinesia or
dyssynchronous RV contraction AND 1 of the following:
- RV EDV/BSA ≥100 to 110 mL/m2 (male) or
≥90 to
100 mL/m2 (female) - RV EF>40 to ≤ 45%
2. Tissue characterization of wall
Major Minor
Residual myocytes <60% by morphometric analysis (or <50% if estimated), with fibrous replacement of the RV free wall
Residual myocytes 60% to 75% by morphometric analysis (or 50%to 65% if estimated), with fibrous replacement of the RV
28 myocardium in ≥1 sample, with or without fatty replacement of tissue on
endomyocardial biopsy
free wall myocardium in ≥1 sample with or without fatty replacement of tissue on endomyocardial biopsy
3. Repolarization abnormalities
Major Minor
Inverted T waves in right precordial leads (V1, V2, and V3) or beyond in individuals
>14 years of age (in the absence of complete RBBB QRS ≥120 ms)
Inverted T waves in V1 and V2 in individuals
>14 years of age (in the absence of complete RBBB) or in V4, V5, and V6
Inverted T waves in leads V1, V2, V3, and V4 in individuals >14 years of age in the presence of a complete RBBB
4. Depolarization/conduction abnormalities
Major Minor
Epsilon wave (reproducible low-amplitude signals between end of QRS complex to onset of T wave) in the right precordial leads (V1 - V3)
Late potentials by SAECG in ≥1 of 3
parameters in the absence of a QRSd of ≥110 msec on standard ECG:
- Filtered QRS duration (fQRS)≥114 msec - Duration of terminal QRS<40 microV≥ 38 ms
- Root-mean-square voltage of terminal 40 ms≤20 micro V
Terminal activation duration≥55 ms measured from the nadir of the S-wave until the end of all depolarization deflections (including R') inV1, V2, or V3
5. Arrhythmias
Major Minor
Nonsustained or sustained VT of LBBB morphology with superior axis
Nonsustained or sustained VT of RVOT configuration, LBBB morphology with inferior axis or of unknown axis>500 PVCs per 24 hours on Holter monitoring
29
6. Family History
Major Minor
AC in first degree relative who meets Task Force Criteria
AC confirmed pathologically at autopsy or surgery in first degree relative
Identification of pathogenic mutation categorized as associated or probably associated with AC in the patient under evaluation
History of AC in first degree relative in whom it is not possible to determine whether the family member meets Task Force Criteria Premature sudden death (<35 years of age) due to suspected AC in a first degree relative AC confirmed pathologically or by current Task Force Criteriain second-degree relative
The diagnosis of AC is based on a combination of major and minor criteria. To make a diagnosis of AC requires either 2 major criteria or 1 major and 2 minor criteria or 4 minor criteria.
The risk factors for SCD in AC are not as well-defined as those for HCM. Frequent endurance exercise increases the risk of ventricular tachycardia/ventricular fibrillation and heart failure. The most important prognostic markers are syncope, a prior history of SCD or sustained ventricular tachycardia, which define many high-risk patients who are most appropriate for treatment with the primary prevention, ICD (106).
30 2.8 Pre-participation screening
Pre-participation screening is the medical systematic practice of evaluating athletes before competition for abnormalities that could cause of SCD or disease progression. Adequate cardiac screening is able to prevent the majority of cardiac events in athletes. To prevent SCD, high-risk individuals are excluded from competitive sport. Two major screening programs are used in the world today: American and Italian. In the U.S., the mandatory screening protocol includes a family and personal history and a physical examination. In Italy, screening consists of a resting electrocardiogram to detect cardiac and rhythm abnormalities (107). The question of whether the U.S. or Italian screening protocol is the best for identifying athletes at risk is the subject of considerable debate. Data obtained in Italy have shown that the risk of adverse cardiac events was decreased by almost 90% in young competitive athletes after a questionnaire and physical examination were performed and a 12-lead resting ECG was applied as part of a routine screening protocol (108).
ECG is a non-invasive technique that allows the continuous monitoring of HR, enabling the detection of life-threatening arrhythmias. However, its cost-efficiency and feasibility have been an issue of debate. In the U.S., ECG was not included in the athlete screening protocol because it has a high rate of false-positive results and is not cost-effective (109). Even if ECG is considered the method of choice for diagnosing cardiomyopathies and ionic channel-related diseases, many asymptomatic cardiac abnormalities, such as mitral valve prolapse and bicuspid aortic valve, which are considered the most frequent congenital disorders in adults, could go unrecognized (107).
Recently, echocardiography has become a valuable addition to the protocols used to obtain diagnoses and prognoses and to monitor structural heart diseases. It permits the practitioner to characterize cardiac anatomy and ventricular function and visualize valvular structure and function. The advantages of echocardiography include its non-invasiveness, availability, relatively low cost, and myocardial responsiveness to potentially ischemic stimuli (stress-echo). Moreover, echocardiography enables the clinician to image myocardial perfusion along with wall motion and wall thickening (110). Unfortunately,
31
despite previous attempts to introduce echocardiography into the protocol for pre- participation screening of athletes, this technique has also been found to be cost-ineffective (109). However, introducing the use of an ECG during pre-competition screening could be reasonable because despite the fact that ECG is regarded as a sensitive method, ECG is the best method for diagnosing a range of cardiac pathologies. Moreover, the added value provided by novel, advanced ECG techniques, such as speckle tracking or 3D echocardiography, has not yet been evaluated.
2.9 Ultrasound
2.9.1 Basic principles and conventional parameters
M-mode: Although M-mode has been largely replaced by 2D echocardiography, it is still an important part of the echocardiographic study nowadays. It allowes the visualization of even the most thin or fast moving cardiac structures such heart valves or endocardium. In sports cardiology it can be applied in the evaluation of cardiac dimensions such as wall thickness, chamber size and subsequent estimation of ventricular function. A single beam in an ultrasound scan produces the one-dimensional M-mode picture, where movement of a certain structure (e.g., heart valve) can be depicted in a wave-like manner. That allows an unequalled high sample of rating of more than 2000 frames per second, compared to 2D echo where there are only 40-80 frames per second. This is linked to high special and temporal resolution.
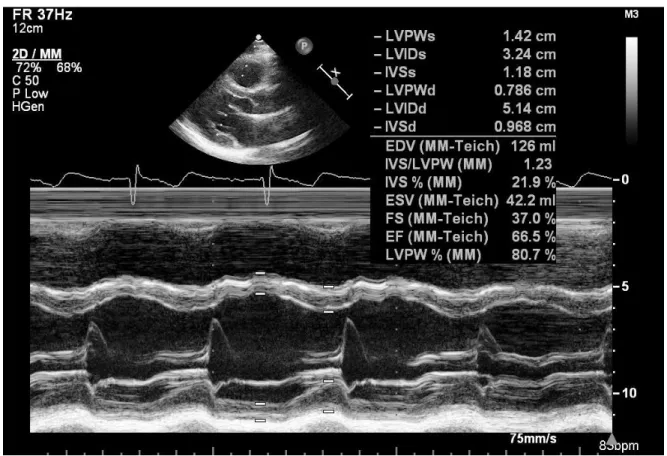
The initial attempts at the quantification of LV function were based on one-dimensional, M-mode linear measurements of the LV internal dimension in diastole and systole, using Teichholz method. This modality is no longer recommended for the estimation of the LV systolic function and volumes (111). General limitations remain: dependence on the image quality, nonperpendicular axes, poor definition of the borders. This should be taken into consideration during the interpretation of the measurements.
32
Figure 4. One-dimensional, M-mode linear measurements of the LV internal dimension in diastole and systole using Teichholz method. LV internal dimensions were measured in parasternal long axis view at the level of the LV minor axis, approximately at the level of the mitral valve leaflet tips.
The first and most commonly used echocardiographic method of LVM estimation is the linear method, which uses end-diastolic linear measurements of the interventricular septum (IVSd), LV inferolateral wall thickness, and LV internal diameter derived from M-mode orby 2D-guided M-mode approach. This method utilizes the Devereux and Reichek "cube"
formula, which assumes a prolate ellipsoid shape of the LV with a ratio of 1:2 minor- to major-axis (112).
33
The Devereux formula for calculation of LVM is in wide clinical use.The formula, usually stated as (113)
𝐿𝑉𝑀𝐴𝑆𝑆=0.8×(1.04[(𝐿𝑉𝐼𝐷𝑑+𝐿𝑉𝑃𝑊𝑑+𝐼𝑉𝑆𝑑)3− (𝐿𝑉𝐼𝐷𝑑)3])+0.6 g
LVIDd: LV internal diameter in end-diastole, LVPWd: LV posterior wall diameter in end- diastole, IVSd: interventricular septum in end-diastole.
However, any error in linear measurements can result in significant inaccuracies because all measurements are cubed in the LVM formula. This formula is also not accurate in asymmetric LVH, dilated cardiomyopathy, and other conditions with regional differences in LVWT (111). The major limitation of M-mode is its one dimensional nature such that only the structures transected by the M-mode cursor are displayed. Only the perpendicular orientation of the ultrasound beam to the structure of interest determines of the accuracy of the ultrasound study and the image quality. If the orientation of the beam to the structure of interest is not perpendicular, it will link to a slight deformation of the structure and incorrect measurements.
TAPSE (tricuspid annular plane systolic excursion) represents the distance of excursion of the lateral part of the tricuspid annulus towards the apex during systole. It is obtained in a four-chamber view, using an M-mode cursor passed through the tricuspid lateral annulus and measuring the amount of longitudinal displacement of the annulus at peak-systole.
Normal value is above 16 mm. Despite its simplicity and several limitations, TAPSE is a powerful measure of RV function and still widely used in clinical practice.
B-mode: 2D echo is the basis of the echocardiographic examination, representing the initial imaging mode by allowing the overall evaluation of structures of interest. And also, it is used to guide such imaging modes as M-mode or spectral Doppler. 2D echo provides real- time and relatively high-resolution tomographic views of the heart useful to obtain anatomical and functional information.
34
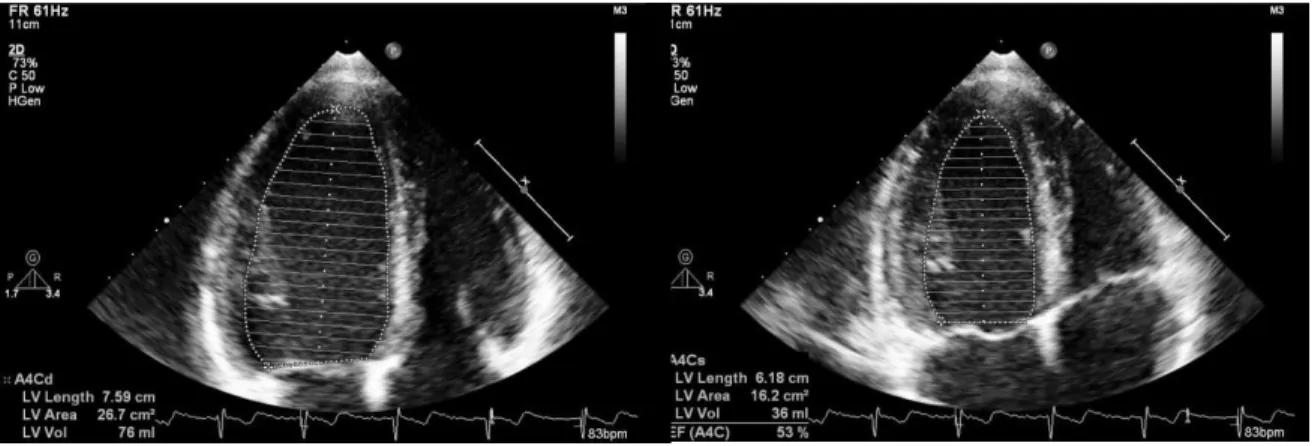
Measurement of LVEF. The most frequently used technique for LV volume estimation in 2D echocardiography is the biplane method of discs (modified Simpson`s rule). This methodology is based on the principle of calculation of total LV volume as the summation of a series of elliptical discs of equal height, equally spaced along the long axis of the LV (114). LV end-diastolic and end-systolic volumes (LVEDV and LVESV, respectively) are measured by contouring the LV endocardial surface on both apical four-chamber (A4C) and apical two-chamber (A2C) views.
Figure 5. Simpson`s method. The endocardium is traced in end-systole and end-diastole in A4C view.
The Modified Quinones Equation for the EF estimation is widely used in clinical echocardiographic routine:
EF (%)= (SV∕EDV)×100
The main limitations of this method are the foreshortening of the ventricular apex and the possible tangentially A2C view acquisition. The former may result in inaccurate assessment of the LVEF, and most frequently on its overestimation. Conversely, the tangentially A2C view acquisition causes underestimation of the true volume. The current gold standard method for LV volumes and function evaluation is CMR imaging (115). LV evaluation by
35
3DE appears to be the closest method regarding accuracy and reproducibility. (116, 117) LV volumes calculated by Simpson`s method tend to be smaller than those obtained by 3D full-volume echocardiography and CMR (118).
Most regularly, RV can be obtained from the A4C RV focused view and its size should be measured at end-diastole. If the RV is larger than the LV in this view, it is more likely to be severly enlarged (2). The following RV diameters need to be obtained:
the basal diameter-maximal short-axis diameter in the basal part of the RV.
the mid-cavity diameter– measured at the middle part of the RV halfway between basal diameter and RV apex.
The length – from the tricuspid annulus towards the RV apex (2).
The fractional area change (FAC) estimates RV function from the A4C view. It calculates the fraction of the end-diastolic and end-systolic RV area along the cardiac cycle. Normal value for RV FAC is above 35% (119).
RV FAC (%) = (RV EDA – RV ESA)/RV EDA x 100
36 2.9.2 2D deformation imaging
Speckle-tracking echocardiography is a special 2D non-Doppler technique, which measures myocardial deformation (120). It detects multiple unique patterns and natural acoustic reflections described as “speckles”. These can interfere with the ultrasound beam in the myocardium and be tracked throughout the cardiac cycle. Each region of the myocardium has a unique speckle pattern (like the fingerprint) that allows the region to be traced from frame to frame during the post processing analysis. This algorhythm provides quantitative analysis of the tissue motion and deformation (strains).
Strain is the percentage of change from original length of a distinct region of interest. Strain rate is defined as the rate of deformation (e.g., how fast the deformation occurs). The strain can be either Langrangian or natural. Lagrangian strain is defined as the as follows:
SL(t)= L−L0
𝐿𝑜 =∆L
Lo ,
where L(t) is the length at a given point in time and L0 is the reference length at the reference to t0, usually taken at end-diastole (121).
Natural strain is defined relative to previous time instance but not original length: (121)
SN(t)= 𝑙𝑛 (𝐿1
𝐿0)
2D strain based on speckle tracking is an emerging innovative method providing information about the functional status of all cardiac chambers (122). Three perpendicular axes orienting the global geometry of LV define the local cardiac coordinate system:
longitudinal, radial and circumferencial. Shortening and thickening can be quantified on segmental level or globally. Although GLS has been shown to be reproducible and accurate, 2D global circumferential strain (GCS) and 2D global radial strain (GRS) are less reliable, with measurement variability of >10% and 15%, respectively, which limits their
37
use in the evaluation of LV systolic function in clinical practice (123). The example of speckle-tracking technique is presented in Figure 6.
Figure 6. 2D speckle-tracking analysis for global longitudinal strain. The graphical representation (bull’s eye) of peak strain values in a 16-segment model of the LV. GLS is the average of all segments.
GLS has been proposed in numerous studies to be superior to LVEF for detecting subtle alterations in myocardial function and predicting cardiac events. Evidence also suggests its feasibility and usefulness for evaluating the RV. Because RV myofibers also run longitudinally, longitudinal shortening accounts for a major portion of RV systolic function and can also be quantified by speckle tracking echocardiography. Despite the fact that TAPSE also refers to longitudinal shortening, it represents only one aspect of complex RV functions and is strongly influenced by overall heart motions and loading conditions as well as technical challenges (124). Hence, 2D imaging is less capable of measuring the other two motion components of the RV.