Investigation of left ventricular mechanics in physiological and pathological hypertrophy
using speckle tracking echocardiography
Ph.D. Thesis
Attila Kovács M.D.
Semmelweis University
Doctoral School of Basic Medical Sciences
Supervisor: Béla Merkely M.D., Ph.D., D.Sc.
Official Reviewers: Réka Faludi M.D., Ph.D.
Gábor Kökény M.D., Ph.D.
Head of Final Examination Committee:
János Gál M.D., Ph.D.
Members of Final Examination Committee:
Zoltán Járai M.D., Ph.D.
Lívia Jánoskuti M.D., Ph.D.
Budapest
2015
- 1 -
INTRODUCTION
Left ventricular hypertrophy is a common, adaptive or maladaptive phenomenon caused by various genetic or environmental effects. Histological background of hypertrophy is defined by cellular enlargement without expansion in the cell number. Myocardial hypertrophy implies complex molecular, cellular, histological and global morphological alterations of the heart.
Diagnostic criteria of left ventricular hypertrophy are well known and it is easy to assess by electrocardiography or by cardiac imaging modalities (echocardiography, cardiac MRI). Beside its diagnosis and accurate quantification, however, the clinical significance cannot be overestimated. Left ventricular hypertrophy is an independent risk factor of heart failure, coronary artery disease, stroke, various arrhythmias, sudden cardiac death, as well as cardiovascular morbidity and mortality.
Nevertheless, physiological left ventricular hypertrophy also exists. Regular exercise induces a physiological and reversible increase in myocardial mass.
Beside the physiological aspects of athlete’s heart, it may represent differential diagnostical issue to distinguish from pathological hypertrophies.
Systolic contraction and diastolic relaxation are results of the complex deformation of the multiple helical myofiber architecture. Speckle tracking echocardiography allows to quantify the different directions of this deformation.
These novel parameters have established diagnostic and prognostic power and may help to better understand the functional consequences of the geometrical alterations induced by the physiological or pathological effects.
- 2 -
OBJECTIVES
Our studies involved two different left ventricular hypertrophies, which were investigated by different methodology as well.
Therefore, aims of our research were two-fold:
(1) to assess the supernormal diastolic function of athlete’s heart by quantifying myocardial mechanics and to define such parameters which are capable of distinguishing physiological and pathological left ventricular hypertrophies;
(2) to provide detailed characterization on left ventricular mechanics and to assess the acute effects of hemodialysis in patients with end- stage renal disease using three-dimensional speckle tracking echocardiography. We also sought to investigate the correlations between a potential cardiovascular biomarker (fibroblast growth factor – 23) and left ventricular hypertrophy and deformation.
- 3 -
METHODS
Investigation of diastolic mechanics in elite athletes
28 elite athletes (EA) in flatwater kayaking, canoeing or rowing were enrolled.
All sportsmen were examined in the in-season training phase of their preparation. 15 patients with hypertrophic cardiomyopathy and 13 healthy, sedentary volunteers as normal controls (NC) were also included. Exclusion criteria were: medical history or present symptoms of coronary heart disease, hypertension, diabetes mellitus, any other cardiomyopathy, significant valvular disease and any relevant form of cardiac arrhythmias.
After a standard transthoracic echocardiographic examination, parasternal short axis loops of three consecutive cardiac cycles were recorded (Philips iE33, S5-1 probe, Philips Healthcare, Best, The Netherlands) using optimal frame rate (72±6 frames per second) and adequate adjustment of focus position, depth and sector size. To measure the basal and apical rotation of the left ventricle, proper LV cross sections at the mitral valve level and at the apex (just proximal to the level, where systolic luminal obliteration could be observed) were obtained.
Subsequent 2D speckle tracking analysis of digitally saved ultrasound data was performed using the Philips QLab CMQ software (v8.1). As a result of the complex, helical structure of the myocardium, the base of the left ventricle rotates in clockwise, the apex in counterclockwise direction during contraction.
By convention, apical counterclockwise rotation resulted in positive, basal clockwise rotation in negative degrees (Figure 1). The net difference between these two motions is defined as twist. In order to correct for the differences in heart rates, timing of the LV twisting events were expressed as a percentage of
- 4 -
the duration of systole or diastole. Untwist and untwist rate values were calculated from the following formulas:
where „twistpeak” is the peak systolic twist occurring in „tpeak” time and „twistx” is the twist angle at a certain „tx” timepoint of the cardiac cycle. Timepoints of aortic valve closure (AVC), mitral valve opening (MVO) and peak E velocity were determined using pulsed wave Doppler recordings of mitral inflow and the LV outflow tract.
Figure 1. Assessment of apical and basal rotation by speckle tracking echocardiography. On the left, apical counterclockwise rotation (positive value) was measured on a parasternal short-axis view at the apical level, while on the right, clockwise rotation (negative value) was measured at the mitral valve level. The net difference between these two provides the value of twist.
For the accurate measurement of left ventricular function, hypertrophy and remodeling, gold standard cardiac MRI was also performed in all study subjects using a 1.5 Tesla system (Achieva, Philips Healthcare, Best, The Netherlands).
Left ventricular volumes, ejection fraction (EF), maximal end-diastolic wall
- 5 -
thickness (MWT) and mass were quantified using manual planimetry of end- diastolic and end-systolic short-axis cine images with MASS 7.1 analysis software (Magnetic Resonance Analytical Software System, Medis Medical Imaging Software, Leiden, The Netherlands).
For data administration and for statistical analysis we used STATISTICA v8.0 (StatSoft Inc., Tulsa, U.S.A.) software. Polynomial interpolation of corresponding rotation curves was done by Lagrange method. Normal distribution was assessed by Shapiro-Wilk test. Depending on normality, comparison among study groups was done either by one-way ANOVA followed by Tukey post-hoc test, or Kruskal-Wallis ANOVA followed by Mann-Whitney U test. Correlations were calculated using Spearman rank-correlation test. Data are presented as mean±SD and for non-normally distributed data as median (interquartile range). P values less than 0.05 were considered as statistically significant.
Investigation of uremic cardiomyopathy
In our cross-sectional study we enrolled forty-four prevalent chronic hemodialysis (HD) patients, who underwent maintenance hemodiafiltration treatment three times a week. All patients were asymptomatic and complaint- free prior to inclusion. Patients with a medical history of diabetes mellitus, known coronary artery disease, any form of cardiac arrhythmias, any cardiomyopathy or severe valvular disease diagnosed by echocardiography were not included.
To compare with end-stage renal disease (ESRD) patients, 44 healthy, sedentary volunteers were selected from our normal control (NC) database (anthropometric, blood pressure measurements and echocardiographic data are available).
- 6 -
Transthoracic echocardiography and 3D data analysis were performed by an experienced operator of the device and the software environment (GE Vivid E9 ultrasound system, 4V-D probe and EchoPAC v112 software, GE Healthcare, Horten, Norway). The echocardiographic protocol was carried out before and after the HD treatment. Special care was taken to perform the echocardiography immediately after the end of the patient’s regular dialysis session. ECG-gated subvolumes from six consecutive cardiac cycles were recorded from apical approach at end-exspiratory breath-hold for multi-beat reconstruction of the entire LV. Imaging was optimized for the LV by adequate settings of gain, focus position, sector width and also depth to achieve optimal volume rate (32±4 vps).
To measure LV volumes, ejection fraction (EF) and mass, and to perform the 3D speckle tracking analysis a dedicated software was used (4D Auto LVQ, GE Healthcare, Horten, Norway). At speckle tracking analysis, acceptance or rejection of LV segments were guided by the software’s recommendations.
After careful assessment of the segmental strain curves by the operator, patients who had more than 3 rejected segments were excluded from the study. We defined global longitudinal (GLS), circumferential (GCS), area (GAS) and radial strain (GRS) as the average peak systolic strain value of the 17 LV segments for the corresponding deformation parameters (Figure 2). Three patients were excluded due to inadequate 3D image quality, and further 5 patients because their speckle tracking analysis did not fulfill the technical criteria. Forty-four patients were eligible to be included in the statistical analysis.
- 7 -
Figure 2. Representative 3D speckle tracking analysis. Using the standard model of the left ventricle, the software calculates the segmental strain values in every available timepoint of the cardiac cycle. In this particular case, global area strain is calculated by averaging the 17 segmental peak systolic values.
Serum FGF-23 levels (Merck Millipore enzyme-linked immunosorbent assay) and standard laboratory tests were assessed from blood collected immediately before the HD.
For statistical analysis SPSS software version 20 (IBM, Armonk, New York, USA) was used. The majority of our variables failed to show normality using Shapiro-Wilk test, therefore, comparisons of related samples were carried out with Wilcoxon signed-rank test, non-related samples with Mann Whitney U test.
Relationships were calculated with either the Spearman correlation test or multivariate linear regression. Data are presented as median (interquartile range). P values under 0.05 were considered statistically significant.
- 8 -
RESULTS
Investigation of diastolic mechanics in elite athletes
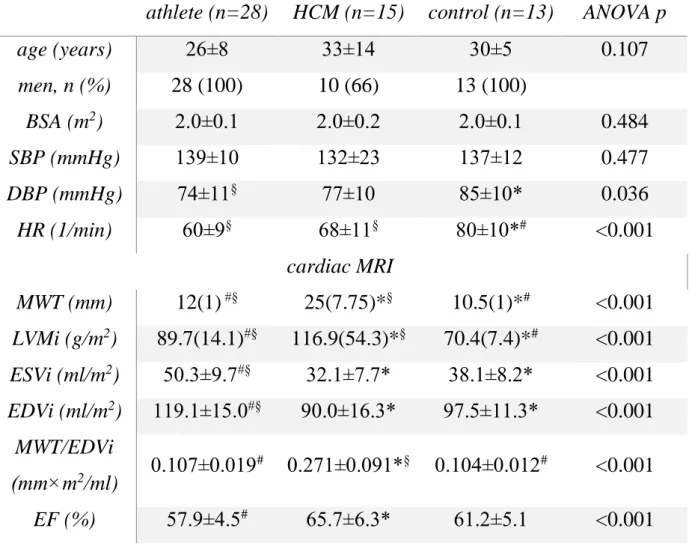
The basic demographic and hemodynamic characteristics of the study population are shown in Table 1.
Significantly increased maximal end-diastolic wall thickness and left ventricular mass index were measured in the EA group compared to controls, however, the left ventricular hypertrophy of HCM patients were more severe (Table 1). ESVi and EDVi values were increased in athletes, but were similar in the HCM and NC groups. Maximal end-diastolic wall thickness-to-end-diastolic volume index ratio was significantly increased in the HCM group and could differentiate the pathological hypertrophy of HCM from the other normal groups. Ejection fraction was found to be lower in sportsmen compared to HCM patients.
Key left ventricular twist and untwist parameters measured by speckle tracking are summarized in Figure 3. In our study groups, no differences could be observed in either maximal systolic basal and apical rotation or in their timing.
Twist values were also similar. Peak twist occurred after the aortic valve closure exclusively in HCM, hereby the onset of untwist was significantly delayed in HCM patients compared to elite athletes. Furthermore, at the timepoint of mitral valve opening remarkable difference could be observed among the three study groups regarding untwist and untwist rate (Figure 3). Elite athletes showed increased LV untwist motion compared to both NC and HCM. At the timepoint of mitral inflow peak E velocity, only the difference between athletes and HCM remained significant, which difference has finally disappeared in mid-diastole.
- 9 -
Table 1. Basic demographic, hemodynamic and cardiac MRI characteristics of the study groups. BSA: body surface area, DBP: diastolic blood pressure, EDVi:
end-diastolic volume index, EF: ejection fraction, ESVi: end-systolic volume index, HCM: hypertrophic cardiomyopathy, HR: heart rate, LVMi: left ventricular mass index, MWT: maximal end-diastolic wall thickness, SBP:
systolic blood pressure.
Normally distributed variables are shown as mean±SD, non-normally as median (interquartile range). *p<0.05 vs. athlete, #p<0.05 vs. HCM, §p<0.05 vs. control
athlete (n=28) HCM (n=15) control (n=13) ANOVA p
age (years) 26±8 33±14 30±5 0.107
men, n (%) 28 (100) 10 (66) 13 (100)
BSA (m2) 2.0±0.1 2.0±0.2 2.0±0.1 0.484
SBP (mmHg) 139±10 132±23 137±12 0.477
DBP (mmHg) 74±11§ 77±10 85±10* 0.036
HR (1/min) 60±9§ 68±11§ 80±10*# <0.001
cardiac MRI
MWT (mm) 12(1) #§ 25(7.75)*§ 10.5(1)*# <0.001 LVMi (g/m2) 89.7(14.1)#§ 116.9(54.3)*§ 70.4(7.4)*# <0.001 ESVi (ml/m2) 50.3±9.7#§ 32.1±7.7* 38.1±8.2* <0.001 EDVi (ml/m2) 119.1±15.0#§ 90.0±16.3* 97.5±11.3* <0.001
MWT/EDVi
(mm×m2/ml) 0.107±0.019# 0.271±0.091*§ 0.104±0.012# <0.001 EF (%) 57.9±4.5# 65.7±6.3* 61.2±5.1 <0.001
- 10 -
Untwist and untwist rate at mitral valve opening significantly correlated with E/A (ρ=0.41 and ρ=-0.54), e’ (ρ=0.47 and ρ=-0.63), E/e’ (ρ=-0.43 and ρ=0.43), ESVi (ρ=0.63 and ρ=-0.37), and EDVi (ρ=0.57 and ρ=-0.53, respectively, all p<0.05).
Figure 3. Twist and untwist parameters of the study groups. Elite athletes (EA, n=26), patients with hypertrophic cardiomyopathy (HCM, n=15), control subject (NC, n=13). Mean±SEM. *p<0.05 vs. EA, #p<0.05 vs. HCM,
§p<0.05 vs. NC
- 11 -
Investigation of uremic cardiomyopathy
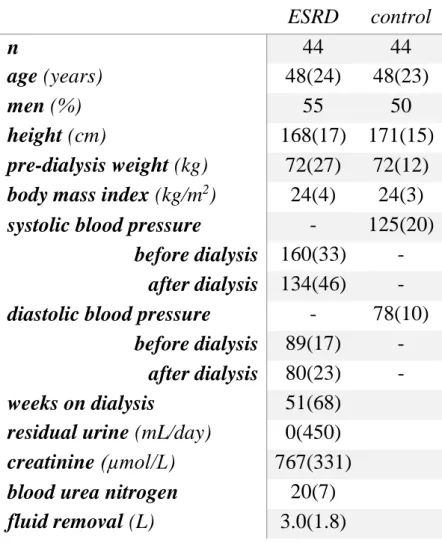
Basic demographic characteristics and the results of relevant laboratory tests of ESRD patients are summarized in Table 2. These patients represent a chronically hemodialyzed but well treated population with long-standing ESRD.
The NC group is age- and gender matched. Anthropometric details were also similar (Table 2).
LV mass and mass index were remarkably increased in ESRD patients compared to NC [LV mass: 244(97.5) vs. 130(24) g, LVMi: 136(46) vs. 71(8) g/m2, p<0.001].
Table 2. Basic demographics of the study groups and laboratory results of end- stage renal disease (ESRD) patients. Median (interquartile range).
ESRD control
n 44 44
age (years) 48(24) 48(23)
men (%) 55 50
height (cm) 168(17) 171(15)
pre-dialysis weight (kg) 72(27) 72(12) body mass index (kg/m2) 24(4) 24(3) systolic blood pressure
(mmHg)
- 125(20) before dialysis 160(33) -
after dialysis 134(46) - diastolic blood pressure
(mmHg)
- 78(10) before dialysis 89(17) -
after dialysis 80(23) - weeks on dialysis
ete (eltelt hét)
51(68) residual urine (mL/day) 0(450) creatinine (µmol/L) 767(331) blood urea nitrogen
(mmol/L)
20(7) fluid removal (L) 3.0(1.8)
- 12 -
Serum FGF-23 levels ranged between 34 and 6848 with a median of 687 pg/mL in this patient population. Not surprisingly, the phosphaturic hormone correlated with serum phosphate (ρ=0.832, p<0.001) and parathyroid hormone (ρ=0.556, p<0.001) levels. It was also associated with LVMi (ρ=0.401, p=0.025), but even stronger with LV mass without indexing (ρ=0.581, p<0.001).
EDVi and ESVi decreased, whilst EF and strain values improved in all directions after HD (Figure 4). GLS was not significantly different either before or after HD compared to NC value. Nevertheless, the patients’ baseline GCS, GAS and GRS values were reduced, and after HD only GCS increased enough to reach the normal level (Figure 4). Pre-HD GCS correlated with pre-HD systolic blood pressure (ρ=0.409, p=0.047), post-HD GCS with post-HD systolic blood pressure (ρ=0.585, p=0.017). Only the improvement in GLS was associated with the changes of LV volumes (ΔEDVi: ρ=-0.565, p=0.022, ΔESVi: ρ=-0.525, p=0.037), the increase of other strain parameters did not show any relation to volumetric changes.
LVMi was inversely correlated with pre-HD GCS (Table 3). However, after the HD LVMi was strongly associated with GCS, GAS and GRS as well. EF was heavily determined by the deformation parameters, but their values became even more related after HD. GCS was found to be the only independent predictor of EF among strain parameters both before (β=-0.884, adjusted R2=0.782, p<0.001) and after hemodialysis (β=-0.886, adjusted R2=0.785, p<0.001).
- 13 -
Figure 4. Comparison of 3D speckle tracking derived strain values of patients with end-stage renal disease (n=44) before (pre-HD) and after (post-HD) hemodialysis and normal controls (NC, n=44). Median (interquartile range).
* p<0.05 vs. NC, # p<0.05 vs. pre-HD
Significant inverse correlations were found between serum FGF-23 levels and post-HD GAS and GRS values (Table 3).
Table 3. Correlations between the 3D strain parameters and fibroblast growth factor – 23 (FGF-23), left ventricular mass index (LVMi) or ejection fraction (EF) in uremic patients (n=44, Spearman’s ρ). * p<0.05, ** p<0.001
GLS GCS GAS GRS
pre-HD post-HD pre-HD post-HD pre-HD post-HD pre-HD post-HD FGF-23 0.281 0.043 0.274 0.385 0.271 0.513* -0.371 -0.512*
LVMi 0.367 0.459 0.626** 0.761** 0.377 0.534* -0.329 -0.639*
EF -0.445* -0.626* -0.789** -0.834** -0.582* -0.786** 0.616** 0.695*
- 14 -
CONCLUSIONS
According to our research on left ventricular hypertrophies we have drawn the following conclusions:
(1) increased early diastolic inflow is a result of the supernormal diastolic myocardial mechanics in the physiological hypertrophy of athlete’s heart. Increased untwist and untwist rate at mitral valve opening indicate advanced relaxation in elite athletes compared to control subjects, while hypertrophic cardiomyopathy patients showed decreased values. According to these results, beyond the better understanding of the physiology of athlete’s heart, quantification of untwist mechanics may help to distinguish physiological and pathological left ventricular hypertrophies;
(2) we provided detailed characterization on myocardial mechanics in patients with end-stage renal disease and investigated the effects of hemodialysis. All directions of myocardial strains showed increased values after the hemodialysis. However, area and radial strains did not improve enough to reach the normal values. We found significant correlations between the impairment of these deformation parameters and the elevated serum levels of FGF-23.
We hypothesize that beyond inducing left ventricular hypertrophy, the hormone may deteriorate systolic function as well.
- 15 -
PUBLICATIONS
Publications related to the present thesis
Kovács A, Apor A, Nagy A, Vágó H, Tóth A, Nagy AI, Kováts T, Sax B, Széplaki G, Becker D, Merkely B. (2014) Left ventricular untwisting in athlete's heart: key role in early diastolic filling? Int J Sports Med, 35: 259-264.
IF: 2,374
Kovács A, Tapolyai M, Celeng C, Gara E, Faludi M, Berta K, Apor A, Nagy A, Tislér A, Merkely B. (2014) Impact of hemodialysis, left ventricular mass and FGF-23 on myocardial mechanics in end-stage renal disease: a three- dimensional speckle tracking study. Int J Cardiovasc Imaging, 30: 1331-1337.
IF: 2,322
Publications not related to the present thesis
Peluso D, Badano LP, Muraru D, Dal Bianco L, Cucchini U, Kocabay G, Kovács A, Casablanca S, Iliceto S. (2013) Right atrial size and function assessed with three-dimensional and speckle-tracking echocardiography in 200 healthy volunteers. Eur Heart J Cardiovasc Imaging, 14: 1106-1114.
IF: 3,669
Molnár AÁ*, Kovács A*, Apor A, Tárnoki AD, Tárnoki DL, Horváth T, Maurovich-Horvat P, Kiss RG, Jermendy G, Merkely B. (2014) Case report of multiple valve disease found in triplets. Twin Res Hum Genet, 17: 383-389.
*equal contribution IF: 1,918
- 16 -
Kosztin A, Soós P, Polgár L, Kutyifa V, Becker D, Kovács A, Merkely B.
(2014) EORP szívelégtelenség regiszter a Városmajori Szív- és Érgyógyászati Klinikán. Cardiol Hung, 44: 218-223.
Szauder I, Kovács A, Pavlik G. (2015) Comparison of left ventricular mechanics in runners versus bodybuilders using speckle tracking echocardiography. Cardiovasc Ultrasound, 13: 7.
IF: 1,283
Szegedi N, Széplaki G, Kovács A, Nagy KV, Németh T, Kutyifa V, Molnár L, Osztheimer I, Zima E, Szilágyi S, Özcan EE, Gellér L, Merkely B. (2015) Reszinkronizációs terápia – Primer implantáció és upgrade. Cardiol Hung, 45: 5- 11.
Kovács A*, Oláh A*, Lux Á, Mátyás C, Németh BT, Kellermayer D, Ruppert M, Török M, Szabó L, Meltzer A, Assabiny A, Birtalan E, Merkely B*, Radovits T*. (2015) Strain and strain rate by speckle-tracking echocardiography correlate with pressure-volume loop-derived contractility indices in a rat model of athlete's heart. Am J Physiol Heart Circ Physiol, 308: H743-748. *equal contribution
IF: 4,012