Research Article
Zsóri G, et al. J Dig Dis Hepatol: JDDH-144.The Effect of Metformin Treatment on Non-Alcoholic Fatty Pan- creas and Liver Disease in New-Onset Diabetes Mellitus
Gábor Zsóri1*, Klára Kosár1, Gábor Holzinger1, Dóra Illés1, Emese Ivány1, Géza Szabovik2, Máté Tajti1, András Nagy2, András Palkó2, László Czakó1
1University of Szeged, Faculty of Medicine, Albert Szent-Györgyi Medical and Pharmaceutical Center, First Department of Medicine, Hungary H-6720 Szeged, Korányi fasor 8-10
2University of Szeged, Faculty of Medicine, Albert Szent-Györgyi Medical and Pharmaceutical Center, Department of Radiology, Hungary H-6725 Szeged, Semmelweis utca 6
Abstract
Non-Alcoholic Fatty Pancreas and Liver Disease (NAFPD and NAFLD) are often associated with Type 2 Diabetes Mel- litus (T2DM). Our aim was to evaluate the incidence rate of NAFLD and NAFPD, the size of Pericardial Adipose Tissue (PAT) and the effect of metformin treatment on NAFLD, NAFPD and PAT in new-onset T2DM. 19 patients with new-onset T2DM and 10 subjects as control group were involved. Computed tomography and laboratory tests were performed before the beginning of metformin therapy and 4 months afterwards. The PAT and the amount of fat in the pancreas and liver was determined by the X- ray attenuation on unenhanced CT examination and compared with values for control subjects. Metabolic parameters improved significantly after the metformin therapy. The radiation absorption of the liver was significantly lower in patients with T2DM as compared to the control group (33.52±19.38 vs 53.1±8.31 HU) and significantly increased after the metformin therapy as compared to the baseline values (46.12±13.33 vs 33.52±19.38 HU). The radiation absorption of the pancreas was lower but not significant in patients with T2DM (32.76±9.55 vs 34.2±12.1 HU) and did not change significantly during the treatment (35.64±9.07 vs 32.76±9.55 HU). The size of the PAT was significantly larger in T2DM patients (2053.1±1136 vs 1223.9±312.9 mm2) but did not change significantly after the treatment (2053.1±1136 vs 2026.2±1032 mm2). Metformin therapy decreased the amount of fat in the liver parallel with the improvement of the metabolic parameters and may be beneficial for the prevention of the late consequences of NAFLD.
*Corresponding author: Gábor Zsóri, University of Szeged, Faculty of Medicine, Albert Szent-Györgyi Medical and Pharmaceu- tical Center, First Department of Medicine, Hungary H-6720 Szeged, Korányi fasor 8-10. Tel: +3662545186; Fax: +3662545185;
Email: zsori.gabor861@gmail.com
Citation: Zsóri G, Kosár K, Holzinger G , Illés D, Ivány E, et al. (2018) The Effect of Metformin Treatment on Non-Alcoholic Fatty Pancreas and Liver Disease in New-Onset Diabetes Mellitus. J Dig Dis Hepatol: JDDH-144. DOI: 10.29011/2574-3511. 000044 Received Date: 02 February, 2018; Accepted Date: 12 March, 2018; Published Date: 19 March, 2018
DOI: 10.29011/2574-3511. 000044
Keywords:
Metformin; Non-alcoholic fatty pancreas and liver disease; Pericardial adipose tissue; Type 2 diabetes mellitus.Abbreviations:
NAFPD : Non-alcoholic fatty pancreas disease NAFLD : Non-Alcoholic Fatty Liver Disease NASH : Non-Alcoholic Steatohepatitis T2DM : Type 2 Diabetes Mellitus DM : Diabetes Mellitus
PAT : Pericardial Adipose Tissue HbA1c : Glycosylated Hemoglobin
HOMA-IR: Homeostatic Model Assessment-Estimated Insulin Resistance
HU : Hounsfield Unit ROI : Region of Interest BMI : Body Mass Index pre-DM : Pre-Diabetes Mellitus CT : Computed Tomography
Introduction
It is a well-known fact that insulin resistance and obesity cause fatty accumulation in many organs, including the liver [Non-
Alcoholic Fatty Liver Disease (NAFLD)] and pancreas [Non- Alcoholic Fatty Pancreas Disease (NAFPD)] [1]. The worldwide prevalence of NAFLD ranges widely from 6.3% to 33% with a median of 20%, depending on the kind of assessment methods [2-5]. There is a high prevalence of NAFLD in patients with Type 2 Diabetes Mellitus (T2DM) (64-69%) [2,6-8] and dyslipidemia (20-81%) [9,10]. Obesity, type 2 diabetes mellitus and dyslipidemia are risk factors for the development of NAFLD [7,8,11,12]. The incidence rate of pre-DM is as high as 93.3% in NAFLD, so pre- DM is a more important predictor of NAFLD than metabolic syndrome [13]. Moreover, it seems the male gender is presumably a further risk factor for NAFLD [2]. NAFLD may progress through steatohepatitis to cirrhosis and hepatocellular carcinoma [14,15].
NAFPD is a less well-studied phenomenon. Fatty pancreas is a common ultrasound finding with increased echogenicity of the parenchyma because of fat accumulation [16]. Previous studies suggested a 16-35% prevalence of fatty pancreas in the general population [17,18]. It seems that age [19], obesity, hyperglycemia and dyslipidemia are risk factors for NAFPD [18,20-22].
NAFPD may increase the risk for the development of metabolic syndrome by causing inflammation [23], impaired pancreatic beta cell function and hyperglycemia [24]. This relationship may explain the presence of T2DM [25] in 6.9-12.6%
of patients with pancreatic steatosis [17,18]. Several studies suggested that insulin resistance is associated with pancreatic fat accumulation [20-22,26], Non-Alcoholic Steatohepatitis (NASH) [20,27] and pre-DM [21]. Higher pancreatic triglyceride content in obesity was described by proton magnetic resonance spectroscopy [28], CT [29-30] or MRI [31] even before the development of T2DM [28]. It was demonstrated that obesity leads to pancreatic ductal adenocarcinoma through pancreatic steatosis [23,32,33].
Evidence suggests that pancreatic steatosis has a role in T2DM, pancreatic exocrine dysfunction, acute pancreatitis [34,35], pancreatic cancer and the formation of pancreatic fistula after pancreatic surgery [36].
NAFLD and NAFPD are associated with each other because pancreatic fat is related to non-alcoholic steatohepatitis and is a significant predictor of the presence of NAFLD [37]. The elevation
of liver transaminases may suggest the presence of NAFLD or NASH. Ultrasonography and transient elastography are currently the most appropriate imaging modality for NAFLD screening, and liver biopsy is the “gold standard” for characterizing liver histology in patients with NAFLD [38]. In contrast to liver, no biochemical marker is available for the diagnosis of NAFPD. Furthermore, as the pancreas is a retroperitoneal organ, pancreatic biopsy is more cumbersome to perform and may be accompanied by more sampling errors and complications as compared to liver biopsy.
The visualisation of the pancreas by ultrasonography is more difficult, and the sensitivity and specificity of ultrasonography in detecting NAFPD are hampered by obesity and bloating.
Above all, in pre-diabetic and T2DM patients the amount of Pericardial Adipose Tissue (PAT) is significant higher compared to the amount of PAT in normoglycemic patients [39,40]. Previous review demonstrated that beside epicardial adipose tissue PAT is another risk factor for the development of cardiovascular disease in T2DM patients [41]. The aim of the present study was to evaluate the incidence rate of NAFLD and NAFPD, the size of PAT and the effect of metformin treatment on NAFLD, NAFPD and PAT in new-onset T2DM by measuring tissue attenuation and in unenhanced CT examinations.
Subjects and Methods
Nineteen patients with new-onset T2DM (male: 10;
female: 9; mean age: 56.38±9.71 years; Body Mass Index (BMI):
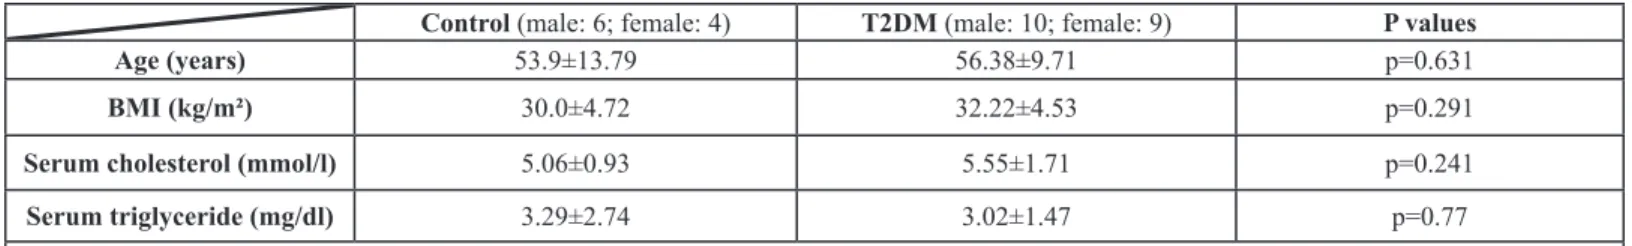
32.22±4.53 kg/m²) were involved in this prospective study. The control group comprised 10 subjects (male: 6; female: 4; mean age: 53.9±13.79 years; BMI: 30.0±4.72 kg/m²) without DM, matched for age, sex, BMI and serum lipids (Table 1), without the presence of any pancreatic, liver or cardiovascular disease or history of alcohol consumption. The diagnosis of T2DM was made in accordance with the American Diabetes Association criteria [42]. New-onset DM is defined as DM diagnosed within the last 1 month before the date of enrolment. Patients only dieted and did not receive any hypoglycemic agent before inclusion and had not history of alcohol consumption. Exclusion criteria were any pancreatic, liver and cardiovascular disease, or inherited disorders of fat metabolism in the case history. Computed
Control (male: 6; female: 4) T2DM (male: 10; female: 9) P values
Age (years) 53.9±13.79 56.38±9.71 p=0.631
BMI (kg/m²) 30.0±4.72 32.22±4.53 p=0.291
Serum cholesterol (mmol/l) 5.06±0.93 5.55±1.71 p=0.241
Serum triglyceride (mg/dl) 3.29±2.74 3.02±1.47 p=0.77
Data expressed as mean values ± standard deviation. T2DM: type 2 diabetes mellitus. BMI: body mass index.
Table 1: Age, BMI, cholesterol and triglyceride levels in patients with T2DM and control subjects.
tomography and laboratory tests were performed as a measurement for serum triglyceride, cholesterol and insulin levels, fasting blood glucose and glycosylated hemoglobin (HbA1c), while Homeostatic Model Assessment-Estimated Insulin Resistance (HOMA-IR) was calculated before the beginning of 1000 mg metformin twice daily therapy and 4 months afterwards.
The size of PAT and the amount of fat in the pancreas and liver was determined by X-ray attenuation rate on unenhanced CT examination [Hounsfield unit (HU)]. Each Region of Interest (ROI) in the liver, pancreas and spleen was a round area of approximately 1.0 cm2 as a marker of the degree of attenuation [43]. In the case of PAT, measurements were performed in one dedicated slice at the junction of vena cava inferior and right atrium. ROIs were identified in Segment VII of the liver, along the diaphragmatic surface of the spleen and in the body of the pancreas. Mean density was calculated and General Electric Centricity PACS software was used to determine the values. NAFLD and NAFPD were defined when the liver-to-spleen or the pancreas-to-spleen attenuation ratio was <1 [44, 45]. All participants provided their written informed consent. The study protocol was in full accordance with the most recent revisions of the Helsinki Declaration and was approved by the ethics committee at the University of Szeged. Paired-samples and 2 samples t-tests were used to describe the differences between the laboratory values and X-ray attenuation rate at the beginning of metformin therapy and 4 months afterwards. Data were processed with SPSS 22.0 (Armonk, New York, USA) and a level of p<0.05 was considered statistically significant.
Results
Fasting blood glucose, HbA1c, serum insulin and HOMA-IR decreased significantly after the metformin therapy as compared to the baseline values (Table 2). However, serum triglyceride and BMI did not change. In total, 6 patients (31.6%) received statin therapy for elevated cholesterol and triglyceride levels. Nevertheless, the serum cholesterol level decreased significantly in those patients who did not receive statin therapy in addition to the metformin therapy (p=0.016) (Table 2).
Baseline
values 4 months
afterwards P values Fasting blood
glucose (mmol/l) 11.75±5.12 6.69±1.21 p=0.001 HbA1c (%) 9.22±2.56 6.48±0.73 p<0.001 Serum insulin
(mU/l) 34.4±21.11 23.0±13.46 p=0.005
HOMA-IR (molar
units) 16.88±10.07 6.56 b p<0.001
Serum cholesterol without statin
therapy (mmol/l) 4.81±1.25 4.44±1.09 p=0.016 Serum triglyceride
(mg/dl) 2.77±1.33 2.34±1.43 p=0.209
BMI (kg/m²) 32.01±4.62 31.85±4.58 p=0.407 Data expressed as mean values±standard deviation. HbA1c:
glycosylated hemoglobin. HOMA-IR: homeostasis model assessment-estimated insulin resistance. BMI: body mass index.
Table 2: The changes of laboratory test results and BMI from baseline values to 4 months afterwards.
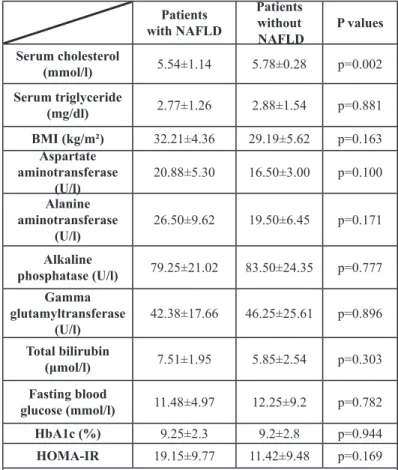
Thirteen patients (68.4%) had NAFLD based on the diagnostic criteria [44]. We compared the group with NAFLD and the group without NAFLD. A significant relationship was not found between BMI, triglyceride, fasting blood glucose level, HbA1c and liver enzymes. However, a significant link was revealed between groups in serum cholesterol levels (p=0.002) (Table 3).
Patients with NAFLD
Patients without
NAFLD P values Serum cholesterol
(mmol/l) 5.54±1.14 5.78±0.28 p=0.002 Serum triglyceride
(mg/dl) 2.77±1.26 2.88±1.54 p=0.881
BMI (kg/m²) 32.21±4.36 29.19±5.62 p=0.163 Aspartate
aminotransferase
(U/l) 20.88±5.30 16.50±3.00 p=0.100
Alanine aminotransferase
(U/l) 26.50±9.62 19.50±6.45 p=0.171
Alkaline
phosphatase (U/l) 79.25±21.02 83.50±24.35 p=0.777 Gamma
glutamyltransferase
(U/l) 42.38±17.66 46.25±25.61 p=0.896 Total bilirubin
(μmol/l) 7.51±1.95 5.85±2.54 p=0.303
Fasting blood
glucose (mmol/l) 11.48±4.97 12.25±9.2 p=0.782
HbA1c (%) 9.25±2.3 9.2±2.8 p=0.944
HOMA-IR 19.15±9.77 11.42±9.48 p=0.169 Data expressed as mean value ± standard deviation. NAFLD: non- alcoholic fatty liver disease. BMI: body mass index.
Table 3: The cholesterol, triglyceride, BMI, fasting blood glucose, HbA1c and liver enzyme values in patients with and without NAFLD.
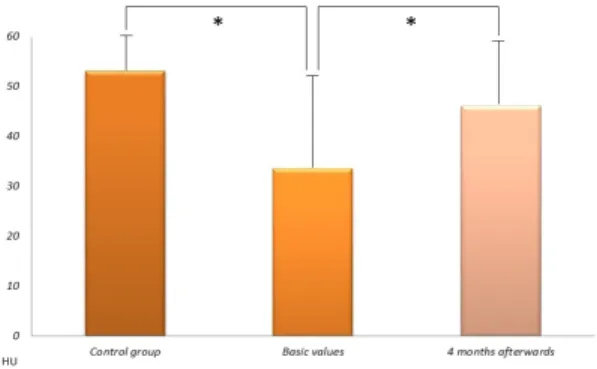
The radiation absorption of the liver was significantly lower in patients with T2DM as compared to the control group [33.52±19.38 HU versus 53.1±8.31 HU (p=0.001)] and significantly increased after the metformin therapy as compared to the baseline values [33.52±19.38 HU versus 46.12±13.33 HU (p=0.039)] (Figure 1).
Only 8 patients (42.1%) had NAFLD after the 4-month metformin therapy according to the the diagnostic criteria.
The X-ray attenuation rate during a native CT examination was measured in new-onset type 2 diabetic patients before and 4 months after the start of metformin therapy and in control subjects. Data expressed as mean values
± standard deviation. HU: Hounsfield Unit. *p < 0.05.
Figure 1: The radiation absorption of the liver.
Fifteen patients (78.9%) were diagnosed with NAFPD based on the diagnostic criteria. The radiation absorption of the pancreas was lower but not significant in patients with T2DM as compared to the control group [32.76±9.55 HU versus 34.2±12.1 HU (p=0.755)] and did not change significantly after the treatment [32.76±9.55 HU versus 35.64±9.07 HU (p=0.405)] (Figure 2).
The X-ray attenuation rate during a native CT examination was measured in new-onset type 2 diabetic patients before and 4 months after the start of metformin therapy and in control subjects. Data expressed as mean values±standard deviation. HU: Hounsfield Unit.
Figure 2: The radiation absorption of the pancreas.
The size of the PAT was significantly larger in patients with T2DM as compared to the control group [2053.1±1136 versus 1223.9±312.9 mm2 (p=0.01)] and did not change significantly after the metformin treatment [2053.1±1136 versus 2026.2±1032 mm2 (p=0.86)] (Figure 3). The present study has demonstrated that NAFLD and NAFPD is already present in patients with new-onset diabetes. Metformin therapy effectively decreased the amount of fat in the liver, but not in the pancreas. PAT is larger in new-onset T2DM as compared to the control group and it is not influenced by metformin treatment.
A native CT examination was measured in new-onset type 2 diabetic patients before and 4 months after the start of metformin therapy and in control subjects. Data expressed as mean values±standard deviation. mm2: square millimeters. *p < 0.05.
Figure 3: The size of pericardial adipose tissue.
Discussion
NAFLD is the most common liver disorder worldwide and contributes significantly to overall mortality, as well as to cardiovascular and liver-related mortality in particular. The main risk factor is T2DM; NAFLD can be demonstrated in 64-69% of type 2 diabetic patients [2,6-8]. It is likely that NAFLD is the hepatic manifestation of metabolic syndrome, where insulin resistance is the main risk factor [46]. On the other hand, NAFLD may progress to its inflammatory complication, NASH. The high incidence of NASH in patients with T2DM leads to further complications, such as liver cirrhosis and hepatocellular carcinoma [14,15]. Given the expected rise in the prevalence of T2DM, NAFLD is projected to be the principal aetiology for liver transplantation within the next decade [47]. Furthermore, NAFLD is thought to be an independent determinant of cardiovascular disease [48].
PAT plays a role in myocardial energy metabolism through the connection with the coronary arteries and the myocardium [49]. Increased pericardial fat volume was demonstrated as a risk factor for coronary artery disease [50] and the development of cardiovascular disease in T2DM patients [41]. Lozzo found increased PAT volume in T2DM patients [51]. Previous study
evaluated the effect of pioglitazone and metformin therapy on PAT resulting in an increased pericardial fat volume during the 24- week long pioglitazone treatment [52]. However, metformin did not change significantly the size of PAT [52]. Metabolic syndrome and obesity are commonly associated with NAFLD. However, the links between NAFLD and insulin resistance and T2DM are not fully understood [47]. NAFLD can predict the incidence of diabetes independently of traditional risk factors, including obesity, peripheral insulin resistance and metabolic syndrome [53]. Moreover, diabetes promotes or worsens hepatic steatosis, thus fueling a vicious cycle.
The T2DM patient cohort was selected to study the effect of insulin resistance on the prevalence of NAFLD. The control subjects did not have DM, the presence of any pancreatic, liver or cardiovascular disease or history of alcohol consumption, but were matched for age, sex, BMI and serum lipids. Therefore, the presence of T2DM was the only variable in our study that could influence the prevalence of NAFLD. Patients with new-onset DM diagnosed within one month, and without alcohol consumption, any pancreatic, liver and cardiovascular disease, or inherited disorders of fat metabolism in the case history were enrolled in our prospective study:
To analyse the effect of early-phase insulin resistance on the
• development of NAFLD and NAFPD
To study patients without antidiabetic medication; and
•
To analyse the effect of newly-introduced metformin therapy
• on the degree of fat content in the liver, pancreas and on the size of PAT.
69% and 62% of T2DM patients had NAFLD defined by ultrasound in two studies, respectively [7, 8], and in the latter study 87% of the NAFLD cases were confirmed histologically. However, these studies had a cross-sectional design that included diabetic patients with variable disease length. We involved new-onset DM patients diagnosed within 1 month before the time of enrolment in our study. It was demonstrated that insulin resistance is already present at least 5 years before overt diabetes in populations with a high prevalence of T2DM [54]. 68.4% of newly diagnosed diabetic patients in our study had NAFLD. This means that NAFLD is already present in the early phase of DM. The high prevalence of NAFLD in our study can be explained by the fact that our patients had several risk factors. They were overweight and had elevated cholesterol and triglyceride levels. However, the BMI, serum cholesterol and triglyceride levels were also above the norm in the control group, and there were no significant differences between the control group and the DM group. In contrast, only 10% of the control subjects had NAFLD. Furthermore, the radiation absorption of the liver was significantly lower, indicating an increased amount of fat in the liver in patients with T2DM as compared to the control group. This increased amount of fat, therefore, can be attributed
to insulin resistance after excluding other risk factors. The high prevalence of NAFLD can also be explained by the fact that we defined fatty liver by measuring radiation absorption on computed tomography, which is more sensitive, specific and operator- independent as compared to ultrasound.
NAFPD has been poorly investigated as compared to NAFLD, although interest is increasing among researchers.
Reports on the relationship between NAFPD and β-cell function are inconsistent, however. Some studies indicate that pancreatic lipid content is negatively associated with insulin secretion in nondiabetic subjects [55] or individuals with prediabetes [56], while others suggest that there is no relationship between β-cell function and pancreatic fat in prediabetic [57] or diabetic subjects [55]. Pancreatic fat content can be studied with multiple diagnostic modalities. A histological examination requires a pancreatic biopsy, but this is invasive and there are complications associated with it. Ultrasonography is cheap and easily available, but a relatively insensitive measure of pancreatic fat content. More recently, expensive MRI techniques have been utilized for the assessment of pancreatic fat deposition. A native CT scan was employed in our study to measure the amount of pancreatic steatosis using radiation absorption correlated to the spleen. Diabetic patients have been demonstrated to have higher pancreatic fat content measured by magnetic resonance spectroscopy [55,58] and dual-echo magnetic resonance chemical shift imaging [59]. In contrast, Saisho et al.
found that pancreatic fat content was not significantly increased in T2DM [60]. 78.9% of new-onset DM patients were diagnosed as having NAFPD based on the diagnostic criteria, while no NAFPD was detected in the control population in our study.
Since the control group was matched for age, sex, BMI and serum lipids with the T2DM group, NAFPD may be a consequence of insulin resistance. Newly (<1 month) diagnosed T2DM patients were enrolled in the study to assess the effect of metformin on NAFLD and NAFPD. Metformin is the first- line agent for the treatment of diabetes and is the most popular antidiabetic agent. The effects of metformin on NAFLD have been evaluated in several studies, some of them showing a beneficial effect on aminotransferase levels or liver histological alterations [2,61-63]. No study has ever evaluated the effect of metformin on hepatic fat content measured by tissue attenuation on unenhanced CT examination. Four-month-long metformin treatment significantly reduced fat content in the liver in our study.
Metformin also improved glycemic control and insulin resistance measured by HOMA-IR, and reduced serum cholesterol level, which can be partly attributed to its beneficial effect. However, metformin therapy reduced pancreatic fat content and the size of PAT but not significantly. NAFLD and NAFPD can be detected in the majority of new-onset T2DM patients. Metformin therapy decreased the amount of fat in liver parallel with the improvement of the metabolic parameters, but not in the pancreas and did not
reduce the size of PAT. Metformin therapy started early in the course of diabetes may be beneficial for the prevention of the late consequences of NAFLD.
Acknowledgement
The present study was partly supported by Hungarian Diabetes Association and the University of Szeged Faculty of Medicine (5S 428).
References
Eguchi Y, Eguchi T, Mizuta T, Ide Y, Yasutake T, et al. (2006) Visceral 1. fat accumulation and insulin resistance are important factors in nonal-
coholic fatty liver disease. J Gastroenterol 41: 462-469.
Vernon G, Baranova A, Younossi ZM (2011) Systematic review: the 2. epidemiology and natural history of non-alcoholic fatty liver disease and non-alcoholic steatohepatitis in adults. Aliment Pharmacol Ther 34: 274-285.
Williams CD, Stenger J, Asike MI, Torres DM, Shaw J, et al. (2011) 3. Prevalence of nonalcoholic fatty liver disease and nonalcoholic steato-
hepatitis among a largely middle-aged population utilizing ultrasound and liver biopsy: a prospective study. Gastroenterology 140: 124-131.
Browning JD, Szczepaniak LS, Dobbins R, Nuremberg P, Horton JD, 4. et al. (2004) Prevalence of hepatic steatosis in an urban population in
the United States: impact of ethnicity. Hepatology 40: 1387-1395.
Bedogni G, Miglioli L, Masutti F, Tiribelli C, Marchesini G, et al. (2005) 5. Prevalence of and risk factors for nonalcoholic fatty liver disease: The
Dionysos nutrition and liver study. Hepatology 42: 44-52.
Richard J and Lingvay I (2011) Hepatic steatosis and type 2 diabetes:
6. current and future treatment considerations. Expert Rev Cardiovasc Ther 9: 321-328.
Leite NC, Salles GF, Araujo AL, Villela-Nogueira CA, Cardoso CR 7. (2009) Prevalence and associated factors of non-alcoholic fatty liver disease in patients with type-2 diabetes mellitus. Liver Int 29: 113- 119.
Prashanth M, Ganesh HK, Vima MV, John M, Bandgar T, et al. (2009) 8. Prevalence of nonalcoholic fatty liver disease in patients with type 2
diabetes mellitus. J Assoc Physicians India 57: 205-210.
Bacon BR, Farahvash MJ, Janney CG, Neuschwander-Tetri BA (1994) 9. Nonalcoholic steatohepatitis: an expanded clinical entity. Gastroenter-
ology 107: 1103-1109.
Assy N, Kaita K, Mymin D, Levy C, Rosser B, et al. (2000) Fatty infiltra- 10. tion of liver in hyperlipidemic patients. Dig Dis Sci 45: 1929-1934.
Naga C, Zobair Y, Joel EL, Anna MD, Elizabeth MB, et al. (2012) 11. The diagnosis and management of non-alcoholic fatty liver disease:
Practice Guideline by the American Association for the Study of Liver Diseases, American College of Gastroenterology, and the American Gastroenterological Association. Hepatology 55: 2005-2023.
Musso G, Gambino R, Cassader M, Pagano G (2011) Meta-analysis:
12. Natural history of non-alcoholic fatty liver disease (NAFLD) and diag- nostic accuracy of non-invasive tests for liver disease severity. Annals of Medicine 43: 617-649.
Zelber-Sagi S, Lotan R, Shibolet O, Webb M, Buch A, et al. (2013) 13. Non-alcoholic fatty liver disease independently predicts prediabetes
during a 7-year prospective follow-up. Liver Int 33: 1406-1412.
Sanyal AJ, Banas C, Sargeant C, Luketic VA, Sterling RK, et al. (2006) 14. Similarities and differences in outcomes of cirrhosis due to nonalco-
holic steatohepatitis and hepatitis C. Hepatology 42: 682-689.
Adams LA, Lymp JF, Sauver JST, Sanderson SO, Lindor KD, et al.
15. (2005) The Natural History of Nonalcoholic Fatty Liver Disease: A Pop- ulation-Based Cohort Study. Gastroenterology 129: 113-121.
Marks WM, Filly RA, Callen PW (1980) Ultrasonic evaluation of normal 16. pancreatic echogenicity and its relationship to fat deposition. Radiol-
ogy 137: 475-479.
Wang CY, Ou HY, Chen MF, Chang TC, Chang CJ (2014) Enigmatic 17. Ectopic Fat: Prevalence of Nonalcoholic Fatty Pancreas Disease and Its Associated Factors in a Chinese Population. J Am Heart Assoc 3:
000297.
Lesmana CRA, Pakasi LS, Inggriani S, Aidawati ML, Lesmana LA 18. (2015) Prevalence of Non-Alcoholic Fatty Pancreas Disease (NAFPD) and its risk factors among adult medical check-up patients in a private hospital: a large cross sectional study. BMC Gastroenterology 15: 174.
Li J, Xie Y, Yuan F, Song B, Tang C (2011) Noninvasive quantifica- 19. tion of pancreatic fat in healthy male population using chemical shift
magnetic resonance imaging: effect of aging on pancreatic fat content.
Pancreas 40: 295-299.
Wu W-C and Wang C-Y (2013) Association between non-alcoholic 20. fatty pancreatic disease (NAFPD) and the metabolic syndrome: case–
control retrospective study. Cardiovascular 12: 77.
Ou H-Y, Wang C-Y, Yang Y-C, Chen M-F, Chang C-J (2013) The Asso- 21. ciation between Nonalcoholic Fatty Pancreas Disease and Diabetes.
PLOS ONE 8: 62561.
Sepe PS, Ohri A, Sanaka S, Berzin TM, Sekhon S, et al. (2011) A pro- 22. spective evaluation of fatty pancreas by using EUS. Gastrointestinal
Endoscopy 73: 987-993.
Pitt HA (2007) Hepato-pancreato-biliary fat: the good, the bad and the 23. ugly. HPB (Oxford) 9: 92-97.
He
24. ni M, Machann J, Staiger H, Schwenzer NF, Peter A, et al. (2010) Pancreatic fat is negatively associated with insulin secretion in individ- uals with impaired fasting glucose and/or impaired glucose tolerance:
a nuclear magnetic resonance study. Diabetes/Metabolism Research and Reviews 26: 200-205.
Tushuizen ME, Bunck MC, Pouwels PF, Bontemps S, van Waesber- 25. ghe JH, et al. (2007) Pancreatic fat content and beta-cell function in
men with and without type 2 diabetes. Diabetes Care 30: 2916-2921.
Targher G, Rossi AP, Zamboni GA, Fantin F, Antonioli A, et al. (2012) 26. Pancreatic fat accumulation and its relationship with liver fat content and other fat depots in obese individuals. Journal of Endocrinological Investigation 35: 748-753.
Musso G, Cassader M, De Michieli F, Rosina F, Orlandi F, et al. (2012) 27. Nonalcoholic steatohepatitis versus steatosis: adipose tissue insulin resistance and dysfunctional response to fat ingestion predict liver in- jury and altered glucose and lipoproteinmetabolism. Hepatology 56:
933-942.
Lingvay I, Esser V, Legendre JL, Price AL, Wertz KM, et al. (2009) 28. Noninvasive quantification of pancreatic fat in humans. J Clin Endo-
crinol Metab 94: 4070-4076.
Matsumoto S, Mori H, Miyake H, Takaki H, Maeda T, et al. (1995) Un- 29. even fatty replacement of the pancreas: evaluation with CT. Radiology
194: 453-458.
Katz DS, Hines J, Math KR, Nardi PM, Mindelzun RE, et al. (1999) 30. Using CT to reveal fat-containing abnormalities of the pancreas. AJR
Am J Roentgenol 172: 393-396.
Kovanlikaya A, Mittelman SD, Ward A, Geffner ME, Dorey F, et al.
31. (2005) Obesity and fat quantification in lean tissues using three-point Dixon MR imaging. Pediatr Radiol 35: 601-607.
Bracci PM (2012) Obesity and pancreatic cancer: overview of epide- 32. miologic evidence and biologic mechanisms. Mol Carcinog 51: 53-63.
Hori M, Takahashi M, Hiraoka N, Yamaji T, Mutoh M, et al. (2014) As- 33. sociation of pancreatic fatty infiltration with pancreatic ductal adeno-
carcinoma. Clin Translat Gastroenterol 5: 53.
Papachristou GI, Papachristou DJ, Avula H, Slivka A, Whitcomb DC 34. (2006) Obesity increases the severity of acute pancreatitis: perfor-
mance of APACHE-O score and correlation with the inflammatory re- sponse. Pancreatology 6: 279-285.
Martinez J, Johnson CD, Sanchez-Paya J, de Madaria E, Robles-Diaz 35. G, et al. (2006) Obesity is a definitive risk factor of severity and mortal-
ity in acute pancreatitis: an updated meta-analysis. Pancreatology 6:
206-209.
Pietro A, Addeo JRD, Francois P, Elie O, Pascal RF, et al. (2014) Pan- 36. creatic fistula after a pancreaticoduodenectomy for ductal adenocar- cinoma and its association with morbidity: a multicentre study of the French Surgical Association. HPB (Oxford) 16: 46-55.
Van Geenen EJ, Smits MM, Schreuder TC, van der Peet DL, Bloe- 37. mena E, et al. (2010) Nonalcoholic fatty liver disease is related to non-
alcoholic fatty pancreas disease. Pancreas 39: 1185-1190.
Chalasani N, Younossi Z, Lavine JE, Diehl AM, Brunt EM, et al. (2012) 38. The diagnosis and management of non-alcoholic fatty liver disease:
practice guideline by the American Gastroenterological Association, American Association for the Study of Liver Diseases, and American College of Gastroenterology. Gastroenterology 142: 1592-1609.
Yang FS, Yun CH, Wu TH, Hsieh YC, Bezerra HG, et al. (2013) High 39. pericardial and peri-aortic adipose tissue burden in pre-diabetic and
diabetic subjects. BMC Cardiovasc Disord 13: 98.
Iozzo P (2011) Myocardial, perivascular, and epicardial fat. Diabetes 40. Care 34: 371-379.
Noyes AD, Dua K, Devadoss R, Chhabra L (2014) Cardiac adipose 41. tissue and its relationship to diabetes mellitus and cardiovascular dis-
ease. World J Diabetes 5: 868-876.
American Diabetes Association (2010) Diagnosis and Classification of 42. Diabetes Mellitus. Diabetes Care 33: 62-69.
Ohgi K, Okamura Y, Yamamoto Y, Ashida R, Ito T, et al. (2016) Periop- 43. erative Computed Tomography Assessments of the Pancreas Predict
Nonalcoholic Fatty Liver Disease After Pancreaticoduodenectomy.
Medicine (Baltimore) 95: 25-35.
Zeb I, Li D, Nasir K, Katz R, Larijani VN, et al. (2012) Computed to- 44.
mography scans in the evaluation of fatty liver disease in a population based study: the multi-ethnic study of atherosclerosis. Acad Radiol 19:
811-818.
Smits MM and van Geenen EJ (2011) The clinical significance of pan- 45. creatic steatosis. Nat Rev Gastroenterol Hepatol 8: 169-177.
Gao X, Fan J-G for the Study Group of Liver and Metabolism, Chinese 46. Society of Endocrinology (2013) Diagnosis and management of non-
alcoholic fatty liver disease and related metabolic disorders: Consen- sus statement from the Study Group of Liver and Metabolism, Chinese Society of Endocrinology. Journal of Diabetes 5: 406-415.
Richard J and Lingvay I (2011) Hepatic steatosis and Type 2 diabetes:
47. current and future treatment considerations. Expert Rev Cardiovasc Ther 9: 321-328.
Targher G, Day CP, Bonora E (2010) Risk of cardiovascular disease 48. in patients with nonalcoholic fatty liver disease. N Engl J Med 363:
1341-1350.
Iacobellis G, Corradi D, Sharma AM (2005) Epicardial adipose tissue:
49. anatomic, biomolecular and clinical relationships with the heart. Nat Clin Pract Cardiovasc Med 10: 536-543.
Greif M, Becker A, von Ziegler F, Lebherz C, Lehrke M, et al. (2009) 50. Pericardial adipose tissue determined by dual source CT is a risk fac-
tor for coronary atherosclerosis. Arterioscler Thromb Vasc Biol 5: 781- 786.
Iozzo P (2011) Myocardial, perivascular, and epicardial fat. Diabetes 51. Care 34: 371-379.
Jonker JT, Lamb HJ, van der Meer RW, Rijzewijk LJ, Menting LJ, et al.
52. (2010) Pioglitazone Compared with Metformin Increases Pericardial Fat Volume in Patients with Type 2 Diabetes Mellitus. J Clin Endocrinol Metab 95: 456-460.
Cusi K (2010) The role of adipose tissue and lipotoxicity in the patho- 53. genesis of type 2 diabetes. Curr Diab Rep 10: 306-315.
Weyer C, Bogardus C, Mott DM, Pratley RE (1999) The natural history 54. of insulin secretory dysfunction and insulin resistance in the pathogen-
esis of type 2 diabetes mellitus. J Clin Invest 104: 787-794.
Tushuizen ME, Bunck MC, Pouwels PJ, Bontemps S, van Waesber- 55. ghe JH, et al. (2007) Pancreatic fat content and beta-cell function in
men with and without type 2 diabetes. Diabetes Care 30: 2916-2921.
Heni M, Machann J, Staiger H, Schwenzer NF, Peter A, et al. (2010) 56. Pancreatic fat is negatively associated with insulin secretion in indi-
viduals with impaired fasting glucose and/or impaired glucose toler- ance: a nuclear magnetic resonance study. Diabetes Metab Res Rev 26: 200-205.
van der Zijl NJ, Goossens GH, Moors CC, van Raalte DH, Muskiet 57. MH, et al. (2011) Ectopic fat storage in the pancreas, liver, and abdom-
inal fat depots: impact on beta-cell function in individuals with impaired glucose metabolism. J Clin Endocrinol Metab 96: 459-467.
Lingvay I, Esser V, Legendre JL, Price AL, Wertz KM, et al. (2009) 58. Noninvasive quantification of pancreatic fat in humans. J Clin Endo-
crinol Metab 94: 4070-4076.
Chai J, Liu P, Jin E, Su T, Zhang J, et al. (2016) MRI chemical shift 59. imaging of the fat content of the pancreas and liver of patients with
type 2 diabetes mellitus. Exp Ther Med 11: 476-480.
Saisho Y, Butler AE, Meier JJ, Monchamp T, Allen-Auerbach M, et al.
60. (2007) Pancreas volumes in humans from birth to age one hundred taking into account sex, obesity, and presence of type-2 diabetes. Clin Anat 20: 933-942.
Haukeland JW, Konopski Z, Eggesbo HB, von Volkmann HL, Ra- 61. schpichler G, et al. (2009) Metformin in patients with non-alcoholic
fatty liver disease: a randomized, controlled trial. Scand. J Gastroen- terol 44: 853-860.
Tock L, Damaso AR, De Piano A, Carnier J, Sanches PL, et al. (2010) 62. Long-term effects of metformin and lifestyle modification on nonalco-
holic fatty liver disease obese adolescents. J Obes pii:831901.
Li Y, Liu L, Wang B, Wang J, Chen D (2013) Metformin in non-alcohol- 63. ic fatty liver disease: A systematic review and meta-analysis. Biomed
Rep 1: 57-64.