Aerobic interval training improves irisin and chemerin levels of both liver and visceral adipose
tissues and circulating asprosin in rats with metabolic syndrome
FERESHTEH AHMADABADI
1, HOSSEIN NAKHAEI
2p, MEHDI MOGHARNASI
1and CHUN-JUNG HUANG
31Department of Exercise Physiology, Faculty of Sport Sciences, University of Birjand, Birjand, Iran
2Health Promotion Research Centre, Zahedan University of Medical Sciences, Zahedan, Iran
3Exercise Biochemistry Laboratory, Department of Exercise Science and Health Promotion, Florida Atlantic University, Boca Raton, FL 33431, United States
Received: February 27, 2021 • Accepted: July 13, 2021 Published online: September 15, 2021
© 2021 Akademiai Kiado, Budapest
ABSTRACT
The perturbation of adipokinetic hormones, such as irisin, chemerin, and asprosin has been reported to participate in pathological conditions (e.g., insulin resistance) and chronic inflammation. However, exercise training has been long established as an effective intervention for prevention and treatment of these chronic and metabolic diseases. This study was to examine the effects of aerobic continuous training (ACT) and aerobic interval training (AIT) on irisin and chemerin levels of liver tissue (LT) and visceral adipose tissue (VAT), circulating asprosin, and their relationships with cardiometabolic risk factors in rats with metabolic syndrome (MetS). Thirty-two male Wistar rats were randomly divided into four equal groups: normal control (N-Ctr), control (Ctr-MetS), ACT, and AIT. After familiarization, rats with exercise intervention performed either ACT or AIT five times a week over eight weeks. The level of irisin in both ACT and AIT groups was higher than the Ctr-MetS group in LT and VAT, with a greater improvement of LT level observed in AIT vs. ACT groups. Furthermore, the level of chemerin in LT and VAT was lower in both ACT and AIT groups than the Ctr-MetS group, whereas only AIT group exhibited a reduction of serum asprosin when compared to ACT and Ctr-MetS, along with the improvements of cardiometabolic markers, such as HOMA-IR and lipid profile. These findings may support the efficiency and effectiveness of AIT
pCorresponding author. Health Promotion Research Centre, Zahedan University of Medical Sciences, Zahedan, Iran. Tel.:þ985433411374; fax:þ985433372003 E-mail: hossiennakhaie@yahoo.com
Physiology International108 (2021) 3, 383–397 DOI:10.1556/2060.2021.00182
intervention in the modulation of these novel metabolic hormones and cardiometabolic risk factors for reduced risk of metabolic syndrome.
KEYWORDS
exercise, aerobic continuous training, aerobic interval training, adipokinetic hormones, metabolic syndrome
INTRODUCTION
The development of metabolic syndrome (MetS) is associated with various conditions and diseases, such as obesity, type 2 diabetes (T2D), hypertension, dyslipidemia, and cardiovascular disease (CVD) [1,2]. Particularly, adipose tissue is considered as an endocrine organ to secrete adipokines in the regulation of metabolic homeostasis and also involve in the pathologic pro- cesses of metabolic and inflammatory complications in obesity [3,4]. The perturbation of these adipokines, such as irisin, chemerin, and asprosin has been reported to participate in patho- logical conditions (e.g., insulin resistance) and chronic inflammation [4–6].
Irisin has also been identified as a myokine derived from its precursor protein, fibronectin type III domain-containing protein 5 (FNDC5) in skeletal muscle [7]. A deficiency of FNDC5 gene has been shown to associate with increased fat accumulation, thereby contributing to in- sulin resistance and inflammation via M1 macrophage polarization [8]. However, following administration of irisin in mice, an improvement of glucose homeostasis and insulin resistance was observed, along with reduced hepatic fat and body weight [9–11]. A recent study by Ozcan and colleagues (2020) have also demonstrated a reduction in lipid levels (low-density lipoprotein [LDL] and triglyceride [TG]) after irisin infusion in obese rats [12]. Collectively, thesefindings support an important role of irisin in the modulation of metabolic homeostasis in obesity. In addition, chemerin is a novel adipokine secreted by both white adipose tissue and liver [6,13], and the release of chemerin from these tissues into circulation has been reported to help regulate glucose homeostasis in obese and diabetic mice [14]. While several studies have examined the relationships of chemerin with irisin and physiological parameters in human obesity [15,16], chemerin has been shown to promote inflammation, insulin resistance, metabolic syndrome, and cardiovascular diseases [13,17]. However, the complex of the signaling pathways of irisin and chemerin and their physiological roles of metabolic regulation is still unclear.
Asprosin is another adipokine mainly released from white adipose tissue to enhance the release of hepatic glucose in the fasted state [4, 18]. The infusion of irisin has been found to increase the level of asprosin in male rats [12], although the exact mechanisms regarding the potential effect of irisin on the release of asprosin remains to be elucidated. Of particular note, research has recently shown either a comparable [19] or lower [20] asprosin concentration in healthy obese vs. normal-weight individuals, whereas the level of asprosin is pathologically increased in obese patients with insulin resistance [13]. Increased circulating levels of asprosin and chemerin have demonstrated to result in the impairment of glucose tolerance [6, 21];
however, the association between these pathological adipokines is still unknown. Thus, an understanding of the therapeutic roles of asprosin, chemerin, as wells as irisin could be potentially beneficial for the treatments of T2D and MetS.
Emerging evidence suggests that exercise training is an effective strategy for obesity-related complications, including T2D and MetS [22,23]. Specifically, the parameters of cardiovascular (e.g., peak oxygen uptake) and metabolic outcomes (LDL and high-density lipoprotein [HDL]) are improved, along with body composition in patients with MetS following exercise training [24]. More specifically, aerobic continuous training (ACT) has been long established as an effective intervention for prevention and treatment of chronic and metabolic diseases, such as T2D [25,26]. Increased levels of circulating irisin have been reported following ACT protocol in rats with T2D [27], suggesting that training-mediated irisin might stimulate the browning of white adipocytes through anti-obesity and anti-diabetic effects of p38 mitogen-activated protein kinase (MAPK) and extracellular signal-regulated kinases (ERK) pathways [28]. While there is limited literature regarding the effect of exercise on modulation of chemerin and asprosin in humans, a reduction in the asprosin level of liver tissue (LT) was found following ACT in diabetic rats [26]. However, when compared with ACT, aerobic interval training (AIT) is a time- efficient exercise strategy to result in similar or even greater improvement in lipid profile, fasting blood glucose, and body composition in patients with MetS [29]. Therefore, to further under- stand the potential therapeutic roles of these metabolic hormones, this study was to examine the effects of ACT vs. AIT on irisin and chemerin levels of both LT and visceral adipose tissue (VAT) and serum asprosin in rats with MetS. Furthermore, the associations of irisin and chemerin in both LT and VAT with serum asprosin were also investigated to explore the possible effects of irisin and chemerin on the release of asprosin.
MATERIALS AND METHODS
Animals and diet-induced metabolic syndrome in rats
Thirty-two male Wistar rats (weight: 163.15± 16.12g) were purchased from Central Animal Facility of Zahedan University of Medical Sciences. Rats were given standard rodent chow and waterad libitumin a temperature-controlled 12-h light-dark conditions. After a week of accli- matization to the laboratory conditions, eight rats were randomly selected as normal control (N- Ctr) and were fed a dietary standard until sacrifice. The standard diet (3.05 kcal g1 digestible energy) contained 64.4% carbohydrate (starch 54.4% and sucrose 10%), 23.1% protein (casein), 4.8% fat (soy oil), 0.3% vitamins, and 7.7% mineral (Behparvar Company-Tehran, Iran). The use and care of animals followed the guidelines of the Iranian Convention for the Protection of Vertebrate Animals Used for Experimental and other Scientific Purposes and authorized by the Sport Sciences Research Institute, Tehran, Iran, with the codeIR.SSRI.REC.1399.037. To induce metabolic syndrome, 24 rats were fed a high-fat diet for 12 weeks. Based on available resources for making high-fat and high-caloric diet, it contained 1,518 g the standard dietary powder, 480 g of fat (lard), 360 g of starch, 360 g of sucrose, 24 g cholesterol and 18 g of cholic acid [30,31]. Rats with Lee obesity index value of 310 or above (equivalent to BMI in humans) were considered as obese. The Lee index was calculated according to the following formula [32,33]:
Lee index %¼
ffiffiffiffiffiffiffiffiffiffiffiffiffiffiffiffiffiffiffiffiffiffiffiffiffiffiffiffiffiffiffi Body weightðgÞ p3
Nosetoanus lengthðcmÞ31000
Body weight was measured weekly by a digital scale (sensitive: 0.001 g, GF-300, A&D Com- pany, Japan). To identify MetS, seven rats were randomly selected from obese rats, and blood
Physiology International108 (2021) 3, 383–397 385
samples were taken from the tail vein with criteria as follows: blood glucose >126 mg dL1, HDL lower than 40 mg dL1, and triglyceride >150 mg dL1[30,34]. Subsequently, 24 rats with MetS were randomly divided into three equal intervention groups: control (Ctr-MetS; N 58), ACT (N 5 8) and AIT (N 5 8). Rats in both exercise training protocols were acclimatized to the treadmill running at 0.3 km h1for 15 min over 5 days [25].
Measurement of maximal oxygen uptake (VO
2max)
VO2maxwas measured as described by Bedford et al. (1979) [35]. The maximal exercise test consisted of a 10-stage treadmill running at an initial speed of 0.3 km h1with an increment of 0.3 km h1 in each 3-min stage [25].
Training protocols
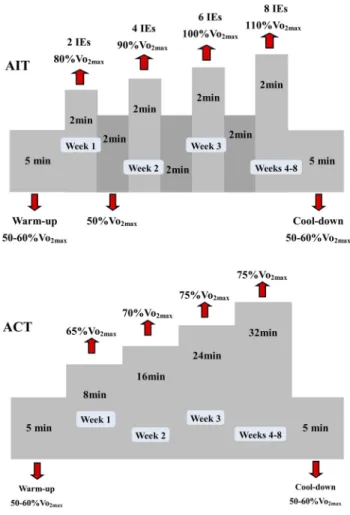
Exercise training protocols were implemented at a rate of five days week1 over 8 weeks. The AIT protocol consisted of two 2-min high-intensity at 80% VO2maxin the 1stweek, four 2-min high-intensity at 90% VO2maxin the 2ndweek, six 2-min high-intensity at 100% VO2maxin the 3rdweek followed by eight 2-min high-intensity at 110% VO2maxfrom the 4thweek until the end of the intervention [36]. Following each interval exercise, the intensity was set for 2 min at 50%
VO2maxas active recovery. The 5-min warm-up and cool-down at 50–60% VO2maxwere also included. Thus, the total duration of each AIT session with both warm-up and cool down was 18 min for the 1st week, 26 min for the 2ndweek, 34 min in the 3rd week, and 42 min week1 from the 4th to 8thweeks (see Fig. 1). To equate the total duration of running between both protocols, the ACT group ran continuously with the intensity at 65% VO2maxfor 18 min in the 1stweek, 70% VO2maxfor 26 min in the 2ndweek, 75% VO2maxfor 34 min in the 3rdweek, and 75% VO2maxfor 42 min from the 4thto 8thweeks with the inclusion of a 5-min warm-up and cool-down at 50–60% VO2max[37].
Analyses of serum asprosin and metabolic biomarkers
The rats were euthanized 48 h after the last intervention session and subsequently 12h fasting with ketamine (90 mg kg1) and xylazine (10 mg kg1). Blood samples were collected into sterile tubes from the heart for the analyses of serum asprosin, glucose, insulin, and lipid profile.
Specifically, the serum levels of asprosin, insulin, glucose and lipid profiles were measured, using the commercial ELISA kits, according to the manufacturer’s instructions. Inter-assay coefficients of variation and levels of sensitivity are 0.75/0.02 ng mL1and 3.3%/0.07
m
g l1; respectively for asprosin (ZellBio, Germany) and insulin (Mercodia-Sweden). Furthermore, both glucose and lipid profiles (CHOL, TG, LDL-C, and HDL-C) were analyzed with the Pars Azmoon kits (Tehran, Iran). Homeostasis model assessment: insulin resistance (HOMA-IR) was also deter- mined, according to the following formula [38]:HOMAIR:½fasting glucoseðmmol=lÞ3½fasting insulinð
m
U=mlÞ=22:5Tissue preparation and determination of irisin and chemerin in LT and VAT
After sacrifice, the liver and visceral adipose tissues were quickly removed and frozen in liquid nitrogen (1968C), and then stored at808C for further analyses. After the tissue samples were
homogenized in suitable buffer (phosphate buffered saline, pH 7.4, 200 mM) and centrifuged (3,000 rpm/1 min), the supernatants were carefully collected. For the measurement of irisin and chemerin, the commercial ELISA kits were used with the sensitivity of 0.05 ng mL1and 5 ng L1; respectively (ZellBio GmbH, Ulm, Germany).
Statistical analyses
Data analyses were conducted with the Statistical Package for the Social Sciences (SPSS version 20.0). Shapiro-Wilk and Levene’s tests were utilized to examine the normal distribution of data and the assumption of equality of variances, respectively. To compare the differences in body weight and Lee index between ACT and AIT protocols, a 4 (Groups: N-Ctr, Ctr-MetS, ACT, and AIT)32 (Time: pre- vs. post-training) mixed and repeated-Measures factorial ANOVA were performed. The one-way ANOVA with LSD’s post-hoc test was used to determine the signif- icance of differences between groups for irisin, chemerin, asprosin, glucose, insulin, HOMA-IR, and lipid profile. Pearson’s correlation analysis was utilized to examine the relationships among irisin and chemerin in both LT and VAT, serum asprosin, glucose level, HOMA-IR, and lipid profile (CHOL, TG, LDL-C, and HDL-C). Statistical significance was defined as a P value≤ 0.05. All data are described as means±SD.
RESULTS
Assessments of body weight and Lee index
Our results showed a significant group by time interaction for both body weight (F [3, 28]5 12.28,P< 0.01) and Lee index (F [3, 28]510.17,P< 0.01) (Table 1). Specifically, the Lee index in the Ctr-MetS group was higher than the N-Ctr group (P50.01). Both body weight and Lee index in the AIT group were significantly decreased compared to the N-Ctr (P< 0.01 andP5 0.05; respectively) and Ctr-MetS groups (P< 0.01 andP 50.01; respectively). In comparison with the baseline (pre-training), a significant decrease in Lee index was found following the AIT and ACT interventions (P< 0.01 andP< 0.01; respectively), with no difference in both body weight and Lee index between both groups.
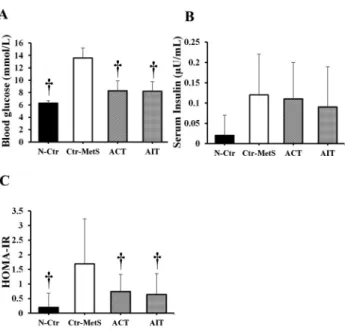
Measurements of serum glucose, insulin, HOMA-IR, and lipid profile
The one-way ANOVA results demonstrated a significant difference in serum glucose (F [3, 28]
540.08,P< 0.01) and HOMA-IR (F [3, 28]53.51,P5 0.02) between groups. The concen- tration of serum glucose was significantly decreased in the N-Ctr, ACT, and AIT groups compared to the Ctr-MetS group (P < 0.01, P < 0.01, and P < 0.01; respectively) (Fig. 2A), whereas no change was observed in the level of insulin between groups (F [3, 28]51.86,P5 0.15) (Fig. 2B). When compared to the Ctr-MetS group, HOMA-IR showed a significant reduction in the N- Ctr (P< 0.01), ACT (P50.05), and AIT (P50.03) groups (Fig. 2C), with no difference between both exercise interventions.
Serum lipid profiles, including total CHOL (F [3, 28]546.15,P< 0.01), LDL-C (F [3, 28]5 48.34,P< 0.01), TG (F [3, 28]5107.30, P< 0.01), and HDL-C (F [3, 28]513.79, P< 0.01) differed between groups. The concentrations of CHOL, LDL-C, and TG in the Ctr-MetS group were higher than the N-Ctr (P< 0.01, P < 0.01, and P< 0.01; respectively), ACT (P < 0.01,
Physiology International108 (2021) 3, 383–397 387
P < 0.01, and P< 0.01; respectively), and AIT (P< 0.01P < 0.01, and P < 0.01; respectively) groups (Fig. 3A, B and C). In comparison with the Ctr-MetS group, the level of HDL-C was significantly higher in the N-Ctr, ACT, and AIT groups (P < 0.01, P 5 0.04, and P < 0.01;
respectively) (Fig. 3D). Finally, the level of serum TG in the AIT group was lower than the ACT group (P50.04) (Fig. 3C).
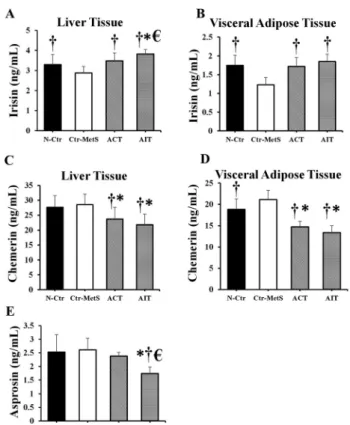
Levels of irisin and chemerin in LT and VAT and serum asprosin
Our analyses showed a significant difference in the irisin levels of LT (F [3, 28]58.36,P< 0.01) and VAT (F [3, 28]511.11,P< 0.01) between groups. Specifically, the concentration of irisin was higher in the N-Ctr, ACT, and AIT groups than the Ctr-MetS group in both LT (P50.04, P< 0.01, andP< 0.01; respectively) and VAT (P< 0.01,P< 0.01, andP< 0.01; respectively)
Fig. 1.Schematic representation of aerobic interval and continuous training protocols
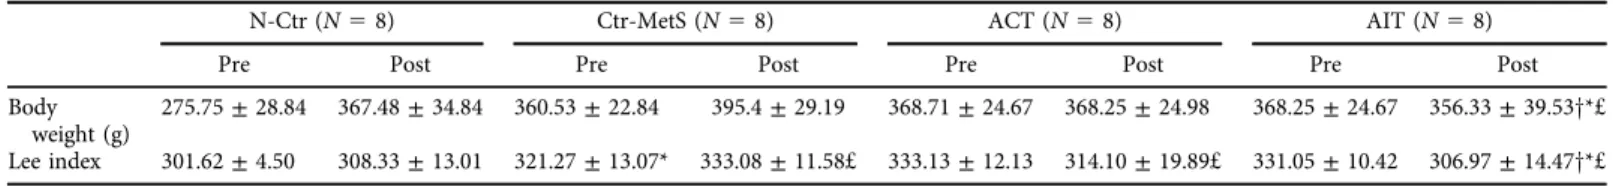
Table 1.Descriptive characteristics of rats prior to and following after the experimental protocols
N-Ctr (N58) Ctr-MetS (N58) ACT (N58) AIT (N58)
Pre Post Pre Post Pre Post Pre Post
Body weight (g)
275.75±28.84 367.48±34.84 360.53±22.84 395.4±29.19 368.71±24.67 368.25±24.98 368.25±24.67 356.33±39.53y*£
Lee index 301.62±4.50 308.33±13.01 321.27±13.07* 333.08±11.58£ 333.13±12.13 314.10±19.89£ 331.05±10.42 306.97±14.47y*£
N-Ctr: normal control; Ctr-MetS: control with metabolic syndrome; ACT: aerobic continuous training; AIT: aerobic interval training. * Significant difference compared to N-Ctr;ysignificant difference compared to Ctr-MetS;£significant difference compared to baseline (pre-training).
PhysiologyInternational108(2021)3,383–397389
(Fig. 4A and B). When compared to the N-Ctr and ACT groups, the level of irisin in the LT was higher in the AIT group (P50.01 and P< 0.01; respectively).
Furthermore, a significant difference in the chemerin levels was observed in both LT (F [3, 28] 5 5.74, P < 0.01) and VAT (F [3, 28]5 27.14, P < 0.01) between groups. As shown in Fig. 4C and 4D, the levels of chemerin in the ACT and AIT groups were lower than the Ctr- MetS group in both LT (P50.01 andP< 0.01; respectively) and VAT (P50.01 andP< 0.01;
respectively). A similar tendency of decreased chemerin was also found in ACT and AIT in- terventions compared to the N-Ctr group in the LT (P50.04 andP50.01; respectively) and VAT (P50.01 andP50.01; respectively). However, our results did not show any difference in the concentration of chemerin in either LT or VAT between both AIT and ACT groups. While the serum level of asprosin also showed a significant difference between groups (F [3, 28]57.18, P< 0.01), only AIT group exhibited a lower concentration compared to the N-Ctr, Ctr–MetS, and ACT groups (P< 0.01,P< 0.01, and P50.02; respectively) (Fig. 4E).
Correlation among irisin, chemerin, asprosin, and other metabolic parameters
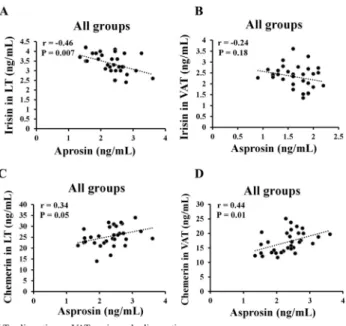
When combined with all groups, our analysis showed that the serum level of asprosin was negatively correlated with irisin in LT (r50.46,P< 0.01) (Fig. 5A), but no relationship was found with irisin in VAT (r 5 0.24, P 5 0.18) (Fig. 5B). However, there was a positive relationship between irisin in VAT and serum asprosin in the Ctr-MetS group (r 50.81,P5 0.01). Finally, the expression of chemerin in both LT and VAT were positively correlated with
Fig. 2.Effects of 8 weeks of ACT and AIT interventions in Wistar rats with MetS
the serum level of asprosin (r 50.34,P50.05, r50.44P 50.01; respectively) in all groups (Fig. 5C and D), while no relationship was found in each individual group.
Furthermore, both irisin in LT and VAT were negatively correlated with serum levels of glucose (r50.34,P50.05;r50.66,P< 0.01; respectively), CHOL (r50.55,P< 0.01;
r50.80,P< 0.01; respectively), TG (r50.51,P< 0.01;r50.74,P< 0.01; respectively), and LDL-C (r 5 0.49, P< 0.01; r5 0.72, P< 0.01; respectively) when combined with all groups. In the entire study groups, a significant positive correlation was found between chemerin in LT and LDL-C (r 5 0.34, P 5 0.05), while chemerin in VAT was positively correlated with glucose (r50.41,P50.01), CHOL (r50.54,P< 0.01), TG (r50.53,P< 0.01), and LDL-C (r50.49,P< 0.01). Finally, the serum level of asprosin was only demonstrated to negatively correlate with TG, rather than other metablic/lipid profile following the ACT intervention (r 50.72,P5 0.04).
DISCUSSION
This study was undertaken to examine the effect of ACT and AIT over 8 weeks on the levels of irisin and chemerin in both LT and VAT and serum asprosin, along with cardiometabolic risk factors in rats with MetS. Our results demonstrated that both ACT and AIT interventions
Fig. 3.Serum lipid profile following 8 weeks of training protocols in Wistar rats with MetS
Physiology International108 (2021) 3, 383–397 391
upregulated the expression of irisin in LT and VAT, with a greater LT level of irisin observed in AIT vs. ACT groups. Furthermore, a similar improvement of chemerin in LT and VAT was observed in both ACT and AIT groups, while only AIT group exhibited a reduction of serum asprosin with the improvements of cardiometabolic markers, such as HOMA-IR and lipid profile. These findings may support the efficiency and effectiveness of AIT intervention in the modulation of these novel metabolic hormones and cardiometabolic risk factors.
In congruence with previous research [25,39], our results showed a reduction in body weight and/or Lee index following both ACT and AIT interventions in rats with MetS. Although no difference was observed in both body weight and Lee index between ACT and AIT groups, Sun and colleagues (2020) have recently demonstrated a greater improvement in body weight and fat mass in response to 8 months of AIT vs. ACT in aged rats [40]. One of possible underlying mechanisms in AIT-mediated weight loss may be due to increased expression of peroxisome proliferator-activated receptor-g (PPARg) that promotes the upregulation of lipid enzymes,
Fig. 4.Effects of 8 weeks of ACT and AIT in Wistar rats with MetS
such as hormone-sensitive lipase (HSL) and adipose triglyceride lipase (ATGL) in facilitating fat mobilization [40]. This discrepancy with our insignificant findings between AIT and ACT are most likely due to the training duration (2 vs. 8 months) to ineffectively elicit the expression and/or activation of these lipid enzymes. Research has recently shown the beneficial effects of irisin on the reduction in lipid levels (LDL and TG) in obese rats [12]. In the present study, both ACT and AIT exhibited an elevation in the concentration of irisin in LT and VAT than the Ctr- MetS group, with a higher level in LT following AIT vs. ACT. These findings are partially supported by previous studies [41,42], demonstrating increased expression of FNDC5, a pre- cursor protein of irisin, in LT and VAT following a concurrent endurance and resistance training in non-diabetic and diabetic rats. Furthermore, in rats the increased level of plasma irisin was observed in response to the AIT intervention [43], whereas ACT did not elicit a significant change in the serum level of irisin [44]. The potential mechanisms underlying of exercise training might be regulated by peroxisome proliferator-activated receptor gamma coactivator 1-alpha (PGC1-a) in LT and VAT [45, 46] in contributing to the expression of FNDC5 [11]. Subsequently, irisin acts as a thermogenic adipomyokine on white adipose cells by stimulating uncoupling protein 1 (UCP1) expression to enhance thermogenesis and/or energy expenditure [5]. In this regard, training-mediated irisin, particularly with AIT could potentially play an important role in the improvement of Mets, although our analyses only observed negative relationships between irisin and lipid profile (e.g., LDL-C and TG) when combined with all groups.
While chemerin is a critical adipokine to help regulate glucose homeostasis [14], elevated level of chemerin is associated with MetS and insulin resistance in obesity [47]. The present study showed a significant reduction in the level chemerin in LT and VAT following ACT and
Fig. 5.Relationships of irisin and chemerin in both LT and VAT with serum asprosin
Physiology International108 (2021) 3, 383–397 393
AIT interventions than the Ctr-MetS group, with no difference between both groups. The results of ACT are in parallel with thefindings of Lin and colleagues [48], demonstrating reduced levels of chemerin in liver tissue following 4 weeks of moderate-intensity aerobic training in obese and diabetic rats. Although our study is the first to investigate the effect of AIT on the chemerin expression in both LT and VAT, Parastesh et al. [49] support the beneficial effect of AIT on the reduction of circulating chemerin as well as fasting blood glucose in diabetic rats. This reduced level of chemerin with training is likely due to the expression and stimulation of PPARgin the skeletal muscle, liver tissue, and circulating monocytes [48] and could be a potential therapeutic target for the treatments of obesity, diabetes, and related inflammatory diseases [50].
It has been demonstrated that the concentration of asprosin is pathologically elevated in the obese [51] or diabetic [18] individuals. While there is limited literature regarding the investi- gation of AIT effect on the level of asprosin, thefindings of the present study demonstrated that only AIT intervention diminished the expression of serum asprosin, with no beneficial effect observed following ACT. Interestingly, research has recently demonstrated a reduction in the circulating level of asprosin in both continuous and interval swimming trainings in rats with MetS, but no difference was found between both trained groups [30]. Taken together, these findings may suggest a limited role of AIT-mediated asprosin in the modulation of lipid profile associated with MetS.
Another uniqueness of this study was to explore the potential relationships of irisin and chemerin with the level of asprosin. Although either AIT or ACT did not show any correlations between these metabolic hormones, the level of serum asprosin was positively correlated with irisin in VAT in the Ctr-MetS group. Ozcan et al. [12] speculated that irisin might mediate the secretion of asprosin across the blood-brain barrier to subsequently stimulate orexigenic agouti- related peptide (AgRPþ) neurons via the cAMP signaling pathway in obese rats, resulting in the stimulation of appetite and food intake [12,18]. However, when combined with all groups, our results showed a negative correlation between serum asprosin and irisin in LT. Similarly, the expression of chemerin in both LT and VAT was positively correlated with the serum level of asprosin in the entire groups only. While limited evidence exists regarding these relationships, the investigation of mechanistic studies might provide a greater understanding of the potential effects of irisin and chemerin on the release of asprosin.
CONCLUSION
This study demonstrated that both ACT and AIT interventions enhanced the expression of irisin in LT and VAT, particularly a greater improvement in LT level following the AIT intervention.
Our findings are the first to report a comparable level of chemerin in LT and VAT in both ACT and AIT groups, whereas only AIT intervention diminished the level of serum asprosin. Further research with measures of these adipokines in all levels of serum and hepatic/visceral adipose tissues may potentially provide a basis to understand the clinical benefits of these metabolic hormones in predicting the effectiveness of exercise interventions, such as AIT for reduced risk of metabolic syndrome and/or diabetes.
Declarations of interest:The authors declare no conflicts of interest in this work.
REFERENCES
1. Mansyur MA, Bakri S, Patellongi IJ, Rahman IA. The association between metabolic syndrome components, low-grade systemic inflammation and insulin resistance in non-diabetic Indonesian adolescent male. Clin Nutr ESPEN 2020; 35: 69–74.
2. Kumari R, Kumar S, Kant R. An update on metabolic syndrome: metabolic risk markers and adipokines in the development of metabolic syndrome. Diabetes Metab Syndr Clin Res Rev 2019.
3. Balistreri CR, Caruso C, Candore G. The role of adipose tissue and adipokines in obesity-related inflam- matory diseases. Mediators Inflamm 2010; 2010.
4. Wang Y, Qu H, Xiong X, Qiu Y, Liao Y, Chen Y, et al. Plasma asprosin concentrations are increased in individuals with glucose dysregulation and correlated with insulin resistance andfirst-phase insulin secretion.
Mediators Inflamm 2018; 2018.
5. Arhire LI, Mihalache L, Covasa M. Irisin: a Hope in understanding and managing obesity and metabolic syndrome. Front Endocrinol 2019; 10.
6. Lee M-W, Lee M, Oh K-J. Adipose tissue-derived signatures for obesity and type 2 diabetes: adipokines, batokines and microRNAs. J Clin Med 2019; 8(6): 854.
7. Yuksel Ozgor B, Demiral I, Zeybek U, Celik F, Buyru F, Yeh J, et al. Effects of irisin compared with exercise on specific metabolic and obesity parameters in female mice with obesity. Metab Syndr Relat Disord 2020; 18(3):
141–5.
8. Shi J, Fan J, Su Q, Yang Z. Cytokines and abnormal glucose and lipid metabolism. Front Endocrinol (Lau- sanne) 2019; 10: 703.
9. Mo L, Shen J, Liu Q, Zhang Y, Kuang J, Pu S, et al. Irisin is regulated by CAR in liver and is a mediator of hepatic glucose and lipid metabolism. Mol Endocrinol 2016; 30(5): 533–42.
10. Xiong X-Q, Geng Z, Zhou B, Zhang F, Han Y, Zhou Y-B, et al. FNDC5 attenuates adipose tissue inflam- mation and insulin resistance via AMPK-mediated macrophage polarization in obesity. Metabolism 2018; 83:
31–41.
11. Bostr€om P, Wu J, Jedrychowski MP, Korde A, Ye L, Lo JC, et al. A PGC1-a-dependent myokine that drives brown-fat-like development of white fat and thermogenesis. Nature 2012; 481(7382): 463–8.
12. Ozcan S, Ulker N, Bulmus O, Yardimci A, Ozcan M, Canpolat S. The modulatory effects of irisin on asprosin, leptin, glucose levels and lipid profile in healthy and obese male and female rats. Arch Physiol Biochem 2020:
1–8.
13. Wang Y, Jin X, Qiao L, Li Y, Yang R, Wang M, et al. Aldosterone upregulates chemerin via chemokinelike receptor 1-Rho-ROCK-JNK signaling in cardiacfibroblasts. Int J Clin Exp Med 2017; 10(4): 6756–62.
14. Ernst MC, Issa M, Goralski KB, Sinal CJ. Chemerin exacerbates glucose intolerance in mouse models of obesity and diabetes. Endocrinology 2010; 151(5): 1998–2007.
15. Balaban YA, Yilmaz N, Kalayci M, Unal M, Turhan T. Irisin and chemerin levels IN patients with type 2 diabetes mellitus. Acta Endocrinologica (Bucharest) 2019; 15(4): 442.
16. Da¸browski K, Kierach R, Grabarek BO, Boron D, Kukla M. Effect of ursodeoxycholic acid therapy due to pregnant intrahepatic cholestasis on chemerin and irisin levels. Dermatol Ther 2020; 33(2): e13272.
17. Karczewska-Kupczewska M, Nikołajuk A, Stefanowicz M, Matulewicz N, Kowalska I, Stra¸czkowski M. Serum and adipose tissue chemerin is differentially related to insulin sensitivity. Endocr Connections 2020; 9(5):
360–9.
18. Romere C, Duerrschmid C, Bournat J, Constable P, Jain M, Xia F, et al. Asprosin, a fasting-induced glu- cogenic protein hormone. Cell 2016; 165(3): 566–79.
Physiology International108 (2021) 3, 383–397 395
19. Schumann U, Qiu S, Enders K, Bosnyak E, Laszlo R, Machus K, Trajer E, Jaganathan S, Z€ugel M, J€urgen M, Steinacker. Asprosin, A newly identified fasting-induced hormone is not elevated in obesity and is insensitive to acute exercise: 3592 board# 39 June 3 800 AM-930 AM. Med Sci Sports Exerc 2017; 49(5S): 1023.
20. Long W, Xie X, Du C, Zhao Y, Zhang C, Zhan D, et al. Decreased circulating levels of asprosin in obese children. Horm Res paediatrics 2019; 91(4): 271–7.
21. Yuan M, Li W, Zhu Y, Yu B, Wu J. Asprosin: a novel player in metabolic diseases. Front Endocrinol 2020; 11:
64.
22. Saghebjoo M, Nezamdoost Z, Ahmadabadi F, Saffari I, Hamidi A. The effect of 12 weeks of aerobic training on serum levels high sensitivity C-reactive protein, tumor necrosis factor-alpha, lipid profile and anthro- pometric characteristics in middle-age women patients with type 2 diabetes. Diabetes Metab Syndr Clin Res Rev 2018; 12(2): 163–8.
23. Tjønna AE, Ramos JS, Pressler A, Halle M, Jungbluth K, Ermacora E, et al. EX-MET study: exercise in prevention on of metabolic syndrome–a randomized multicenter trial: rational and design. BMC public health 2018; 18(1): 437.
24. Ostman C, Smart N, Morcos D, Duller A, Ridley W, Jewiss D. The effect of exercise training on clinical outcomes in patients with the metabolic syndrome: a systematic review and meta-analysis. Cardiovasc dia- betology 2017; 16(1): 110.
25. Caponi PW, Lehnen AM, Pinto GH, Borges J, Markoski M, Machado UF, et al. Aerobic exercise training induces metabolic benefits in rats with metabolic syndrome independent of dietary changes. Clinics 2013;
68(7): 1010–7.
26. Ko JR, Seo DY, Kim TN, Park SH, Kwak H-B, Ko KS, et al. Aerobic exercise training decreases hepatic asprosin in diabetic rats. J Clin Med 2019; 8(5): 666.
27. Bayat M, Alaee M, Akbari A, Sadegh M, LatifiSA, Parastesh M, et al. A comparative study of the antidiabetic effect of two training protocols in streptozotocin-nicotinamide diabetic rats. Horm Mol Biol Clin Invest 2020.
28. Zhang Y, Xie C, Wang H, Foss RM, Clare M, George EV, et al. Irisin exerts dual effects on browning and adipogenesis of human white adipocytes. Am J Physiology-Endocrinology Metab 2016.
29. Dun Y, Thomas RJ, Smith JR, Medina-Inojosa JR, Squires RW, Bonikowske AR, et al. High-intensity interval training improves metabolic syndrome and body composition in outpatient cardiac rehabilitation patients with myocardial infarction. Cardiovasc diabetology 2019; 18(1): 104.
30. Nakhaei H, Mogharnasi M, Fanaei H. Effect of swimming training on levels of asprosin, lipid profile, glucose and insulin resistance in rats with metabolic syndrome. Obes Med 2019; 15: 100111.
31. Rocha GLd, Crisp AH, de Oliveira MR, Silva CAd, Silva JO, Duarte AC, et al. Effect of high intensity interval and continuous swimming training on body mass adiposity level and serum parameters in high-fat diet fed rats. Scientific World J 2016; 2016.
32. Hioki C, Yoshida T, Kogure A, Yoshimoto K, Shimatsu A. Growth hormone administration controls body composition associated with changes of thermogenesis in obese KK-Ay Mice. Open Endocrinol J 2010; 4: 3–8.
33. Lee MO. Determination of the surface area of the white rat with its application to the expression of metabolic results. Am J Physiology-Legacy Content 1929; 89(1): 24–33.
34. Rohman MS, Lukitasari M, Nugroho DA, Nashi W, Nugraheini NIP, Sardjono TW. Development of an experimental model of metabolic syndrome in sprague dawley rat. Res J Life Sci 2017; 4(1): 76–86.
35. Bedford TG, Tipton CM, Wilson NC, Oppliger RA, GisolfiCV. Maximum oxygen consumption of rats and its changes with various experimental procedures. J Appl Physiol 1979; 47(6): 1278–83.
36. Humayun Fard H, Hosseini SA, Azarbayjani MA, Nikbakht M. The effect of interval training with selenium consumption on gene expression of caspase- 3 and cyclin-D in liver tissue of cadmium-exposed rats. Jun- dishapur J Health Sci 2019; 11(2): e88598.
37. Haram PM, Kemi OJ, Lee SJ, Bendheim MØ, Al-Share QY, Waldum HL, et al. Aerobic interval training vs.
continuous moderate exercise in the metabolic syndrome of rats artificially selected for low aerobic capacity.
Cardiovasc Res 2009; 81(4): 723–32.
38. Matthews D, Hosker J, Rudenski A, Naylor B, Treacher D, Turner R. Homeostasis model assessment: insulin resistance andb-cell function from fasting plasma glucose and insulin concentrations in man. Diabetologia 1985; 28(7): 412–9.
39. Amri J, Parastesh M, Sadegh M, LatifiS, Alaee M. High-intensity interval training improved fasting blood glucose and lipid profiles in type 2 diabetic rats more than endurance training; possible involvement of irisin and betatrophin. Physiol Int 2019; 106(3): 213–24.
40. Sun L, Li F-H, Li T, Min Z, Yang L-D, Gao H-E, et al. Effects of high-intensity interval training on adipose tissue lipolysis, inflammation, and metabolomics in aged rats. Pfl€ugers Archiv-European J Physiol 2020;
472(2): 245–58.
41. Abdi A, Mehrabani J, Nordvall M, Wong A, Fallah A, Bagheri R. Effects of concurrent training on irisin and fibronectin type-III domain containing 5 (FNDC5) expression in visceral adipose tissue in type-2 diabetic rats.
Arch Physiol Biochem 2020: 1–6.
42. Rashidlamir A, Hoseinzadeh M, Zeiaddini Dashtkhaki L. The effects of resistance and endurance training on the liver tissue FNDC5 mRNA gene expression in male rats. Ann Appl Sport Sci 2017; 5(2): 51–60.
43. Shirvani H, Rahmati-Ahmadabad S. Irisin interaction with adipose tissue secretions by exercise training and flaxseed oil supplement. Lipids Health Dis 2019; 18(1): 1–9.
44. Uysal N, Yuksel O, Kizildag S, Yuce Z, Gumus H, Karakilic A, et al. Regular aerobic exercise correlates with reduced anxiety and incresed levels of irisin in brain and white adipose tissue. Neurosci Lett 2018; 676: 92–7.
45. Shykholeslami Z, Abdi A, Barari A, Hosseini SA. The effect of aerobic training with Citrus aurantium L. on SIRT1 and PGC-1agene expression levels in the liver tissue of elderly rats. Jorjani Biomed J 2019; 7(4): 57–65.
46. Ziegler A, Damgaard A, Mackey A, Schjerling P, Magnusson P, Olesen A, et al. An anti-inflammatory phenotype in visceral adipose tissue of old lean mice, augmented by exercise. Scientific Rep 2019; 9(1): 1–10.
47. Buechler C, Feder S, Haberl EM, Aslanidis C. Chemerin isoforms and activity in obesity. Int J Mol Sci 2019;
20(5): 1128.
48. Lin X, Yang Y, Qu J, Wang X. Aerobic exercise decreases chemerin/CMKLR1 in the serum and peripheral metabolic organs of obesity and diabetes rats by increasing PPARg. Nutr Metab 2019; 16(1): 1–13.
49. Mohammad P, Esfandiar KZ, Abbas S, Ahoora R. Effects of moderate-intensity continuous training and high- intensity interval training on serum levels of Resistin, Chemerin and liver enzymes in Streptozotocin- Nicotinamide induced Type-2 diabetic rats. J Diabetes Metab Disord 2019; 18(2): 379–87.
50. Wang S, Dougherty EJ, Danner RL. PPARgsignaling and emerging opportunities for improved therapeutics.
Pharmacol Res 2016; 111: 76–85.
51. S€unnetçi Silistre E, Hatipoglu HU. Increased serum circulating asprosin levels in children with obesity.
Pediatr Int 2020.
Physiology International108 (2021) 3, 383–397 397