O R I G I N A L I N V E S T I G A T I O N Open Access
Metabolic syndrome influences cardiac gene
expression pattern at the transcript level in male ZDF rats
Márta Sárközy1, Ágnes Zvara2, Nóra Gyémánt1, Veronika Fekete1, Gabriella F Kocsis1, Judit Pipis1,3, GergőSzűcs1, Csaba Csonka1,3, László G Puskás2, Péter Ferdinandy3,4and Tamás Csont1,3*
Abstract
Background:Metabolic syndrome (coexisting visceral obesity, dyslipidemia, hyperglycemia, and hypertension) is a prominent risk factor for cardiovascular morbidity and mortality, however, its effect on cardiac gene expression pattern is unclear. Therefore, we examined the possible alterations in cardiac gene expression pattern in male Zucker Diabetic Fatty (ZDF) rats, a model of metabolic syndrome.
Methods:Fasting blood glucose, serum insulin, cholesterol and triglyceride levels were measured at 6, 16, and 25 wk of age in male ZDF and lean control rats. Oral glucose tolerance test was performed at 16 and 25 wk of age.
At week 25, total RNA was isolated from the myocardium and assayed by rat oligonucleotide microarray for 14921 genes. Expression of selected genes was confirmed by qRT-PCR.
Results:Fasting blood glucose, serum insulin, cholesterol and triglyceride levels were significantly increased, glucose tolerance and insulin sensitivity were impaired in ZDF rats compared to leans. In hearts of ZDF rats, 36 genes showed significant up-regulation and 49 genes showed down-regulation as compared to lean controls.
Genes with significantly altered expression in the heart due to metabolic syndrome includes functional clusters of metabolism (e.g. 3-hydroxy-3-methylglutaryl-Coenzyme A synthase 2; argininosuccinate synthetase; 2-amino-3- ketobutyrate-coenzyme A ligase), structural proteins (e.g. myosin IXA; aggrecan1), signal transduction (e.g. activating transcription factor 3; phospholipase A2; insulin responsive sequence DNA binding protein-1) stress response (e.g. heat shock 70kD protein 1A; heat shock protein 60; glutathione S-transferase Yc2 subunit), ion channels and receptors (e.g. ATPase, (Na+)/K+transporting, beta 4 polypeptide; ATPase, H+/K+transporting, nongastric, alpha polypeptide). Moreover some other genes with no definite functional clusters were also changed such as e.g. S100 calcium binding protein A3; ubiquitin carboxy-terminal hydrolase L1; interleukin 18. Gene ontology analysis revealed several significantly enriched functional inter-relationships between genes influenced by metabolic syndrome.
Conclusions:Metabolic syndrome significantly alters cardiac gene expression profile which may be involved in development of cardiac pathologies in the presence of metabolic syndrome.
Keywords:Metabolic syndrome, Diabetes mellitus type 2, Hyperlipidemia, Myocardium, DNA microarray, Heart, GO analysis
* Correspondence:csont.tamas@med.u-szeged.hu
1Cardiovascular Research Group, Department of Biochemistry, Faculty of Medicine, University of Szeged, Szeged, Hungary
3Pharmahungary Group, Szeged, Hungary
Full list of author information is available at the end of the article
© 2013 Sárközy et al.; licensee BioMed Central Ltd. This is an Open Access article distributed under the terms of the Creative Commons Attribution License (http://creativecommons.org/licenses/by/2.0), which permits unrestricted use, distribution, and reproduction in any medium, provided the original work is properly cited.
Introduction
It is well established that metabolic syndrome is a major risk factor for cardiovascular diseases [1-4]. Metabolic syndrome is defined as the coexistence of visceral obesity, dyslipidemia, hyperglycemia, and hypertension [5,6]. Most individuals with metabolic syndrome have abdominal obesity and develop insulin resistance, therefore the preva- lence of metabolic syndrome and pre-diabetes overlap [7,8]. In addition, metabolic syndrome can be considered as a direct precursor state of diabetes mellitus type 2 [7,9] and cardiovascular diseases [7,10]. Moreover, the efficacy of car- dioprotective interventions (i.e. pre- and postconditioning) seems to be diminished in the presence of pathological conditions associated with metabolic syndrome [11-13]
such as obesity [14], diabetes [15-18] or dyslipidemia [19,20]. Metabolic syndrome affects a large population including all ages from children to elderly and both sexes worldwide [21-23]. According to the Third National Health and Nutrition Examination Survey (NHANES III) criteria, about 47 million people (approximately 24% of the US adult population) had metabolic syndrome in the USA in 2002 [24]. Its prevalence is raising both in developed [21,24], and in developing countries [21,24]. In addition, patients suffering from metabolic syndrome have an approximate 5-fold increase in diabetes risk compared with persons without metabolic syndrome [7,25]. The effect of metabolic syndrome on gene expression pattern in various tissue types has been investigated in a few studies. In insulin sensitive tissues (liver, skeletal muscle and adipose tissue) [26] and pancreatic β-cells [27] obtained from the well- known metabolic syndrome model (Zucker Diabetic Fatty rat, ZDF), altered gene expression pattern were shown when compared to their controls. However, the effect of metabolic syndrome on the gene expression pattern of the heart has not been investigated yet.
Therefore, our aim was in the present study to investi- gate the effect of metabolic syndrome on cardiac gene expression pattern in male ZDF rats.
Materials and methods
This investigation conforms to the National Institutes of Health Guide for the Care and Use of Laboratory Animals (NIH Pub. No. 85-23, Revised 1996) and was approved by the Animal Research Ethics Committee of the University of Szeged.
Male Zucker Diabetic Fatty (ZDF/Gmi-fa/fa) rats and their lean controls were obtained from Charles River La- boratories at the age of 5 weeks and were housed at 22±2°C with a 12:12-h light-dark cycle. The rats received Purina 5008 chow and water ad libitum for 20 weeks after their arrival.
The Zucker diabetic fatty (ZDF) rat with a point mutation in the leptin receptor is a recognized model of obesity, hyperlipidemia, hyperglycemia and hypertension [28-30]. In
the present study, only male rats were used, since female ZDF rats are less prone to the development of metabolic syndrome [31,32]. Male ZDF rats develop an age- dependent obese and hyperglycemic phenotype at 10-12 weeks of age accompanied by a metabolic state of obesity, dyslipidemia, hyperinsulinemia and insulin resistance [33,34] which develops to a hyperglycemic insulin-deficient state [33]. The metabolic features manifested in this animal model are in many ways similar to the pathogenesis of metabolic syndrome in humans [33,35]. Therefore, the ZDF rat is an ideal model for investigation of cardiac gene expression pattern changes related to human metabolic syndrome.
Experimental setup
Body weight, serum glucose, insulin, cholesterol and triglyceride levels and homeostasis model assessment- estimated insulin resistance (HOMA-IR) were determined at 6, 16 and 25 weeks of age in order to monitor the basic parameters of glucose and lipid metabolism and insulin resistance in ZDF and lean rats (Figure 1). Oral glucose tolerance test (OGTT) was performed at week 16 and 25 in order to further characterize glucose homeostasis in ZDF and lean rats (Figure 1). At 25 weeks of age, rats were anaesthetized using diethyl ether. Hearts and pancreata were isolated (Figure 1), and then hearts were perfused according to Langendorff as described earlier [36]. After 10 min perfusion ventricular tissue was frozen and stored at -80°C until DNA microarray investigation and gene expression analysis (Figure 1). To validate the well- known nitrosative stress-inducing effect of metabolic syndrome on the heart, frozen ventricular tissue was used for determination of cardiac free 3-nitrotyrosine level (Figure 1).
Serum glucose level measurements and OGTT
Rats were fasted overnight (12 h) prior to serum glucose level measurements (week 6, 16 and 25) and OGTTs (week16 and 25) to verify the development of hypergly- cemia as a diagnostic criterion of metabolic syndrome.
Blood samples were collected from the v. saphena. Blood glucose levels were measured using AccuCheck blood glu- cose monitoring systems (Roche Diagnostics Corporation, USA, Indianapolis). In case of OGTT, after the measure- ment of baseline glucose concentrations, a standard dose of glucose (1.5 g/kg body weight) was administered per os via gavage and plasma glucose levels were checked 30, 60 and 120 minutes later. Area under the curve values for OGTT was also calculated.
Measurement of serum and pancreatic insulin levels Serum and pancreatic insulin levels were measured by an enzyme immunoassay (Mercodia, Ultrasensitive Rat Insulin ELISA) in order to verify the development of
hyperinsulinemia and decreased pancreatic insulin content as a consequence of beta cell damage in metabolic syndrome. Insulin ELISA was carried out according to the instructions of the manufacturer from either sera or homogenized pancreatic tissue samples of ZDF and lean control rats. Sera were centrifuged (4500 rpm for 10 min at 4°C) and kept at -20°C until further investigation.
Pancreata were removed, trimmed free of adipose tissue and weighed. Pancreata were homogenized in 6 ml cold acidified-ethanol (0.7 M HCl: ethanol (1:3 v/v) with an Ultraturrax homogenizer and were kept at 4°C for 24 h.
Then pancreas homogenates were centrifuged (900 g for 15 min at 4°C), and the supernatants were stored at 4°C.
The pellet was extracted again with 3 ml acidified ethanol for 24 h at 4°C. The supernatant obtained after centrifugation was pooled with the previous one and kept at -20°C until assayed.
HOMA-IR index
To estimate insulin resistance in ZDF or lean rats the widely used HOMA-IR index was calculated [37-39]
by multiplying fasting plasma insulin (μIU/mL) with fasting plasma glucose (mmol/L), then dividing by the constant 22.5, i.e. HOMA-IR = (fasting plasma insulin concentration×fasting plasma glucose concen- tration)/22.5.
Measurement of serum lipid levels
Serum cholesterol and triglyceride levels were measured at week 6, 16 and 25 using a test kit supplied by Diagnosticum Zrt. (Budapest, Hungary) as described previously [40] in order to follow up the development of hyperlipidemia which is a diagnostic criterion of meta- bolic syndrome.
0 3 6 9
wk 6 wk 16 wk 25 Serum trigliceride (mmol/L)
B) C) D)
0 200 400 600
wk 6 wk 16wk 25
Animal weight (g)
F) E)
0 1 2 3 4
wk 6 wk 16wk 25 Serum cholesterol (mmol/L)
G)
Lean ZDF
Lean/ZDF
6 16 25wk BW, Se Glu, Insulin, Chol, TG
OGTT
Pancreatic insulin
# #
Heart isolation, DNA chip, 3-nitrotyrosine0 50 100 150 200 250
wk 6 wk 16 wk 25 HOMA IR (μlU/ml*mmol/l)
0 5 10 15
wk 6 wk 16 wk 25 Serum glucose (mmol/L)
0 5 10 15 20 25
wk 6 wk 16 wk 25 Serum insulin (μg/L)
A)
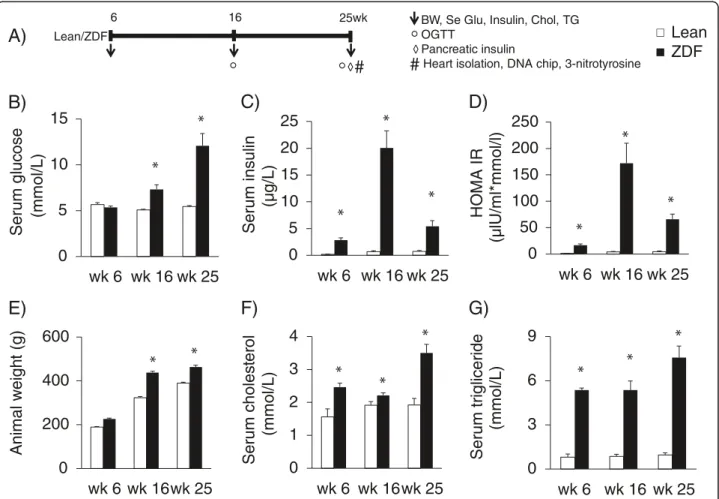
Figure 1Experimental protocol (A) Male Zucker Diabetic Fatty (ZDF) rats and their lean controls were followed up from 6 weeks of age until 25 weeks of age.Body weight (BW), serum glucose (Se Glu), insulin (Insulin), cholesterol (Chol) and triglyceride (TG) levels were determined at week 6, 16 and 25. Oral glucose tolerance test (OGTT) was performed at week 16 and 25. At week 25, hearts and pancreata were isolated. Pancreata were frozen and homogenized to measure pancreatic insulin levels. Hearts were perfused according to Langendorff for 10 minutes using Krebs-Henseleit buffer. Then ventricular tissue was frozen and used for DNA microarray analysis and cardiac free 3-nitrotyrosine level measurements. Serum glucose (B, n=6-8) and insulin levels (C, n=6-8), HOMA-IR (D), animal weight (E), serum cholesterol (F, n=6-8) and triglyceride (G, n=6-8) shown at week 6, 16 and 25 in both lean and ZDF rats. Solid line: Lean; dashed line: ZDF. Values are means±SEM, *p<0.05.
Cardiac 3-nitrotyrosine level, an indicator of myocardial nitrosative stress
To verify the well-known increased oxidative/nitrosative stress [41,42] in the heart in metabolic syndrome, cardiac free 3-nitrotyrosine level, an indirect marker of nitrosative stress, was measured by ELISA (Cayman Chemical) from ZDF and lean control heart tissue samples at week 25 as described earlier [40]. Briefly, supernatants of ventricular tissue homogenates were incubated overnight with anti- nitrotyrosine rabbit IgG specific to free 3-nitrotyrosine and nitrotyrosine acetylcholinesterase tracer in precoated (mouse anti-rabbit IgG) microplates followed by develop- ment with Ellman's reagent. Free nitrotyrosine content was normalized to protein content of the cardiac homogenate and expressed as nanograms per milligram protein [40].
RNA preparation
Total RNA was purified from whole heart of Zucker Diabetic Fatty (ZDF) and lean control rats (n=6-8 in each group) using an RNA isolation kit (Macherey-Nagel, Düren, Germany). All the preparation steps were carried out according to the manufacturer’s instructions. RNA samples were stored at–80°C in the presence of 30 U Prime RNAse
inhibitor (Fermentas, Lithuania) untill further analysis. The quantity of isolated RNA samples was checked by spectro- photometry (NanoDrop 3.1.0, Rockland, DE, USA).
DNA microarray analysis
Total RNAs (1μg) were first reverse transcribed in 10μl volume using Oligo(dT) Primer and ArrayScript enzyme as described previously [43]. Than the second cDNA strand was synthesized in 50μl final volume using DNA Polymerase and RNase H. Amino allyl modified aRNA were than synthesized by In Vitro Transcription using aaUTP and T7 Enzyme mix. All these steps were done using AminoAllyl MessageAmpTM II aRNA Amplifica- tion Kit (Ambion, USA), according to manufacturer’s instructions. Sixμg of amino allyl modified amplified RNA were labeled with either Cy5 or Cy3 dyes in 10μl volume according to the manufacturer’s instructions (Ambion, USA), than purified using RNA purification columns (Macherey Nagel, Düren, Germany).
Rat microarray of 8-plex format from Agilent Tech- nologies (Palo Alto, CA, USA) was used to determine gene expression changes in the hearts of ZDF rats com- pared to lean controls. Each matrix contains ~15.000 0
10 20 30
0 30 60 90 120
OGTT, serum glucose (mmol/L)
Time (min)
0 10 20 30
0 30 60 90 120
OGTT, serum glucose (mmol/L)
Time (min)
A)
week 16B)
week 25ZDF
ZDF
lean lean
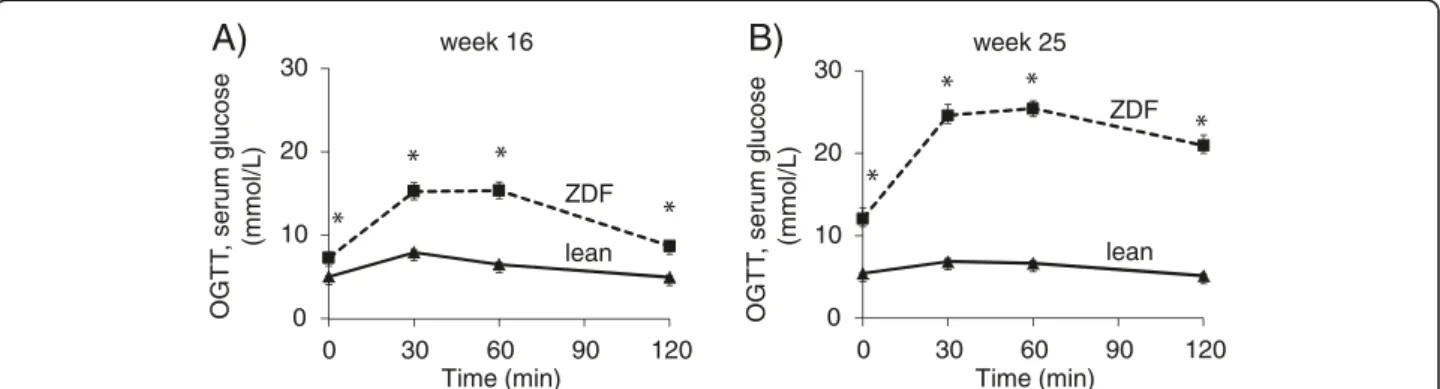
Figure 2Glucose levels during OGTT.Glucose levels during OGTT at week 16 (A) and week 25 (B) in both lean and ZDF rats. Solid line: Lean;
dashed line: ZDF. Values are means±SEM, n=6-8, *p<0.05.
A) B)
0 400 800 1200
Lean ZDF
Pancreas weight (mg)
*
0 5 10
Lean ZDF
Pancreatic insulin (μg/mg protein)
*
Figure 3Pancreas weight and pancreas insulin content.Pancreas weight (A) at week 25 and pancreatic insulin content (B) in both lean and ZDF rats. Values are means±SEM, n=6-8, *p<0.05.
oligonucleotides corresponding to different genes and control sequences. 300 ng of Cy5 and Cy3 labeled RNA in 19 μl volume, 5 μl 10X Blocking Agent and 1 μl 25X Fragmentation Buffer were mixed together and incubated at 60°C for 30 minutes. 25 μl 2X GEx Hybridization Buffer were added to each sample, to stop the fragmentation reaction. All these steps were done using Gene expression hybridization kit (Agilent Technologies, Palo Alto, CA). 48 μl of these mixes were used for the hybridization, which was done in microarray hybridization chambers (Agilent Technologies, Palo Alto, CA). The chambers were then loaded into a hybridization rotator rack (~5 rpm) and incubated at 65°C for 17 hours. After hybridization the slides were washed in Wash buffer 1 from Agilent Technologies at room temperature for 1 minute than in Wash buffer 2 at 37°C for another 1 minutes before scanning. Each array was scanned at 543 nm (for Cy3 labeling) or at 633 nm (for Cy5 labeling) in Agilent Scanner using the built-in Extended Dynamic Range function with 5 μm reso- lution. Output image analysis and feature extraction was done using Feature Extraction 9.5.1 software of Agilent Technologies.
Quantitative real-time PCR (QRT-PCR)
In order to validate gene expression changes obtained by DNA microarray, QRT-PCR was performed on a RotorGene 3000 instrument (Corbett Research, Sydney, Australia) with gene-specific primers and SybrGreen protocol to monitor gene expression as described earlier [44,45]. Briefly, 2μg of total RNA was reverse transcribed using the High-Capacity cDNA Archive Kit (Applied Biosystems Foster City, CA, USA) according to the manu- facturer’s instructions in a final volume of 30μL. After dilu- tion with 30μL of water, 1μL of the diluted reaction mix was used as template in the QRT- PCR with FastStart SYBR Green Master mix (Roche Applied Science, Mannheim, Germany) with the following protocol: 10 min at 95°C fol- lowed by 45 cycles of 95°C for 15 sec, 60°C for 25 sec and 72°C for 25 sec. The fluorescence intensity of SybrGreen dye was detected after each amplification step. Melting temperature analysis was done after each reaction to check the quality of the products. Primers were designed using the online Roche Universal Probe Library Assay Design Center. The quality of the primers was verified by MS analysis provided by Bioneer (Daejeon, Korea). Relative expression ratios were calculated as normalized ratios to rat HPRT, GAPDH and Cyclophyllin genes. Non-template control sample was used for each PCR run to check primer-dimer formation. The final relative gene expres- sion ratios were calculated as delta-delta Ct values. Fold change refers to 2-ΔΔCt(in the case of up-regulated genes) and–(1/2-ΔΔCt) (in the case of down-regulated genes).
Gene ontology (GO) analysis
By using DNA microarrays for transcriptional profiling a large number of genes can be analyzed simultaneously [46], however, resulting data do not give direct information about biological interaction of the differentially expressed genes. GO analysis is a suitable method for integration genes with pathways and biological interaction networks to detect coordiated changes in functionally related genes. GO analysis was performed using GO/pathway analysis using the open access software DAVID bioinformatics system and database (Database for Annotation, Visualization and Integrated Discovery, http://david.abcc.ncifcrf.gov). The differentially expressed genes were submitted to DAVID bioinformatics system and database to reveal significantly enriched biological functions/pathways.
Statistical analysis
For characterization of the ZDF model and lean controls, all values (body weight, serum glucose, insulin, HOMA-IR, cholesterol and triglyceride levels, pancreas weight and insulin content and myocardial 3-nitrotyrosine levels) are presented as mean±SEM. Significance between groups was determined with two sample t-test. P<0.05 was accepted as a statistically significant difference.
In the microarray experiments, dye swap parallel labeling was applied to eliminate dye induced biases. Biological and technical replica experiments were carried out to gain raw data for statistical analysis. Altogether 4 individual parallel gene activity comparisons were done. Statistical analysis was performed to get reliable data. Using two tailed two sample unequal variance Student t-test, the p-value was
0 1 2 3
My oc ar dial 3-nitr otyr osine (ng/m g pr ot ein)
*
Lean ZDF
Figure 4Myocardial 3-nitrotyrosine level.Myocardial 3- nitrotyrosine level at week 25 in both lean and ZDF rats. Values are means±SEM, *p<0.05.
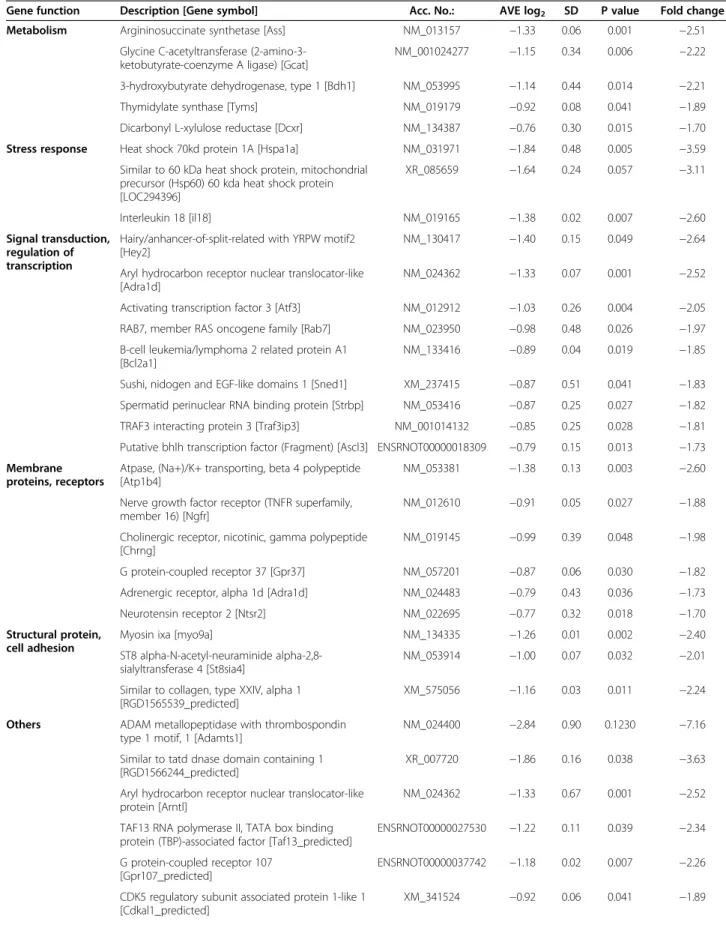
Table 1 Down-regulated genes on DNA microarray
Gene function Description [Gene symbol] Acc. No.: AVE log2 SD P value Fold change
Metabolism Argininosuccinate synthetase [Ass] NM_013157 −1.33 0.06 0.001 −2.51
Glycine C-acetyltransferase (2-amino-3- ketobutyrate-coenzyme A ligase) [Gcat]
NM_001024277 −1.15 0.34 0.006 −2.22
3-hydroxybutyrate dehydrogenase, type 1 [Bdh1] NM_053995 −1.14 0.44 0.014 −2.21
Thymidylate synthase [Tyms] NM_019179 −0.92 0.08 0.041 −1.89
Dicarbonyl L-xylulose reductase [Dcxr] NM_134387 −0.76 0.30 0.015 −1.70 Stress response Heat shock 70kd protein 1A [Hspa1a] NM_031971 −1.84 0.48 0.005 −3.59
Similar to 60 kDa heat shock protein, mitochondrial precursor (Hsp60) 60 kda heat shock protein [LOC294396]
XR_085659 −1.64 0.24 0.057 −3.11
Interleukin 18 [il18] NM_019165 −1.38 0.02 0.007 −2.60
Signal transduction, regulation of transcription
Hairy/anhancer-of-split-related with YRPW motif2 [Hey2]
NM_130417 −1.40 0.15 0.049 −2.64
Aryl hydrocarbon receptor nuclear translocator-like [Adra1d]
NM_024362 −1.33 0.07 0.001 −2.52
Activating transcription factor 3 [Atf3] NM_012912 −1.03 0.26 0.004 −2.05 RAB7, member RAS oncogene family [Rab7] NM_023950 −0.98 0.48 0.026 −1.97 B-cell leukemia/lymphoma 2 related protein A1
[Bcl2a1]
NM_133416 −0.89 0.04 0.019 −1.85
Sushi, nidogen and EGF-like domains 1 [Sned1] XM_237415 −0.87 0.51 0.041 −1.83 Spermatid perinuclear RNA binding protein [Strbp] NM_053416 −0.87 0.25 0.027 −1.82 TRAF3 interacting protein 3 [Traf3ip3] NM_001014132 −0.85 0.25 0.028 −1.81 Putative bhlh transcription factor (Fragment) [Ascl3] ENSRNOT00000018309 −0.79 0.15 0.013 −1.73 Membrane
proteins, receptors
Atpase, (Na+)/K+ transporting, beta 4 polypeptide [Atp1b4]
NM_053381 −1.38 0.13 0.003 −2.60
Nerve growth factor receptor (TNFR superfamily, member 16) [Ngfr]
NM_012610 −0.91 0.05 0.027 −1.88
Cholinergic receptor, nicotinic, gamma polypeptide [Chrng]
NM_019145 −0.99 0.39 0.048 −1.98
G protein-coupled receptor 37 [Gpr37] NM_057201 −0.87 0.06 0.030 −1.82
Adrenergic receptor, alpha 1d [Adra1d] NM_024483 −0.79 0.43 0.036 −1.73
Neurotensin receptor 2 [Ntsr2] NM_022695 −0.77 0.32 0.018 −1.70
Structural protein, cell adhesion
Myosin ixa [myo9a] NM_134335 −1.26 0.01 0.002 −2.40
ST8 alpha-N-acetyl-neuraminide alpha-2,8- sialyltransferase 4 [St8sia4]
NM_053914 −1.00 0.07 0.032 −2.01
Similar to collagen, type XXIV, alpha 1 [RGD1565539_predicted]
XM_575056 −1.16 0.03 0.011 −2.24
Others ADAM metallopeptidase with thrombospondin type 1 motif, 1 [Adamts1]
NM_024400 −2.84 0.90 0.1230 −7.16
Similar to tatd dnase domain containing 1 [RGD1566244_predicted]
XR_007720 −1.86 0.16 0.038 −3.63
Aryl hydrocarbon receptor nuclear translocator-like protein [Arntl]
NM_024362 −1.33 0.67 0.001 −2.52
TAF13 RNA polymerase II, TATA box binding protein (TBP)-associated factor [Taf13_predicted]
ENSRNOT00000027530 −1.22 0.11 0.039 −2.34
G protein-coupled receptor 107 [Gpr107_predicted]
ENSRNOT00000037742 −1.18 0.02 0.007 −2.26
CDK5 regulatory subunit associated protein 1-like 1 [Cdkal1_predicted]
XM_341524 −0.92 0.06 0.041 −1.89
determined and used to find the significant gene expression changes. Gene expression ratio with p- value < 0.05 and log2 ratio < -0.75 or log2 ratio > 0.75 (~1.7 fold change) are considered as repression or overexpression respectively in gene activity.
Results
Characterization of metabolic syndrome
In order to verify the development of metabolic syndrome in male ZDF rats, concentrations of several plasma metabo- lites and body weight were measured at week 6, 16 and 25 (Figure 1). ZDF rats showed a significant rise in serum fasting glucose level starting from week 16 as compared to lean controls (Figure 1B). Parallel with hyperglycemia, serum insulin levels were significantly increased in ZDF rats compared to lean ones during the 25 weeks showing the presence of hyperinsulinemia in ZDF animals (Figure 1C).
However, serum insulin concentration in ZDF rats was significantly lower at week 25 as compared to serum insulin level measured at week 16 indicating beta-cell damage.
HOMA IR was significantly higher at week 6, 16 and 25 in ZDF rats when compared to lean controls showing insulin
resistance in ZDF animals (Figure 1D). Body weight increased throughout the study and was significantly higher in ZDF animals compared to lean ones showing obesity (Figure 1E). Both serum cholesterol and triglyceride levels were significantly increased in ZDF rats as compared to lean ones throughout the study duration representing hyperlipidemia (Figure 1F and 1G). Oral glucose tolerance test (OGTT) was performed at week 16 and 25 in order to verify the development of impaired glucose tolerance in ZDF rats. Glucose levels during OGTTs were markedly increased in ZDF rats in every time point of blood glucose measurements both at weeks 16 and 25 (Figure 2A-2B).
Area under the curve (AUC) of blood glucose concen- tration during OGTTs was significantly elevated in ZDF rats at both weeks 16 and 25 (1520±96 vs. 757±13 and 2692±129 vs. 741±21, respectively) representing impaired glucose tolerance.
Pancreas weight and pancreatic insulin content were measured at the end of the experiment in order to investigate the severity of diabetes mellitus in ZDF rats. Pancreas weight and pancreatic insulin concen- tration were significantly decreased in ZDF rats at Table 1 Down-regulated genes on DNA microarray(Continued)
Similar to chondroitin beta1,4 N- acetylgalactosaminyltransferase 2 [RGD1563660_predicted]
ENSRNOT00000019778 −0.91 0.03 0.017 −1.87
S100 calcium binding protein A3 [S100a3] NM_053681 −0.90 0.06 0.028 −1.87 Similar to TPR repeat-containing protein KIAA1043
[LOC304558]
XM_222260 −0.89 0.08 0.003 −1.85
Similar to Ten-m4 [Odz4_predicted] ENSRNOT00000015181 −0.88 0.34 0.047 −1.84 Kallikrein 14 [Klk14_predicted] ENSRNOT00000029197 −0.88 0.09 0.047 −1.84
Mucin 19 [Muc19_predicted] XM_235593 −0.84 0.33 0.048 1.79
Copine family member IX [Cpne9] NM_001024982 −0.84 0.11 0.006 −1.79
Suppressor of Ty 16 homolog (S. Cerevisiae) [Supt16h_predicted]
XM_223981 −0.81 1.57 0.021 −1.75
Heterogeneous nuclear ribonucleoprotein L-like [Hnrpll_predicted]
XM_233805 −0.81 0.01 0.008 −1.75
Cdna clone UI-R-BJ0p-afn-b-03-0-UI 3' [Sln] CK841541 −0.81 0.30 0.013 −1.75 Discs, large homolog 4 (Drosophila) [Dlgh4] NM_019621 −0.80 0.23 0.026 −1.75 Similar to chondroitin beta1,4 N-
acetylgalactosaminyltransferase [RGD1307618_predicted]
XM_224757 −0.80 0.25 0.031 −1.74
Sterile alpha motif domain containing 4 [Samd4_predicted]
ENSRNOT00000060847 −0.80 0.02 0.012 −1.74
Similar to RIKEN cdna 1190005B03 [Cdkal1_predicted]
ENSRNOT00000024854 −0.79 0.06 0.035 −1.73
WDNM1 homolog [LOC360228] NM_001003706 −0.78 0.24 0.007 −1.72
CD300 antigen like family member E [Cd300le_predicted]
XR_009489 −0.78 0.362 0.023 −1.71
Neuronatin [nnat] NM_053601 −0.77 0.35 0.022 −1.71
Connective tissue growth factor [Ctgf] NM_022266 −0.77 0.47 0.049 −1.69 Chemokine (C-X-C motif) ligand 11 [Cxcl11] NM_182952 −0.75 0.17 0.003 −1.68
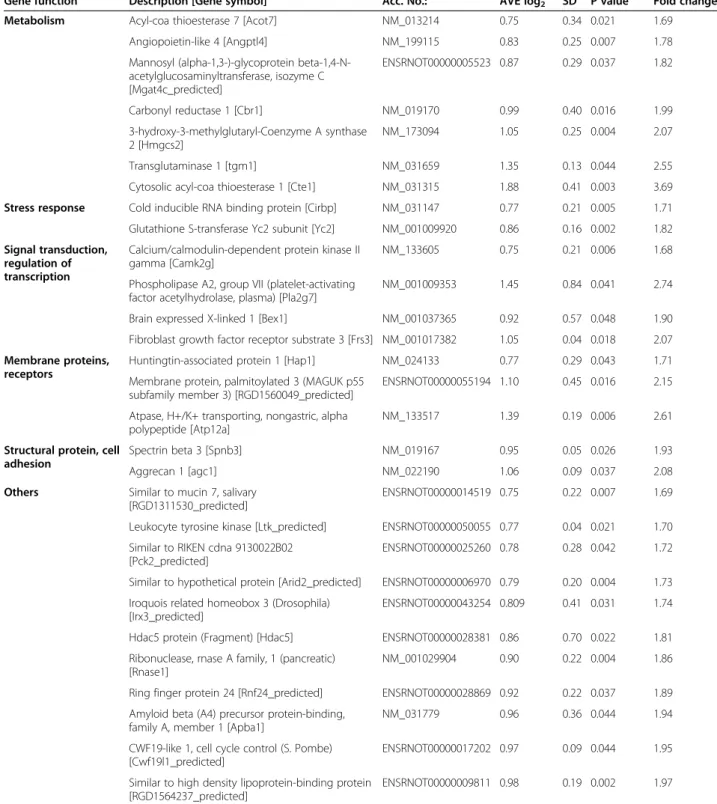
Table 2 Up-regulated genes on DNA microarray
Gene function Description [Gene symbol] Acc. No.: AVE log2 SD P value Fold change
Metabolism Acyl-coa thioesterase 7 [Acot7] NM_013214 0.75 0.34 0.021 1.69
Angiopoietin-like 4 [Angptl4] NM_199115 0.83 0.25 0.007 1.78
Mannosyl (alpha-1,3-)-glycoprotein beta-1,4-N- acetylglucosaminyltransferase, isozyme C [Mgat4c_predicted]
ENSRNOT00000005523 0.87 0.29 0.037 1.82
Carbonyl reductase 1 [Cbr1] NM_019170 0.99 0.40 0.016 1.99
3-hydroxy-3-methylglutaryl-Coenzyme A synthase 2 [Hmgcs2]
NM_173094 1.05 0.25 0.004 2.07
Transglutaminase 1 [tgm1] NM_031659 1.35 0.13 0.044 2.55
Cytosolic acyl-coa thioesterase 1 [Cte1] NM_031315 1.88 0.41 0.003 3.69 Stress response Cold inducible RNA binding protein [Cirbp] NM_031147 0.77 0.21 0.005 1.71 Glutathione S-transferase Yc2 subunit [Yc2] NM_001009920 0.86 0.16 0.002 1.82 Signal transduction,
regulation of transcription
Calcium/calmodulin-dependent protein kinase II gamma [Camk2g]
NM_133605 0.75 0.21 0.006 1.68
Phospholipase A2, group VII (platelet-activating factor acetylhydrolase, plasma) [Pla2g7]
NM_001009353 1.45 0.84 0.041 2.74
Brain expressed X-linked 1 [Bex1] NM_001037365 0.92 0.57 0.048 1.90
Fibroblast growth factor receptor substrate 3 [Frs3] NM_001017382 1.05 0.04 0.018 2.07 Membrane proteins,
receptors
Huntingtin-associated protein 1 [Hap1] NM_024133 0.77 0.29 0.043 1.71 Membrane protein, palmitoylated 3 (MAGUK p55
subfamily member 3) [RGD1560049_predicted]
ENSRNOT00000055194 1.10 0.45 0.016 2.15
Atpase, H+/K+ transporting, nongastric, alpha polypeptide [Atp12a]
NM_133517 1.39 0.19 0.006 2.61
Structural protein, cell adhesion
Spectrin beta 3 [Spnb3] NM_019167 0.95 0.05 0.026 1.93
Aggrecan 1 [agc1] NM_022190 1.06 0.09 0.037 2.08
Others Similar to mucin 7, salivary [RGD1311530_predicted]
ENSRNOT00000014519 0.75 0.22 0.007 1.69
Leukocyte tyrosine kinase [Ltk_predicted] ENSRNOT00000050055 0.77 0.04 0.021 1.70 Similar to RIKEN cdna 9130022B02
[Pck2_predicted]
ENSRNOT00000025260 0.78 0.28 0.042 1.72
Similar to hypothetical protein [Arid2_predicted] ENSRNOT00000006970 0.79 0.20 0.004 1.73 Iroquois related homeobox 3 (Drosophila)
[Irx3_predicted]
ENSRNOT00000043254 0.809 0.41 0.031 1.74
Hdac5 protein (Fragment) [Hdac5] ENSRNOT00000028381 0.86 0.70 0.022 1.81 Ribonuclease, rnase A family, 1 (pancreatic)
[Rnase1]
NM_001029904 0.90 0.22 0.004 1.86
Ring finger protein 24 [Rnf24_predicted] ENSRNOT00000028869 0.92 0.22 0.037 1.89 Amyloid beta (A4) precursor protein-binding,
family A, member 1 [Apba1]
NM_031779 0.96 0.36 0.044 1.94
CWF19-like 1, cell cycle control (S. Pombe) [Cwf19l1_predicted]
ENSRNOT00000017202 0.97 0.09 0.044 1.95
Similar to high density lipoprotein-binding protein [RGD1564237_predicted]
ENSRNOT00000009811 0.98 0.19 0.002 1.97
week 25 showing impaired pancreatic function (Figure 3A and 3B).
In order to verify the increased oxidative/nitrosative stress in ZDF animals, myocardial 3-nitrotyrosine levels were determined in both groups at week 25. A marker molecule of peroxynitrite, 3-nitrotyrosine level was sig- nificantly elevated in the heart of ZDF animals showing increased cardiac oxidative/nitrosative stress (Figure 4).
Gene expression profiles measured using cDNA microarrays and by qRT-PCR
Among the 14921 genes surveyed, 10244 genes were expressed on the cDNA microarray, and 85 genes whose expression was > ~1.7-fold up- or down-regulated (log2 ratio <-0.75 or log2 ratio >0.75) in hearts of ZDF rats rela- tive to levels of lean control rats showed significant change in expression. According to our results, 49 genes showed down-regulation (Table 1) and 36 genes showed up- regulation in hearts of ZDF rats (Table 2). The expression change of selected 23 genes was validated by qRT-PCR (Table 3 and 4), 18 of these 23 genes have been confirmed by qRT-PCR (Table 3). Most of these genes have not been shown to be involved in the development of cardiovascular complications of metabolic syndrome yet.
Gene ontology analysis
In order to further determine the biological significance and functional classification of differentially expressed genes due to metabolic syndrome, GO analysis was performed (Table 5). GO is a bioinformatics initiative with the aim of standardizing the representation of genes and gene products providing a controlled and regularly updated vocabulary of terms for gene product characteristics and annotation data. GO analysis is suitable for identifying sig- nificantly enriched GO terms related to multiple genes and for discovering enriched functionally related gene groups. A single gene can belong to different categories. Out of the 85 genes significantly altered by metabolic syndrome in our present study, 68 genes with known function were submit- ted to GO analysis. The rest of the 85 genes were either un- known expressed sequence tags or unrecognized by the GO analysis database. The 68 analyzed genes were classified
into three main categories such as (i) cellular metabolic process, (ii) developmental process and (iii) localization including transport (Table 5).
Discussion
In the present study, our aim was to investigate whether cardiac gene expression is influenced by metabolic syn- drome. Here we show several characteristics of metabolic syndrome in 25 weeks old male ZDF rats including obesity, fasting hyperglycemia, hyperlipidemia, hyperinsulinemia, insulin resistance, and impaired glucose tolerance as well as increased cardiac nitrosative stress. In the present study, we demonstrate for the first time in the literature that meta- bolic syndrome influences cardiac gene expression pattern by altering transcript levels of several genes. We identified 85 genes which were differentially expressed dominantly in the myocardium [47,48] of ZDF rats compared to normal controls. Many of these differentially expressed genes are known to be involved in multiple cell functions, including metabolism, stress response, signal transduction, regulation of transcription, cytoskeletal structure, cell adhesion, mem- brane proteins, receptors and others. The majority of these genes have not been related to metabolic syndrome yet, and therefore, characterization of the functional effects of these genes on the heart in metabolic syndrome is sug- gested in future mechanistic studies.
Our present findings showing that 25 week old male ZDF rats develop insulin resistance with hyperinsuline- mia, hyperglycemia and impaired HOMA-index are in accordance with previous studies [32-34,49,50]. Both metabolic syndrome and type 2 diabetes mellitus are associated with insulin resistance, hyperinsulinemia and hyperglycemia. Insulin resistance has been reported to be influenced by certain genetic factors and nutrients in patients suffering from metabolic syndrome [51]. It has been proposed that myocardial SERCA2a overexpression stimulated by hyperinsulinemia plays an important role in the cardiac adaptation in ZDF animals [52]. Others have shown that GLUT4 content decreases along with the development of insulin resistance in the myocardium and other insulin sensitive tissues which might play a key role in the impaired glycemic homeostasis in Table 2 Up-regulated genes on DNA microarray(Continued)
P21 (CDKN1A)-activated kinase 6 [Pak6_predicted] ENSRNOT00000010471 0.10 0.08 0.036 2.00 Similar to nuclear body associated kinase 1a
[Hipk2_predicted]
XM_342662 1.06 0.66 0.049 2.09
Cationic trypsinogen [LOC286911] NM_173127 1.08 0.07 0.031 2.11
Chac, cation transport regulator-like 1 (E. Coli) [RGD1560049_predicted]
XM_342497 1.10 0.08 0.033 2.15
NTAK alpha2 [Nrg2] D89996 1.13 0.10 0.042 2.18
Ubiquitin carboxy-terminal hydrolase L1 [Uchl1] NM_017237 1.24 0.26 0.014 2.37
Claudin 19 [cldn19] NM_001008514 1.43 0.12 0.037 2.70
metabolic syndrome [53]. Interestingly, hyperglycemia has been reported to activate p53 and p53-regulated genes involving the local renin-angiotensin system which leads to increased apoptosis of cardiomyocytes [54].
Moreover, postprandial hyperglycemia has been shown to play an important role on the onset and development of heart failure in humans [55]. Chronic hyperglycemia has been reported to enhance the vasoconstrictor re- sponse by Rho-kinase [56]. Hyperglycemia itself has
been shown to increase rat aortic smooth muscle cell growth and gene expression in diabetes mellitus [57].
Some drugs e.g. statins [57] and nitrates [58] have been reported to abolish hyperglycemia induced vasoconstric- tion. These aforementioned studies, in agreement with our present study, suggest that metabolic serum para- meters may influence cardiac gene expression pattern and may lead to functional consequences. Although we have not measured blood pressure in our study, ZDF Table 3 QRT-PCR
Description [Gene symbol] Acc. No.: DNA MICROARRAY QRT-PCR Confirmed
Fold change p value Ratio (SD) Fold change Regulation ADAM metallopeptidase with
thrombospondin type 1 motif, 1 [Adamts1]
NM_024400 −7.16 0.1295 0.58 (0.09) −1.72 down yes
heat shock 70kD protein 1A [Hspa1a] NM_031971 −3.59 0.0045 0.34 (0.06) −2.94 down yes
similar to 60 kDa heat shock protein mitochondrial precursor [Hsp60]
XR_085659 −3.11 0.0565 0.64 (0.10) −1.56 down yes
interleukin 18 [Il18] NM_019165 −2.60 0.0066 0.91 (0.15) −1.10 no change no
ATPase, (Na+)/K+ transporting, beta 4 polypeptide [Atp1b4]
NM_053381 −2.60 0.0031 0.37 (0.06) −2.70 down yes
argininosuccinate synthetase [Ass] NM_013157 −2.51 0.0007 0.29 (0.05) −3.42 down yes
myosin IXA [Myo9a] NM_134335 −2.40 0.0018 0.90 (0.15) −1.11 no change no
glycine C-acetyltransferase (2-amino-3- ketobutyrate-coenzyme A ligase) [Gcat]
NM_001024277 −2.22 0.0063 0.33 (0.03) −3.07 down yes
activating transcription factor 3 [Atf3] NM_012912 −2.05 0.0044 0.35 (0.06) −2.85 down yes similar to chondroitin sulfate GalNAcT-
2 [RGD1563660_predicted]
ENSRNOT00000019778 −1.87 0.0170 0.92 (0.15) −1.09 no change no
S100 calcium binding protein A3 [S100a3]
NM_053681 −1.87 0.0281 1.74 (0.28) 1.74 up no
sushi, nidogen and EGF-like domains 1 [Sned1]
NM_001167842 −1.83 0.0407 0.42 (0.07) −2.36 down yes
G protein-coupled receptor 37 [Gpr37] NM_057201 −1.82 0.0297 1.08 (0.18) 1.08 no change no
angiopoietin-like 4 [Angptl4] NM_199115 1.78 0.0073 2.90 (0.47) 2.90 up yes
glutathione S-transferase Yc2 subunit [Yc2]
NM_001009920 1.82 0.0017 2.21 (0.36) 2.21 up yes
ribonuclease, RNase A family, 1 (pancreatic) [Rnase1]
NM_001029904 1.86 0.0039 2.68 (0.44) 2.68 up yes
similar to high density lipoprotein- binding protein [RGD1564237_predicted]
ENSRNOT00000009811 1.97 0.0020 2.73 (0.44) 2.73 up yes
3-hydroxy-3-methylglutaryl-Coenzyme A synthase 2[Hmgcs2]
NM_173094 2.07 0.0036 2.42 (0.39) 2.42 up yes
similar to tetracycline transporter-like protein [RGD1311900_predicted]
ENSRNOT00000017386 2.24 0.1671 1.29 (0.21) 1.29 no change no
ubiquitin carboxy-terminal hydrolase L1 [Uchl1]
NM_017237 2.37 0.0144 2.50 (0.41) 2.50 up yes
ATPase, H+/K+ transporting, nongastric, alpha polypeptide [Atp12a]
NM_133517 2.61 0.0061 3.06 (0.50) 3.06 up yes
phospholipase A2, group VII (platelet- activating factor acetylhydrolase,
plasma) [Pla2g7]
NM_001009353 2.74 0.0411 4.25 (0.69) 4.25 up yes
cytosolic acyl-CoA thioesterase 1 [Cte1] NM_031315 3.69 0.0028 3.16 (0.51) 3.16 up yes
rats are well known to develop elevated blood pres- sure at ages similar to that of used in the present study [59-61]
In our present study, several genes related to metabol- ism were found to be affected in the hearts of ZDF rats as compared to controls. A group of these altered genes is involved in ketone body metabolism (down-regulation of 3-hydroxybutyrate dehydrogenase, type 1;up-regulation of 2-amino-3-ketobutyrate-coenzyme A ligase and 3-hydroxy- 3-methylglutaryl-coenzyme A synthase 2). Decreased rate of ketone body oxidation and decreased activity of 3- hydroxybutyrate dehydrogenase activity in streptozotocin- induced diabetic rat hearts have been shown previously [62]. In our present study, metabolic syndrome also influenced expression of genes related to metabolism of carbohydrates (down-regulation ofdicarbonyl L-xylulose reductase and up-regulation of mannosyl (alpha-1,3-)-
glycoprotein beta-1,4-N-acetylglucosaminyltransferase, isozyme C, pred)as well as lipids (up-regulation ofacyl- CoA thioesterase 1 and cytosolic acyl-CoA thioesterase 1). Similarly to our present findings, gene expression of cytosolic acyl-CoA thioesterase 1 has been reported to be up-regulated by high fat diet [63] or STZ-induced diabetes [63] in the rat myocardium. A third group of differentially expressed metabolic genes in our present study (down-regulation of argininosuccinate synthetase andup-regulation of angiopoietin-like 4)in ZDF hearts is potentially regulated by oxidative and nitrosative stress which is increased in metabolic diseases e.g.
hyperlipidemia [13,40,64], hypertension [65], insulin resistance [66], diabetes mellitus [67] and in the heart of ZDF rats as shown in previous [42] as well as in the present study. High TNF-alpha concentrations [68] and insulin resistance [69,70] in endothelial cells have been Table 4 Primers to QRT-PCR
Gene symbol Gene description Acc. No.: Forward Reverse
Adamts1 ADAM metallopeptidase with thrombospondin type 1 motif, 1
NM_024400 aaaggcattggctacttctttg ggactacagggagtgccatc
Hspa1a heat shock 70kD protein 1A (Hspa1a) NM_031971 tggcccattaaataagaaccaa cgaaggcgtagagattccag Hsp60 similar to 60 kDa heat shock protein,
mitochondrial precursor (Hsp60)
XR_085659 gctacaatttctgcaaacagagac cattaggggttttcccatcc
Il18 interleukin 18 (Il18) NM_019165 gcctgatatcgaccgaaca ccttccatccttcacagatagg
Atp1b4 ATPase, (Na+)/K+ transporting, beta 4 polypeptide (Atp1b4)
NM_053381 acttggcagcgttatgtcatt catttcctcttgaagactgtcattat
Ass argininosuccinate synthetase (Ass) NM_013157 ccaccggcttcatcaatatc tgctctgaaggcgatggta
Myo9a myosin IXA (Myo9a) NM_134335 cactctgagctagggcctgt actgaagaaaatcgttgtgacg
Gcat glycine C-acetyltransferase (2-amino-3- ketobutyrate-coenzyme A ligase) (Gcat)
NM_001024277 gctggcctcatttctactcg gcgggctatcttggcttc
Atf3 activating transcription factor 3 NM_012912 tgtcagtcaccaagtctgaggt cacttggcagcagcaattt RGD1563660_pred similar to chondroitin sulfate GalNAcT-2 (pred) NM_001106616 tcgtctatgccaaccagga tctccaaaaaccagagtccttt
S100a3 S100 calcium binding protein A3 NM_053681 agcagcagcagcagttga ggtacacacgatggcagcta Sned1 sushi, nidogen and EGF-like domains 1 (Sned1) NM_001167842 cctggtaccgtgtgaccttc caccgtttggaatgtgttga Gpr37 G protein-coupled receptor 37 NM_057201 ccaagaagtggcttttggaa agtgacacccagagaagctacc
Angptl4 angiopoietin-like 4 NM_199115 tctccaccatttttggtcaac gttcaggcgtctctgaatcac
Yc2 glutathione S-transferase Yc2 subunit NM_001009920 tctgaaaactcgggatgacc accagcttcatcccgtca Rnase1 ribonuclease, RNase A family, 1 (pancreatic) NM_001029904 actgactgccgcctgaag ttctggctgtcagtggttgt RGD1311900_pred
RGD
similar to tetracycline transporter-like protein ENSRNOT00000017386 gcactcactgcctatgttgg cctggagaaccatagctgga
RGD1564237_pred RGD
similar to high density lipoprotein-binding protein
ENSRNOT00000009811 ggaggagaccaacatgatcc agcacttggcagaagtagcac
Hmgcs2 3-hydroxy-3-methylglutaryl-Coenzyme A synthase 2
NM_173094 cctggcctcacttctctcc ggagaaggctccaatcctg
Uchl1 ubiquitin carboxy-terminal hydrolase L1 NM_017237 attcaggcagcccatgact gaaattcactttgtcgtctaccc Atp12a ATPase, H+/K+ transporting, nongastric, alpha
polypeptide
NM_133517 gcatcattgtggctaacgtg ccgtcagtgacagggtaaca
Pla2g7 phospholipase A2, group VII (platelet-activating factor acetylhydrolase
NM_001009353 actggcaagacccttcttttt gacatcaccgattggagctt
Cte1 cytosolic acyl-CoA thioesterase 1 NM_031315 gtgcacgagcgtcacttc gaaagggcccaggttctg
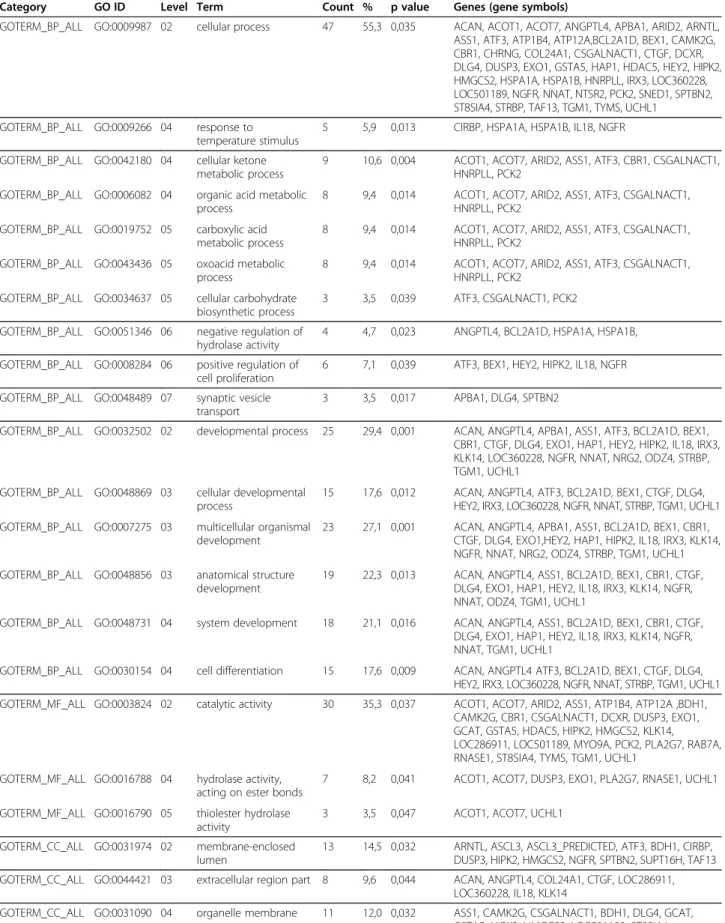
Table 5 Gene ontology analysis
Category GO ID Level Term Count % p value Genes (gene symbols)
GOTERM_BP_ALL GO:0009987 02 cellular process 47 55,3 0,035 ACAN, ACOT1, ACOT7, ANGPTL4, APBA1, ARID2, ARNTL, ASS1, ATF3, ATP1B4, ATP12A,BCL2A1D, BEX1, CAMK2G, CBR1, CHRNG, COL24A1, CSGALNACT1, CTGF, DCXR, DLG4, DUSP3, EXO1, GSTA5, HAP1, HDAC5, HEY2, HIPK2, HMGCS2, HSPA1A, HSPA1B, HNRPLL, IRX3, LOC360228, LOC501189, NGFR, NNAT, NTSR2, PCK2, SNED1, SPTBN2, ST8SIA4, STRBP, TAF13, TGM1, TYMS, UCHL1
GOTERM_BP_ALL GO:0009266 04 response to temperature stimulus
5 5,9 0,013 CIRBP, HSPA1A, HSPA1B, IL18, NGFR
GOTERM_BP_ALL GO:0042180 04 cellular ketone metabolic process
9 10,6 0,004 ACOT1, ACOT7, ARID2, ASS1, ATF3, CBR1, CSGALNACT1, HNRPLL, PCK2
GOTERM_BP_ALL GO:0006082 04 organic acid metabolic process
8 9,4 0,014 ACOT1, ACOT7, ARID2, ASS1, ATF3, CSGALNACT1, HNRPLL, PCK2
GOTERM_BP_ALL GO:0019752 05 carboxylic acid metabolic process
8 9,4 0,014 ACOT1, ACOT7, ARID2, ASS1, ATF3, CSGALNACT1, HNRPLL, PCK2
GOTERM_BP_ALL GO:0043436 05 oxoacid metabolic process
8 9,4 0,014 ACOT1, ACOT7, ARID2, ASS1, ATF3, CSGALNACT1, HNRPLL, PCK2
GOTERM_BP_ALL GO:0034637 05 cellular carbohydrate biosynthetic process
3 3,5 0,039 ATF3, CSGALNACT1, PCK2
GOTERM_BP_ALL GO:0051346 06 negative regulation of hydrolase activity
4 4,7 0,023 ANGPTL4, BCL2A1D, HSPA1A, HSPA1B,
GOTERM_BP_ALL GO:0008284 06 positive regulation of cell proliferation
6 7,1 0,039 ATF3, BEX1, HEY2, HIPK2, IL18, NGFR
GOTERM_BP_ALL GO:0048489 07 synaptic vesicle transport
3 3,5 0,017 APBA1, DLG4, SPTBN2
GOTERM_BP_ALL GO:0032502 02 developmental process 25 29,4 0,001 ACAN, ANGPTL4, APBA1, ASS1, ATF3, BCL2A1D, BEX1, CBR1, CTGF, DLG4, EXO1, HAP1, HEY2, HIPK2, IL18, IRX3, KLK14, LOC360228, NGFR, NNAT, NRG2, ODZ4, STRBP, TGM1, UCHL1
GOTERM_BP_ALL GO:0048869 03 cellular developmental process
15 17,6 0,012 ACAN, ANGPTL4, ATF3, BCL2A1D, BEX1, CTGF, DLG4, HEY2, IRX3, LOC360228, NGFR, NNAT, STRBP, TGM1, UCHL1 GOTERM_BP_ALL GO:0007275 03 multicellular organismal
development
23 27,1 0,001 ACAN, ANGPTL4, APBA1, ASS1, BCL2A1D, BEX1, CBR1, CTGF, DLG4, EXO1,HEY2, HAP1, HIPK2, IL18, IRX3, KLK14, NGFR, NNAT, NRG2, ODZ4, STRBP, TGM1, UCHL1 GOTERM_BP_ALL GO:0048856 03 anatomical structure
development
19 22,3 0,013 ACAN, ANGPTL4, ASS1, BCL2A1D, BEX1, CBR1, CTGF, DLG4, EXO1, HAP1, HEY2, IL18, IRX3, KLK14, NGFR, NNAT, ODZ4, TGM1, UCHL1
GOTERM_BP_ALL GO:0048731 04 system development 18 21,1 0,016 ACAN, ANGPTL4, ASS1, BCL2A1D, BEX1, CBR1, CTGF, DLG4, EXO1, HAP1, HEY2, IL18, IRX3, KLK14, NGFR, NNAT, TGM1, UCHL1
GOTERM_BP_ALL GO:0030154 04 cell differentiation 15 17,6 0,009 ACAN, ANGPTL4 ATF3, BCL2A1D, BEX1, CTGF, DLG4, HEY2, IRX3, LOC360228, NGFR, NNAT, STRBP, TGM1, UCHL1 GOTERM_MF_ALL GO:0003824 02 catalytic activity 30 35,3 0,037 ACOT1, ACOT7, ARID2, ASS1, ATP1B4, ATP12A ,BDH1,
CAMK2G, CBR1, CSGALNACT1, DCXR, DUSP3, EXO1, GCAT, GSTA5, HDAC5, HIPK2, HMGCS2, KLK14, LOC286911, LOC501189, MYO9A, PCK2, PLA2G7, RAB7A, RNASE1, ST8SIA4, TYMS, TGM1, UCHL1
GOTERM_MF_ALL GO:0016788 04 hydrolase activity, acting on ester bonds
7 8,2 0,041 ACOT1, ACOT7, DUSP3, EXO1, PLA2G7, RNASE1, UCHL1
GOTERM_MF_ALL GO:0016790 05 thiolester hydrolase activity
3 3,5 0,047 ACOT1, ACOT7, UCHL1
GOTERM_CC_ALL GO:0031974 02 membrane-enclosed lumen
13 14,5 0,032 ARNTL, ASCL3, ASCL3_PREDICTED, ATF3, BDH1, CIRBP, DUSP3, HIPK2, HMGCS2, NGFR, SPTBN2, SUPT16H, TAF13 GOTERM_CC_ALL GO:0044421 03 extracellular region part 8 9,6 0,044 ACAN, ANGPTL4, COL24A1, CTGF, LOC286911,
LOC360228, IL18, KLK14
GOTERM_CC_ALL GO:0031090 04 organelle membrane 11 12,0 0,032 ASS1, CAMK2G, CSGALNACT1, BDH1, DLG4, GCAT, GSTA5, HIPK2, HMGCS2, LOC501189, ST8SIA4
reported to reduce the expression of the arginine recyc- ling enzyme, argininosuccinate synthetase. Overexpres- sion of hepatic angiopoietin-like 4 gene has been shown in diabetic mice [71] and up-regulation of this gene has reported to be induced by fatty acids via PPAR-gamma in muscle tissue [72]. Additionally, insulin has been shown to down regulate angiopoietin-like 4 in adipo- cytes [73] and this down-regulation could be attenuated in insulin resistance [73].
Members of another functional gene cluster that is related to stress response showed altered expression in ZDF hearts as compared to controls in the present study (down-regulation ofheat shock 70 kDa protein 1A; similar to 60 kDa heat shock protein, mitochondrial precursor;
interleukin 18 and up-regulation of cold inducible RNA binding protein; glutathione S-transferase Yc2 subunit). We have previously shown that hyperlipidemia inhibits cardiac heat shock response [36]. Moreover, heat shock proteins, especially Hsp60, were found to have protective effect against cardiac oxidative and nitrosative stress [74]. Accord- ing to the attenuated expression of heat shock protein 60 and 70 in our present study, metabolic syndrome with well- known increased cardiovascular oxidative and nitrosative stress [41,42] due to hyperlipidemia [64], hypertension [65]
and hyperglycemia [66,67] might interfere with cardiac heat shock response. Glutathion S-transferase catalyzes the con- jugation of reduced glutathione on a wide variety of sub- strates [75] including reactive oxygen and nitrogen species [76]. Interestingly, we have found here the overexpres- sion of glutathione S-transferase in metabolic syndrome similarly to the up-regulation of this gene in cholesterol diet-induced hyperlipidemia in our previous study [77].
Additionally, the absence of cardiomyopathy in diabetes has been reported to be accompanied by increased glutathi- one S-transferase activity in rat hearts [78]. These results suggest that up-regulation of glutathione S-transferase may be an adaptive response in metabolic syndrome to antagonize elevated oxidative/nitrosative stress in the myo- cardium. Elevated circulating interleukin 18 levels have been reported to be associated with metabolic syndrome
independent of obesity and insulin resistance [79], however, in our present study; the myocardial gene expression of interleukin 18 was down-regulated.
In the present study, we have also shown altered ex- pression of several genes related to signal transduction and regulation of transcription in the hearts of ZDF rats as compared to controls (e.g. down-regulation ofactivat- ing transcription factor 3; sushi, nidogen and EGF-like domains 1 (insulin responsive sequence DNA binding protein-1) and up-regulation of calcium/calmodulin- dependent protein kinase II gamma; phospholipase A2, group VII). Interestingly, in our present study, an adap- tive and oxidative stress-responsive transcription factor [80-82], activating transcription factor 3 showed down- regulation in the heart in metabolic syndrome. Although, enhanced expression of activating transcription factor 3 has been reported to play a role in diabetic angiopathy [80], in stress-induced beta cell dysfunction [83,84] and hepatic LDL receptor down-regulation [85,86], its car- diac role in metabolic syndrome has not been implicated yet. Another stress inducible and regulator gene of eicosa- noid biosynthesis, the phospholipase A2, group VII gene was up regulated in our present study in ZDF rat hearts. In- crease of the expression of this gene was previously shown in ZDF rats in the liver and suggested to be a factor in the development of chronic low-grade inflammation in meta- bolic syndrome [87]. In our present study, a regulator gene of insulin action, the insulin responsive sequence DNA binding protein-1 showed down-regulation in metabolic syndrome in ZDF rat hearts. Down-regulation of this gene has been previously shown in the liver of diabetic [88]
and obese [88] rats. However, it is unclear whether decreased expression of insulin responsive sequence DNA binding protein-1 is a consequence of insulin resistance or contributes to hyperglycemic phenotype.
Calcium/calmodulin-dependent protein kinase II gamma showed up-regulation in ZDF hearts in our present study. This gene was reported to potentially mediate cardiac hypertrophy in pressure overload hypertension in mouse hearts [89].
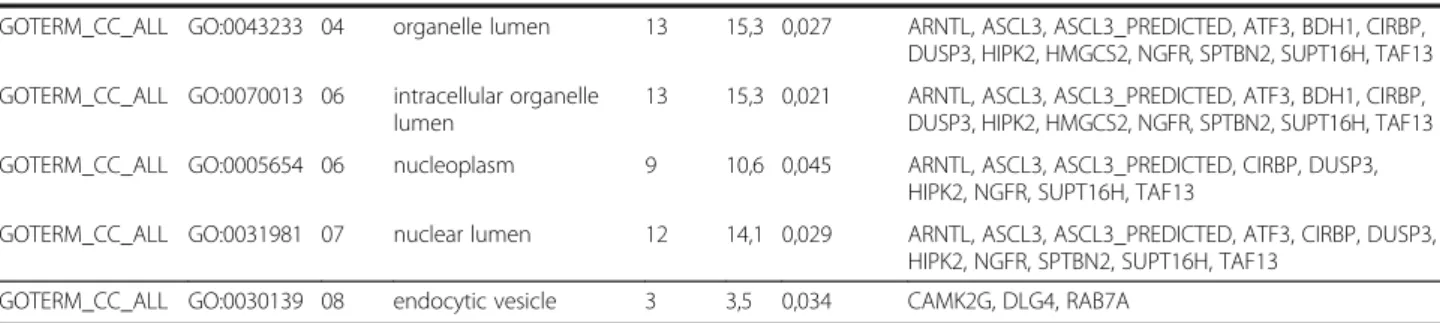
Table 5 Gene ontology analysis(Continued)
GOTERM_CC_ALL GO:0043233 04 organelle lumen 13 15,3 0,027 ARNTL, ASCL3, ASCL3_PREDICTED, ATF3, BDH1, CIRBP, DUSP3, HIPK2, HMGCS2, NGFR, SPTBN2, SUPT16H, TAF13 GOTERM_CC_ALL GO:0070013 06 intracellular organelle
lumen
13 15,3 0,021 ARNTL, ASCL3, ASCL3_PREDICTED, ATF3, BDH1, CIRBP, DUSP3, HIPK2, HMGCS2, NGFR, SPTBN2, SUPT16H, TAF13 GOTERM_CC_ALL GO:0005654 06 nucleoplasm 9 10,6 0,045 ARNTL, ASCL3, ASCL3_PREDICTED, CIRBP, DUSP3,
HIPK2, NGFR, SUPT16H, TAF13
GOTERM_CC_ALL GO:0031981 07 nuclear lumen 12 14,1 0,029 ARNTL, ASCL3, ASCL3_PREDICTED, ATF3, CIRBP, DUSP3, HIPK2, NGFR, SPTBN2, SUPT16H, TAF13
GOTERM_CC_ALL GO:0030139 08 endocytic vesicle 3 3,5 0,034 CAMK2G, DLG4, RAB7A
Significantly enriched gene ontology (GO) terms in the population of genes with altered expression due to metabolic syndrome. GO analysis determines the biological significance of differentially expressed genes that can be used to determine the functional classification of the genes, the expression of which have been significantly up- or down-regulated. Major functional categories of GO terms were separated by horizontal lines, subcategories are represented by level on gene tree.