ORIGINAL ARTICLE
In New-Onset Diabetes Mellitus, Metformin Reduces Fat Accumulation in the Liver, But Not in the Pancreas
or Pericardium
AU1c Ga´bor Zso´ri, MD,1Do´ra Ille´s, MD,1Emese Iva´ny, MD,1Kla´ra Kosa´r, MD,1 Ga´bor Holzinger, MD,1Ma´te´ Tajti, MD,1
AU2c Eszter Pa´linka´s,1Ge´za Szabovik, MD,2
Andra´s Nagy, MD,2Andra´s Palko´, MD, DSc,2and La´szlo´ Czako´, MD, DSc1
Abstract
Background:
Nonalcoholic fatty pancreas and liver disease (NAFPD and NAFLD) and pericardial adipose tissue (PAT) are often associated with type 2 diabetes mellitus (T2DM). Our aim was to evaluate the incidence rate of NAFLD and NAFPD, PAT size, and the effect of metformin treatment on NAFLD, NAFPD, and PAT in new-onset T2DM (NODM).
Methods:
Seventeen patients with NODM and 10 subjects used as a control group were involved in the study.
Computed tomography (CT) and laboratory tests were performed before the beginning of metformin therapy and 4 months afterward. PAT and the amount of fat in the pancreas and liver were determined by X-ray attenuation during unenhanced CT examination and compared with the values for the control subjects.
Results:
Metabolic parameters improved significantly after metformin therapy. NAFLD was diagnosed in 64.7% of the patients with NODM and in 10% of the control subjects. The radiation absorption of the liver was significantly lower in the patients with NODM compared with the control group and significantly higher after metformin therapy compared with the baseline values. Only six patients (35.3%) had NAFLD after metformin therapy. NAFPD was diagnosed in 82.3% of the patients with NODM and in 20% of the control subjects. The radiation absorption of the pancreas was significantly lower in the patients with NODM compared with the control group but did not change significantly after treatment. PAT size was significantly larger in the patients with NODM and did not change significantly after metformin treatment.
Conclusions:
NAFLD, NAFPD, and increased PAT were detected in the majority of patients with NODM.
Metformin therapy decreased the amount of fat in the liver in parallel with an improvement in the metabolic parameters and may, thus, be beneficial for preventing the late consequences of NAFLD.
AU3c Keywords:
pericardial adipose tissue, type 2 diabetes mellitus, metformin, nonalcoholic fatty pancreas disease, nonalcoholic fatty liver disease
Introduction
I
t is a well-knownfact that insulin resistance, diabetes, and obesity cause fat accumulation in many organs, in- cluding the liver (nonalcoholic fatty liver disease [NAFLD]), pancreas (nonalcoholic fatty pancreas disease [NAFPD]), and pericardium (pericardial adipose tissue [PAT]).1The world- wide prevalence of NAFLD ranges widely from 6.3% to 33%with a median of 20%, depending on the kind of assessment methods used.2–6 There is a high prevalence of NAFLD
in patients with type 2 diabetes mellitus (T2DM) (64%–
69%)2,7–10and dyslipidemia (20%–81%).11,12
Obesity, T2DM, and dyslipidemia are risk factors for the development of NAFLD.8,9,13,14The incidence rate of pre- diabetes mellitus (DM) is as high as 93.3% in NAFLD, so pre-DM is a more important predictor of NAFLD than met- abolic syndrome.15Moreover, it seems that the male gender is presumably a further risk factor for NAFLD.2If left un- treated, NAFLD may progress through steatohepatitis to cirrhosis and hepatocellular carcinoma.16,17
1First Department of Medicine and2Department of Radiology, University of Szeged, Szeged, Hungary.
Volume XX, Number XX, 2019 Mary Ann Liebert, Inc.
Pp. 1–7
DOI: 10.1089/met.2018.0086
1 1 1
NAFPD is a less well-studied phenomenon. Fatty pancreas is a common ultrasound finding with increased echogenicity of the parenchyma due to fat accumulation.18Previous studies have suggested a 16%–35% prevalence of fatty pancreas in the general population.19,20 It seems that age,21 obesity, hyper- glycemia, and dyslipidemia are risk factors for NAFPD.20,22–24 Also, NAFPD may increase the risk for the development of metabolic syndrome by causing inflammation,25 impaired pancreatic beta cell function, and finally hyperglycemia.26 This relationship may explain the presence of T2DM27 in 6.9%–12.6% of patients with pancreatic steatosis.19,20Several studies have suggested that insulin resistance is associated with pancreatic fat accumulation,22–24,28,29nonalcoholic stea- tohepatitis (NASH),22,30and pre-DM.23
Higher pancreatic triglyceride content in obesity can be detected by proton magnetic resonance spectroscopy,31 computed tomography (CT),32,33 or magnetic resonance imaging (MRI)34even before the development of T2DM.31 It has been demonstrated that obesity may lead to pancreatic ductal adenocarcinoma through pancreatic steatosis.25,35,36 Evidence suggests that pancreatic steatosis plays a role in T2DM, pancreatic exocrine dysfunction, acute pancreati- tis,37,38 pancreatic cancer, and the formation of pancreatic fistulas after pancreatic surgery.39
NAFLD and NAFPD are associated with each other be- cause pancreatic fat formation is related to NASH and is a significant predictor of the presence of NAFLD.40The ele- vation of liver transaminases may suggest the presence of NAFLD or NASH. Ultrasonography and transient elasto- graphy are currently the most appropriate imaging modality for NAFLD screening, and liver biopsy is the ‘‘gold stan- dard’’ for characterizing liver histology in patients with NAFLD.41In contrast to the liver, no biochemical marker is available for diagnosing NAFPD. Further, as the pancreas is a retroperitoneal organ, a pancreatic biopsy is more cum- bersome and may be accompanied by more sampling errors and complications compared with a liver biopsy. Visualizing the pancreas by ultrasonography is more difficult, and the sensitivity and specificity of ultrasonography in detecting NAFPD are hampered by obesity and bloating.
Further, in prediabetic and T2DM patients, the amount of PAT is significantly higher compared with that in normogly- cemic patients.42,43Previous reviews have demonstrated that, besides epicardial adipose tissue, PAT is another risk factor for the development of cardiovascular disease in T2DM patients.44 The aim of this study was to evaluate the incidence rate of NAFLD and NAFPD, PAT size, and the effect of metformin treatment on NAFLD, NAFPD, and PAT in new-onset T2DM (NODM) by measuring tissue attenuation during unenhanced CT examination.
Subjects and Methods
Seventeen patients with NODM (male: 8; female: 9; mean age: 55.3–10.8 years; body mass index [BMI]: 31.8– 5.1 kg/m2) were involved in this prospective study. The control group comprised 10 healthy subjects (male: 6; fe- male: 4; mean age: 53.9–13.8 years; BMI: 30.0–4.7 kg/m2) without DM, without the presence of any pancreatic, liver, or cardiovascular disease, or history of alcohol consumption and matched for age, sex, BMI, and serum lipids (
T1c Table 1).
The diagnosis of T2DM was made in accordance with the American Diabetes Association criteria.45NODM is defined
as DM diagnosed within the past 1 month before the date of enrollment. Patients were only on a low-carbohydrate diet and received no hypoglycemic agents before inclusion.
Exclusion criteria consisted of any pancreatic, liver, or cardiovascular disease, inherited disorders of fat metabo- lism, pregnancy, malignant disease, antidiabetic medication, or alcohol consumption in patients’ medical records. NODM patients received no other new drugs beyond 1000 mg metformin twice daily after inclusion. However, a hypoli- pidic diet was recommended to patients with elevated lipid levels. The follow-up period was 4 months. CT and labo- ratory tests (serum triglyceride, cholesterol, insulin level, fasting blood glucose, and glycosylated hemoglobin [HbA1c]) were performed before the beginning of metfor- min therapy and 4 months afterward. Homeostatic model assessment-estimated insulin resistance (HOMA-IR) was also calculated. PAT size and the amount of fat in the pancreas and liver were determined by X-ray attenuation rate during unenhanced CT examination (Hounsfield unit [HU]) (Fig. 1). Each region of interest (ROI) in the liver,bF1 pancreas, and spleen was a round area of *1.0 cm2 as a marker of the degree of attenuation.46 In the case of PAT, measurements were performed in one dedicated slice at the junction of the inferior vena cava and right atrium. ROIs were identified in Segment VII of the liver, along the dia- phragmatic surface of the spleen and in the body of the pancreas. Mean density was calculated, and General Electric Centricity PACS software was used to determine the values.
NAFLD and NAFPD were defined when the liver-to-spleen or pancreas-to-spleen attenuation ratio was<1.47,48
All the participants provided written informed consent.
The study protocol was in full accordance with the most recent revisions of the Helsinki Declaration and was ap- proved by the ethics committee at the University of Szeged.
Statistical analysis
Continuous measures are summarized and presented as means and standard deviations. Categorical data are pre- sented as percentages. The two-sample t-test and paired- samples t-test were used to determine differences between continuous parameters. Non-normally distributed data were log transformed. Data were processed with SPSS 22.0 (Armonk, NY), and a level of P<0.05 was considered sta- tistically significant.
Table1. Age, Body Mass Index, Cholesterol, and Triglyceride Levels in Patients
with New-Onset Type2Diabetes Mellitus bAU5 and Healthy Control Subjects at Baseline
Control (male: 6;
female: 4)
NODM (male: 8;
female: 9) P Age (years) 53.9–13.8 55.3–10.8 0.521 BMI (kg/m2) 30.0–4.7 31.8–5.1 0.437 Serum cholesterol
(mM)
5.1–0.9 5.7–1.9 0.187 Serum triglyceride
(mg/dL)
3.3–2.7 3.1–1.8 0.830
Data expressed as mean values–SD.
BMI, body mass index; NODM, new-onset type 2 diabetes mellitus; SD, standard deviation.
Results
Fasting blood glucose, HbA1c, serum insulin and cho- lesterol, and HOMA-IR decreased significantly after met- formin therapy compared with the baseline values (
T2c Table 2).
However, serum triglyceride and BMI did not change.
NAFLD was diagnosed in 64.7% (11 out of 17) of the patients with NODM and in 10% of the control subjects based on the diagnostic criteria. NODM patients with and without NAFLD were compared (
T3c Table 3). The amount of
fat in the liver was significantly higher in NODM patients with NAFLD than in those without it (25.2–12.7 vs.
55.6–9.3 HU). The serum cholesterol level was signifi- cantly higher in patients without NAFLD as compared with patients with the disease in the NODM group (P=0.002).
BMI, serum triglyceride, fasting blood glucose level, HbA1c, and liver enzymes were not significantly different between patients with and without NAFLD (Table 3).
The radiation absorption of the liver was significantly lower in patients with NODM compared with the control group (32.3–17.7 vs. 53.1–8.3 HU [P=0.001]) and sig- nificantly increased after metformin therapy compared with
the baseline values (32.3–17.7 vs. 47.3–12.1 HU [P=0.026]) (Fig. 2). Only six patients (35.3%) had NAFLD after thebF2 4-month metformin therapy according to the diagnostic criteria.
NAFPD was diagnosed in 82.3% (14 out of 17) of the patients with NODM and in 20% of the control subjects based on the diagnostic criteria. The amount of fat in the pancreas was significantly higher in the NODM patients with NAFPD than in those without it (30.2–6.9 vs.
45.4–3.9 HU [P<0.001]). The radiation absorption of the pancreas was significantly lower in the patients with NODM compared with the control group (34.0–7.9 vs. 39.4–7.8 HU [P=0.04]) but did not change significantly after the 4-month metformin treatment (34.0–7.9 vs. 37.7–10.2 HU
[P=0.178]) (Fig. 3). bF3
PAT size was significantly larger in the patients with NODM compared with the control group (2143.1–1036 vs.
1223.9–312.9 mm2[P=0.008]) and did not change signif- icantly after the metformin treatment (2143.1–1036 vs.
2048.2–997 mm2[P=0.798]) (Fig. 4). bF4
Discussion and Conclusions
This study demonstrates that NAFLD and NAFPD are already present and PAT volume is increased in patients with NODM. Metformin therapy effectively decreased the amount of fat in the liver but did not affect the amount of fat in the pancreas or PAT volume.
NAFLD is the most common liver disorder worldwide and contributes significantly to overall mortality and to cardiovascular and liver-related mortality in particular. The main risk factor is T2DM; NAFLD can be demonstrated in 64%–69% of T2DM patients.2,7–9It is likely that NAFLD is the hepatic manifestation of metabolic syndrome, where insulin resistance is the main risk factor.49 On the other hand, NAFLD may progress to an inflammatory complica- tion, NASH. The high incidence of NASH in patients with T2DM may lead to further complications, such as liver cirrhosis and hepatocellular carcinoma.16,17 Given the ex- pected rise in the prevalence of T2DM, NAFLD is projected to be the principal etiology for liver transplantation within the next decade.7Further, NAFLD is believed to be an in- dependent determinant of cardiovascular disease.50
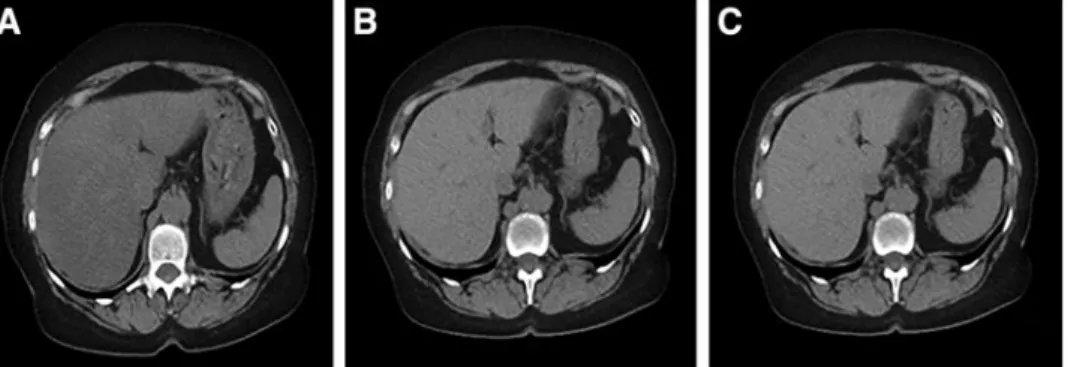
Metabolic syndrome and obesity are commonly associ- ated with NAFLD. However, the links between NAFLD, FIG. 1. Typical plain CT images in new-onset type 2 diabetic patients before and 4 months after the start of metformin therapy and in control subjects. The density of the liver was diffusely decreased in new-onset type 2 diabetic patients(A)as compared with control (C). Metformin therapy increased liver density in the diabetic patients (B)like the density in the control liver(C). CT, computed tomography.
Table2. Changes of Laboratory Test Results and Body Mass Index from Baseline Values to4
Months Afterward During Metformin Therapy in Patients with New-Onset Type 2
Diabetes Mellitus
Baseline values (male: 8;
female: 9)
4 months afterward (male: 8;
female: 9) P Fasting blood glucose
(mM)
12.9–4.8 7.0–1.4
AU6c 0.001
HbA1c (%) 9.6–2.8 6.7–0.8 <0.001 Serum insulin (mU/L) 33.1–18.3 22.2–11.5 0.003 HOMA-IR (molar units) 16.6–9.0 7.1–3.1 <0.001 Serum cholesterol (mM) 4.8–1.0 4.4–1.0 0.016 Serum triglyceride
(mg/dL)
2.9–1.1 2.4–1.3 0.299 BMI (kg/m2) 31.8–5.1 31.6–4.4 0.757
Data expressed as mean values–SD.
HbA1c, glycosylated hemoglobin; HOMA-IR, homeostatic model assessment-estimated insulin resistance.
insulin resistance, and T2DM are not fully understood.7 NAFLD can predict the incidence of diabetes independently of traditional risk factors, including obesity, peripheral in- sulin resistance, and metabolic syndrome.51Moreover, dia- betes promotes or worsens hepatic steatosis, thus fueling a vicious cycle.
PAT plays a role in myocardial energy metabolism through the connection with the coronary arteries and the myocardi- um.52,53 Increased pericardial fat volume was demonstrated as a risk factor for coronary artery disease54and the devel- opment of cardiovascular disease in T2DM patients.44In the Jackson heart study, PAT was associated with elevated levels of fasting glucose, triglycerides, C-reactive protein, systolic blood pressure, and lower levels of high-density lipoprotein.53Moreover, PAT was also linked to metabolic syndrome, hypertension, T2DM, and metabolic syndrome.53 Further, Lozzo found increased PAT volume in T2DM pa- tients.43 We demonstrated that PAT volume is already higher in NODM; however, metformin therapy did not af-
fect PAT volume. The latter finding is in line with a pre- vious study, where 24-week-long metformin treatment did not change PAT size.55The mechanisms of metformin are complex and are still not fully understood. Metformin works directly or indirectly on the liver to reduce hepatic glucose production, affects the gut to increase glucose utilization and the level of glucagon-like peptide-1 (GLP-1), and alters the microbiome.56The GLP-1 receptor is also expressed in the adipose tissue, and GLP-1 promotes adipogenesis by upregulation of adipocyte-specific markers and transcription factors.57This may explain why metformin did not decrease PAT volume, although it had a beneficial effect on meta- bolic parameters.
In our study, a T2DM patient cohort was selected to an- alyze the effect of insulin resistance on the prevalence of NAFLD. The control subjects did not have DM or any pancreatic, liver, or cardiovascular disease, or history of alcohol consumption, but they were matched for age, sex, BMI, and serum lipids. Therefore, NODM was the only variable in our study that could influence the prevalence of Table3. Amount of Fat in the Liver, Cholesterol, Triglyceride, Body Mass Index, Fasting Blood Glucose,
HbA1c, and Liver Enzyme Values in New-Onset Type2Diabetes Mellitus Patients With and Without Nonalcoholic Fatty Liver Disease at Baseline
Patients with NAFLD (male: 6; female: 5)
Patients without NAFLD
(male: 2; female: 4) P
The amount of fat in the liver (HU) 25.2–12.7 55.6–9.3 0.002
Serum cholesterol (mM) 5.5–1.1 5.8–0.3 0.002
Serum triglyceride (mg/dL) 2.7–1.4 2.9–1.5 0.776
BMI (kg/m2) 31.6–5.2 29.2–5.6 0.233
Aspartate aminotransferase (U/L) 20.6–5.5 16.5–3.0 0.123
Alanine aminotransferase (U/L) 24.9–8.6 19.5–6.5 0.151
Alkaline phosphatase (U/L) 76.8–18.0 83.5–24.4 0.717
Gamma glutamyltransferase (U/L) 43.9–15.2 46.3–25.6 0.901
Total bilirubin (mM) 8.1–1.7 5.9–2.5 0.245
Fasting blood glucose (mM) 13.9–5.9 12.3–9.2 0.882
HbA1c (%) 9.4–2.1 9.2–2.8 0.924
HOMA-IR 17.8–8.3 11.4–9.5 0.368
Data expressed as mean value–SD.
HU, Hounsfield unit; NAFLD, nonalcoholic fatty liver disease.
FIG. 2. The radiation absorption of the liver in new-onset type 2 diabetic patients before and 4 months after the start of metformin therapy and in control subjects. The X-ray at- tenuation rate during a native CT examination was measured in new-onset type 2 diabetic patients before and 4 months after the start of metformin therapy and in control subjects.
Data expressed as mean values–SD. *P<0.05. SD, stan- dard deviation.
FIG. 3. The radiation absorption of the pancreas in new- onset type 2 diabetic patients before and 4 months after the start of metformin therapy and in control subjects. The X- ray attenuation rate during a native CT examination was measured in new-onset type 2 diabetic patients before and 4 months after the start of metformin therapy and in control subjects. Data expressed as mean values–SD. *P<0.05.
NAFLD. Patients with NODM were enrolled in this pro- spective study if they had been diagnosed within 1 month, they consumed no alcohol, and their medical records showed no pancreatic, liver, or cardiovascular disease, inherited dis- orders of fat metabolism, antidiabetic medication or preg- nancy, or malignant disease. The aims of the study were (1) to analyze the effect of early phase insulin resistance on the development of NAFLD and NAFPD and (2) to investigate the effect of newly introduced metformin therapy on the de- gree of fat content in the liver and pancreas and on PAT size.
Sixty-nine percent and 62% of T2DM patients had NAFLD as defined by ultrasound in two previous studies,8,9 and 87% of the NAFLD cases were confirmed histologically in the latter study. However, these studies featured a cross- sectional design that included diabetic patients with variable disease lengths. We involved NODM patients diagnosed within 1 month before enrollment in our study. Overall, 64.7% of newly diagnosed diabetic patients in our investi- gation had NAFLD. This means that NAFLD is already present in the early phase of DM. The high prevalence of NAFLD in our study can be explained by the fact that our patients had several risk factors. They were generally overweight and had elevated cholesterol and triglyceride levels. However, BMI, serum cholesterol, and triglyceride levels were also above normal in the control group, and there were no significant differences between the control group and the DM group. In contrast, only 10% of the control subjects had NAFLD. Further, the radiation ab- sorption of the liver was significantly lower, indicating a higher amount of fat in the liver in patients with T2DM compared with the control group. This increased amount of fat, therefore, can be attributed to insulin resistance after excluding other risk factors. It was demonstrated that insulin resistance is already present at least 5 years before overt diabetes in populations with a high prevalence of T2DM.58 The high prevalence of NAFLD can also be explained by the fact that we defined fatty liver by measuring radiation ab- sorption on CT, which is more sensitive, specific, and operator-independent compared with ultrasound.
NAFPD has been poorly investigated compared with NAFLD, although interest is increasing among researchers.
Reports on the relationship between NAFPD and b-cell
function are inconsistent. Some studies indicate that pan- creatic lipid content is negatively associated with insulin secretion in nondiabetic subjects27 or individuals with pre- diabetes,26whereas others suggest that there is no relationship betweenbcell function and pancreatic fat in prediabetic59or diabetic subjects.27
Pancreatic fat content can be studied with multiple di- agnostic modalities. A histological examination requires a pancreatic biopsy. However, this is invasive, and there are complications associated with it. Ultrasonography is cheap and easily available, but a relatively insensitive measure of pancreatic fat content. More recently, expensive MRI tech- niques have been used to assess pancreatic fat deposition.
A native CT scan was employed in our study to measure the amount of pancreatic steatosis using radiation absorption correlated to the spleen.
Diabetic patients have been demonstrated to have higher pancreatic fat content as measured by magnetic resonance spectroscopy27,31 and dual-echo magnetic resonance che- mical shift imaging.60 In contrast, Saisho et al. found that pancreatic fat content was not significantly increased in T2DM.61Overall, 82.3% of NODM patients were diagnosed as having NAFPD based on the diagnostic criteria, whereas NAFPD was only detected in 20% of the control population in our study. Since the control group was matched for age, sex, BMI, and serum lipids with the T2DM group, NAFPD may be a consequence of insulin resistance.
Newly (<1 month) diagnosed T2DM patients were en- rolled in the study to assess the effect of metformin on NAFLD and NAFPD. Metformin is the first-line agent for the treatment of diabetes and the most popular antidiabetic agent worldwide. The effects of metformin on NAFLD have been evaluated in several studies, with some of them showing a beneficial effect on aminotransferase levels or liver histological alterations.2,62–64 To our knowledge, no study has ever evaluated the effect of metformin on hepatic fat content measured by tissue attenuation during un- enhanced CT examination. Four-month-long metformin treatment significantly reduced fat content in the liver in our study. Metformin also improved glycemic control and in- sulin resistance, as measured by HOMA-IR, and lowered serum cholesterol level, the results of which can partly be attributed to its beneficial effects. However, metformin therapy did not reduce pancreatic fat content and PAT size.
In conclusion, NAFLD, NAFPD, and increased PAT were detected in the majority of the NODM patients. Metformin therapy lowered the amount of fat in the liver in parallel with the improvement in metabolic parameters but did not decrease the level of adipose tissue in the pancreas nor re- duce PAT size. Metformin therapy started early in the course of diabetes may be beneficial for the prevention of the late consequences of NAFLD.
Acknowledgments
The study was partly funded by a grant (K 128222 to L.C.) from the Hungarian National Research, Development and Innovation Office.
Author Disclosure Statement
The article has been read, understood, and approved by all the authors. The authors declare that this article is not under FIG. 4. The size of pericardial adipose tissue in new-onset
type 2 diabetic patients before and 4 months after the start of metformin therapy and in control subjects. A native CT examination was measured in new-onset type 2 diabetic patients before and 4 months after the start of metformin therapy and in control subjects. Data expressed as mean values–SD. *P<0.05.
review elsewhere and that it has not been published earlier.
They have no commercial associations that might represent a conflict of interest in relation to the submitted article.
R
AU4c eferences
1. Eguchi Y, Eguchi T, Mizuta T, et al. Visceral fat accu- mulation and insulin resistance are important factors in nonalcoholic fatty liver disease.J Gastroenterol 2006;41:
462–469.
2. Vernon G, Baranova A, Younossi ZM. Systematic review:
The epidemiology and natural history of non-alcoholic fatty liver disease and non-alcoholic steatohepatitis in adults.
Aliment Pharmacol Ther2011;34:274–285.
3. Williams CD, Stenger J, Asike MI, et al. Prevalence of nonalcoholic fatty liver disease and nonalcoholic steato- hepatitis among a largely middle-aged population utilizing ultrasound and liver biopsy: A prospective study.Gastro- enterology2011;140:124–131.
4. Browning JD, Szczepaniak LS, Dobbins R, et al. Pre- valence of hepatic steatosis in an urban population in the United States: Impact of ethnicity. Hepatology 2004;40:
1387–1395.
5. Williamson RM, Price JF, Glancy S, et al. Prevalence of and risk factors for hepatic steatosis and nonalcoholic Fatty liver disease in people with type 2 diabetes: The Edinburgh Type 2 Diabetes Study.Diabetes Care2011;34:1139–1144.
6. Bedogni G, Miglioli L, Masutti F, et al. Prevalence of and risk factors for nonalcoholic fatty liver disease: The Dio- nysos nutrition and liver study.Hepatology2005;42:44–52.
7. Richard J, Lingvay I. Hepatic steatosis and type 2 diabetes:
Current and future treatment considerations. Expert Rev Cardiovasc Ther2011;9:321–328.
8. Leite NC, Salles GF, Araujo AL, et al. Prevalence and associated factors of non-alcoholic fatty liver disease in patients with type-2 diabetes mellitus. Liver Int 2009;29:
113–119.
9. Prashanth M, Ganesh HK, Vima MV, et al. Prevalence of nonalcoholic fatty liver disease in patients with type 2 di- abetes mellitus.J Assoc Physicians India2009;57:205–210.
10. Bellentani S. The epidemiology of non-alcoholic fatty liver disease.Liver Int2017;37:81–84.
11. Gaggini M, Morelli M, Buzzigoli E, et al. Non-alcoholic fatty liver disease (NAFLD) and its connection with insulin resistance, dyslipidemia, atherosclerosis and coronary heart disease.Nutrients2013;5:1544–1560.
12. Assy N, Kaita K, Mymin D, et al. Fatty infiltration of liver in hyperlipidemic patients.Dig Dis Sci2000;45:1929–1934.
13. Naga C, Zobair Y, Joel EL, et al. The diagnosis and management of non-alcoholic fatty liver disease: Practice Guideline by the American Association for the Study of Liver Diseases, American College of Gastroenterology, and the American Gastroenterological Association.Hepatology 2012;55:2005–2023.
14. Musso G, Gambino R, Cassader M, et al. Meta-analysis:
Natural history of non-alcoholic fatty liver disease (NAFLD) and diagnostic accuracy of non-invasive tests for liver disease severity.Ann Med2011;43:617–649.
15. Zelber-Sagi S, Lotan R, Shibolet O, et al. Non-alcoholic fatty liver disease independently predicts prediabetes dur- ing a 7-year prospective follow-up. Liver Int 2013;33:
1406–1412.
16. Sanyal AJ, Banas C, Sargeant C, et al. Similarities and dif- ferences in outcomes of cirrhosis due to nonalcoholic stea- tohepatitis and hepatitis C.Hepatology2006;42:132–138.
17. Adams LA, Lymp JF, Sauver JST, et al. The natural history of nonalcoholic fatty liver disease: A population-based cohort study.Gastroenterology 2005;129:113–121.
18. Li S, Su L, Lv G, et al. Transabdominal ultrasonography of the pancreas is superior to that of the liver for detection of ectopic fat deposits resulting from metabolic syndrome.
Medicine (Baltimore)2017;96:8060.
19. Wang CY, Ou HY, Chen MF, et al. Enigmatic ectopic fat:
Prevalence of nonalcoholic fatty pancreas disease and its associated factors in a Chinese population. J Am Heart Assoc2014;3:000297.
20. Lesmana CRA, Pakasi LS, Inggriani S, et al. Prevalence of non-alcoholic fatty pancreas disease (NAFPD) and its risk factors among adult medical check-up patients in a private hospital: A large cross sectional study.BMC Gastroenterol 2015;15:174.
21. Li J, Xie Y, Yuan F, et al. Noninvasive quantification of pancreatic fat in healthy male population using chemical shift magnetic resonance imaging: Effect of aging on pancreatic fat content.Pancreas2011;40:295–299.
22. Wu W-C, Wang C-Y. Association between non-alcoholic fatty pancreatic disease (NAFPD) and the metabolic syn- drome: Case–control retrospective study.Cardiovasc Dia- betol2013;12:77.
23. Ou H-Y, Wang C-Y, Yang Y-C, et al. The association between nonalcoholic fatty pancreas disease and diabetes.
PLoS One2013;8:62561.
24. Sepe PS, Ohri A, Sanaka S, et al. A prospective evaluation of fatty pancreas by using EUS.Gastrointest Endosc2011;
73:987–993.
25. Pitt HA. Hepato-pancreato-biliary fat: The good, the bad and the ugly.HPB (Oxford)2007;9:92–97.
26. Heni M, Machann J, Staiger H, et al. Pancreatic fat is negatively associated with insulin secretion in individuals with impaired fasting glucose and/or impaired glucose tolerance: A nuclear magnetic resonance study. Diabetes Metab Res Rev2010;26:200–205.
27. Tushuizen ME, Bunck MC, Pouwels PJ, et al. Pancreatic fat content and beta-cell function in men with and without type 2 diabetes.Diabetes Care2007;30:2916–2921.
28. Pacifico L, Di Martino M, Anania C, et al. Pancreatic fat and b-cell function in overweight/obese children with nonalcoholic fatty liver disease. World J Gastroenterol 2015;21:4688–4695.
29. Targher G, Rossi AP, Zamboni GA, et al. Pancreatic fat accumulation and its relationship with liver fat content and other fat depots in obese individuals. J Endocrinol Invest 2012;35:748–753.
30. Musso G, Cassader M, De Michieli F, et al. Nonalcoholic steatohepatitis versus steatosis: Adipose tissue insulin re- sistance and dysfunctional response to fat ingestion predict liver injury and altered glucose and lipoproteinmetabolism.
Hepatology2012;56:933–942.
31. Lingvay I, Esser V, Legendre JL, et al. Noninvasive quantification of pancreatic fat in humans. J Clin En- docrinol Metab2009;94:4070–4076.
32. Yu TY, Wang CY. Impact of non-alcoholic fatty pancreas disease on glucose metabolism.J Diabetes Investig2017;8:
735–747.
33. Katz DS, Hines J, Math KR, et al. Using CT to reveal fat- containing abnormalities of the pancreas. AJR Am J Roentgenol1999;172:393–396.
34. Kovanlikaya A, Mittelman SD, Ward A, et al. Obesity and fat quantification in lean tissues using three-point Dixon MR imaging.Pediatr Radiol2005;35:601–607.
35. Bracci PM. Obesity and pancreatic cancer: Overview of epidemiologic evidence and biologic mechanisms. Mol Carcinog2012;51:53–63.
36. Hori M, Takahashi M, Hiraoka N, et al. Association of pancreatic fatty infiltration with pancreatic ductal adeno- carcinoma.Clin Translat Gastroenterol2014;13:53.
37. Papachristou GI, Papachristou DJ, Avula H, et al. Obesity increases the severity of acute pancreatitis: Performance of APACHE-O score and correlation with the inflammatory response.Pancreatology2006;6:279–285.
38. Martinez J, Johnson CD, Sanchez-Paya J, et al. Obesity is a definitive risk factor of severity and mortality in acute pancreatitis: An updated meta-analysis. Pancreatology 2006;6:206–209.
39. Pietro A, Addeo JRD, Francois P, et al. Pancreatic fistula after a pancreaticoduodenectomy for ductal adenocarci- noma and its association with morbidity: A multicentre study of the French Surgical Association. HPB (Oxford) 2014;16:46–55.
40. Van Geenen EJ, Smits MM, Schreuder TC, et al. Non- alcoholic fatty liver disease is related to nonalcoholic fatty pancreas disease.Pancreas2010;39:1185–1190.
41. Chalasani N, Younossi Z, Lavine JE, et al. American Gastroenterological Association; American Association for the Study of Liver Diseases; American College of Gastro- enterology. The diagnosis and management of non- alcoholic fatty liver disease: Practice guideline by the American Gastroenterological Association, American As- sociation for the Study of Liver Diseases, and American College of Gastroenterology. Gastroenterology 2012;142:
1592–1609.
42. Yang FS, Yun CH, Wu TH, et al. High pericardial and peri- aortic adipose tissue burden in pre-diabetic and diabetic subjects.BMC Cardiovasc Disord2013;13:98.
43. Iozzo P. Myocardial, perivascular, and epicardial fat.Dia- betes Care2011;34:371–379.
44. Noyes AD, Dua K, Devadoss R, et al. Cardiac adipose tissue and its relationship to diabetes mellitus and cardio- vascular disease.World J Diabetes2014;5:868–876.
45. American Diabetes Association. Diagnosis and classifica- tion of diabetes mellitus.Diabetes Care2010;33:62–69.
46. Ohgi K, Okamura Y, Yamamoto Y, et al. Perioperative computed tomography assessments of the pancreas predict nonalcoholic fatty liver disease after pancreaticoduode- nectomy.Medicine (Baltimore)2016;95:25–35.
47. Zeb I, Li D, Nasir K, et al. Computed tomography scans in the evaluation of fatty liver disease in a population based study: The multi-ethnic study of atherosclerosis. Acad Radiol2012;19:811–818.
48. Smits MM, van Geenen EJ. The clinical significance of pancreatic steatosis.Nat Rev Gastroenterol Hepatol2011;
8:169–177.
49. Gao X, Fan J-G for the Study Group of Liver and Meta- bolism, Chinese Society of Endocrinology. Diagnosis and management of non-alcoholic fatty liver disease and related metabolic disorders: Consensus statement from the Study Group of Liver and Metabolism, Chinese Society of En- docrinology.J Diabetes2013;5:406–415.
50. Targher G, Day CP, Bonora E. Risk of cardiovascular disease in patients with nonalcoholic fatty liver disease.
N Engl J Med2010;363:1341–1350.
51. Cusi K. The role of adipose tissue and lipotoxicity in the pathogenesis of type 2 diabetes. Curr Diab Rep2010;10:
306–315.
52. Iacobellis G, Corradi D, Sharma AM. Epicardial adipose tissue: Anatomic, biomolecular and clinical relationships with the heart. Nat Clin Pract Cardiovasc Med 2005;10:
536–543.
53. Liu J, Fox CS, Hickson D, et al. Pericardial adipose tissue, atherosclerosis, and cardiovascular disease risk factors: The Jackson heart study.Diabetes Care2010;33:1635–1639.
54. Greif M, Becker A, von Ziegler F, et al. Pericardial adipose tissue determined by dual source CT is a risk factor for coronary atherosclerosis. Arterioscler Thromb Vasc Biol 2009;5:781–786.
55. Jonker JT, Lamb HJ, van der Meer RW, et al. Pioglitazone compared with metformin increases pericardial fat volume in patients with type 2 diabetes mellitus.J Clin Endocrinol Metab2010;95:456–460.
56. Rena G, Hardie DG, Pearson ER. The mechanisms of ac- tion of metformin.Diabetologia2017;60:1577–1585.
57. Yang J, Ren J, Song J, et al. Glucagon-like peptide 1 reg- ulates adipogenesis in 3T3-L1 preadipocytes. Int J Mol Med2013;31:1429–1435.
58. Weyer C, Bogardus C, Mott DM, et al. The natural history of insulin secretory dysfunction and insulin resistance in the pathogenesis of type 2 diabetes mellitus.J Clin Invest 1999;104:787–794.
59. van der Zijl NJ, Goossens GH, Moors CC, et al. Ectopic fat storage in the pancreas, liver, and abdominal fat depots:
Impact on beta-cell function in individuals with impaired glucose metabolism. J Clin Endocrinol Metab 2011;96:
459–467.
60. Chai J, Liu P, Jin E, et al. MRI chemical shift imaging of the fat content of the pancreas and liver of patients with type 2 diabetes mellitus.Exp Ther Med2016;11:476–480.
61. Saisho Y, Butler AE, Meier JJ, et al. Pancreas volumes in humans from birth to age one hundred taking into account sex, obesity, and presence of type-2 diabetes. Clin Anat 2007;20:933–942.
62. Haukeland JW, Konopski Z, Eggesbo HB, et al. Metformin in patients with non-alcoholic fatty liver disease: A ran- domized, controlled trial. Scand J Gastroenterol2009;44:
853–860.
63. Tock L, Damaso AR, De Piano A, et al. Long-term effects of metformin and lifestyle modification on nonalcoholic fatty liver disease obese adolescents.J Obes2010;201:pii:
831901.
64. Li Y, Liu L, Wang B, et al. Metformin in non-alcoholic fatty liver disease: A systematic review and meta-analysis.
Biomed Rep2013;57–64.
Address correspondence to:
La´szlo´ Czako´, MD, DSc First Department of Medicine University of Szeged Kora´nyi fasor 8-10 Szeged H-6720 Hungary E-mail:czako.laszlo@med.u-szeged.hu
AUTHOR QUERY FOR MET-2018-0086-VER9-ZSORI_1P AU1: Please identify (highlight or circle) all authors’ surnames for accurate indexing citations.
AU2: Please mention the author Eszter Pa´linka´s’s degree abbreviations (e.g., MS, MD, PhD).
AU3: Keywords have been taken from PDF file. Please check.
AU4: Earlier Refs. 50, 56, 61, 62, and 64 were duplicates of Refs. 7, 43, 27, 26, and 31, respectively. Hence, duplicate entries have been deleted, and references renumbered. Please check.
AU5: First column headings are missing in Tables 1–3. Please check.
AU6: Please mention the significance of ‘‘bold italic’’ values in Tables 2 and 3.