Contents lists available atScienceDirect
Thrombosis Research
journal homepage:www.elsevier.com/locate/thromres
Full Length Article
Sex-specific alteration to α2-antiplasmin incorporation in patients with type 2 diabetes
Agata Hanna Bryk
a,b, Jakub Siudut
a,b, Elżbieta Broniatowska
c, Zsuzsa Bagoly
d,e, Barbara Baráth
d, Éva Katona
d, Anetta Undas
a,b,⁎aInstitute of Cardiology, Jagiellonian University Medical College, Krakow, Poland
bJohn Paul II Hospital, Krakow, Poland
cFaculty of Medicine and Health Sciences, Andrzej Frycz Modrzewski Krakow University, Poland
dDivision of Clinical Laboratory Sciences, Department of Laboratory Medicine, Faculty of Medicine, University of Debrecen, Debrecen, Hungary
eMTA-DE Cerebrovascular and Neurodegenerative Research Group, Debrecen, Hungary
A R T I C L E I N F O Keywords:
Female gender Type 2 diabetes
α2-antiplasmin incorporation Hypofibrinolysis
Turbidimetry
A B S T R A C T
Background:Type 2 diabetes mellitus (T2DM) is associated with hypofibrinolysis and increased factor XIII- mediated α2-antiplasmin incorporation into the fibrin clot. It is unclear whether there are sex-related differences in α2-antiplasmin incorporation in relation to impaired clot lysis in T2DM.
Aim: We investigated α2-antiplasmin incorporation into fibrin clots as a determinant of clot lysability in patients of both sexes with T2DM.
Methods:In a group of 113 T2DM patients, 54 (47.8%) of which were women, we investigated α2-antiplasmin incorporation using an in-house sandwich enzyme-linked immunoassay and plasma clot lysis by turbidimetry, along with fibrinogen and thrombin generation using calibrated automated thrombogram and factor XIII ac- tivity.
Results:Female patients had 15.2% greater α2-antiplasmin incorporation into the fibrin clot (p= 0.008) and slightly higher plasma α2-antiplasmin concentration (p= 0.005) along with 8.4% longer time to 50% lysis (Lys50MA,p= 0.012) compared with men. Female patients had enhanced thrombin generation represented by shorter lag phase (p= 0.042), shorter time to peak (p= 0.033), and higher endogenous thrombin potential (p= 0.003) compared with men, while factor XIII activity was comparable between sexes (p= 0.085). On multivariate regression, patient sex and glycated hemoglobin (HbA1c) level were the predictors of α2-anti- plasmin incorporation in the entire patient group, while α2-antiplasmin incorporation was associated with Lys50MA, as were fibrinogen, male sex and body-mass index.
Conclusions:This study suggests that a more compromised fibrinolysis in diabetic women when compared with men could be in part mediated by increased α2-antiplasmin incorporation into the fibrin.
1. Introduction
Compelling evidence indicates that patients with type 2 diabetes mellitus (T2DM) have a prothrombotic fibrin clot phenotype char- acterized by the formation of compact fibrin meshwork of reduced permeability and lysability [1,2]. Several studies have shown that fi- brinolysis is more compromised in female patients with T2DM when
compared with males [3,4]. Mechanisms underlying this observation are poorly understood.
Factors known to be involved in impaired fibrinolysis in T2DM in- clude increased levels of plasminogen-activator inhibitor (PAI-1) and thrombin-activatable fibrinolysis inhibitor (TAFI) and a more compact clot structure associated with elevated fibrinogen concentrations, along with increased incorporation of antifibrinolytic proteins into the clot,
https://doi.org/10.1016/j.thromres.2019.09.032
Received 5 June 2019; Received in revised form 12 August 2019; Accepted 24 September 2019
Abbreviations:ACR, albumin-to-creatinine ratio; BMI, body-mass index; CI, confidence interval; CVD, cardiovascular disease; ELISA, enzyme-linked immunosorbent assay; ETP, endogenous thrombin potential; FXIII, factor XIII; eGFR, estimated glomerular filtration rate; HbA1c, glycated hemoglobin; HDL-C, high-density lipo- protein cholesterol; hs-CRP, high-sensitivity C-reactive protein; IL-6, interleukin 6; LDL-C, low-density lipoprotein cholesterol; Lys50MA, time to 50% lysis; LysT, time to complete lysis; MaxAbsL, maximum lysis absorbance; MI, myocardial infarction; PAI-1, plasminogen activator inhibitor 1; sFAP, soluble fibroblast activation protein; T2DM, type 2 diabetes; TAFI, thrombin-activatable fibrinolysis inhibitor; tPA, tissue plasminogen activator
⁎Corresponding author at: Institute of Cardiology, Jagiellonian University Medical College, 80 Pradnicka St., 31–202 Krakow, Poland.
E-mail address:mmundas@cyf-kr.edu.pl(A. Undas).
Available online 21 October 2019
0049-3848/ © 2019 The Authors. Published by Elsevier Ltd. This is an open access article under the CC BY-NC-ND license (http://creativecommons.org/licenses/BY-NC-ND/4.0/).
T
such as complement C3 and α2-antiplasmin [2]. In 2012, Alzahrani et al. showed in a large study that women with T2DM have a more compromised fibrinolysis when compared to men with T2DM assessed using a plasma-based assay [3]. Furthermore, impaired fibrinolysis in women was not attributable to fibrinogen or PAI-1 levels, but rather to elevated body-mass index (BMI) and low levels of high-density lipo- protein cholesterol (HDL-C) [3]. Patients with cardiovascular disease (CVD), among whom 20% also had T2DM, also showed sex-related differences in plasma clot lysability which were not related to levels of fibrinogen and inflammatory markers such as C-reactive protein (CRP), complement C3 and interleukin 6 (IL-6) [4]. To the best of our knowledge, the role of α2-antiplasmin incorporation in sex-associated alterations to fibrin clot properties has not yet been studied.
The major fibrinolysis inhibitor, α2-antiplasmin (67 kDa), is syn- thesized in the liver and circulates at a concentration of approximately 70 μg/mL (1 μM) and has a half-life of approximately 2.6 days [5]. α2- antiplasmin is cross-linked by glutamine 14 (or glutamine 2 in the Asn- α2-antiplasmin isoform) to lysine 303 of the fibrinogen Aα-chain by thrombin-activated factor XIII (FXIII) [6]. Using a purified-fibrinogen clot lysis model, diabetic patients without CVD have been demonstrated to incorporate more α2-antiplasmin into fibrin when compared to pa- tients without T2DM, without any sex-related differences [7].
Recently, increased α2-antiplasmin incorporation has been shown using a plasma-based clotting assay in young patients with diabetes (unspecified type) following myocardial infarction (MI) or ischemic stroke [8]. It is unknown whether there are any differences in this re- action between men and women with T2DM. We hypothesized that increased α2-antiplasmin incorporation might contribute to a more prothrombotic fibrin clot phenotype in women with T2DM.
We aimed to investigate α2-antiplasmin incorporation into fibrin in relation to plasma fibrin clot lysis in females and males with T2DM.
Moreover, we sought to identify factors which affect α2-antiplasmin incorporation in T2DM.
2. Materials and methods 2.1. Study design
In this cross-sectional study, we enrolled Caucasian patients aged
≥18 years who fulfilled the World Health Organization criteria for T2DM [9]. Patients were recruited in Cracow, Poland, between October 2016 and July 2017. This patient cohort was presented previously [10].
Briefly, the exclusion criteria were as follows: signs of acute infection, arterial or venous thromboembolic events within the previous six months, current anticoagulant therapy, known cancer, recent trauma or surgery, autoimmune diseases, and pregnancy. Demographic and clin- ical data, including the time since T2DM diagnosis, were collected upon enrollment. Comorbidities were defined in a previous study [10]. The Bioethics Committee at the Jagiellonian University Medical College approved the study. All subjects provided written, informed consent.
2.2. Laboratory investigations
Fasting blood samples were obtained from the antecubital vein be- tween 6 and 8 AM. Fasting glucose, white blood cells count, he- moglobin, platelet count, creatinine, albumin-to-creatinine ratio (ACR), total cholesterol, low-density-lipoprotein cholesterol (LDL-C), HDL-C, and triglycerides were assayed by routine laboratory techniques.
Estimated glomerular filtration rate (eGFR) was calculated using the Chronic Kidney Disease Epidemiology Collaboration equation. High- sensitivity C-reactive protein (hs-CRP) was measured by a latex-en- hanced turbidimetric immunoassay using a Cobas 6000 analyzer (Roche Diagnostics, Mannheim, Germany). Glycated hemoglobin (HbA1c) was measured by high-performance liquid chromatography using the Variant II Turbo analyzer (Hercules, CA, USA).
2.3. Coagulation and fibrinolysis parameters
Blood samples were mixed with 3.2% sodium citrate (9:1), cen- trifuged for 20 min and plasma was stored at −80 °C. Fibrinogen was determined using the von Clauss method. Plasminogen and α2-anti- plasmin activities were measured by chromogenic assays (Berichrom, Siemens, Munich, Germany). Commercially available enzyme-linked immunosorbent assays (ELISA) were used to measure PAI-1 antigen (Hyphen, Neuville-sur-Oise, France), TAFI (Hyphen), and interleukin-6 (IL-6; R&D Systems, Minneapolis, MN, USA). Activity of FXIII was measured by the ammonia release assay [11] using a commercially available reagent kit (REA-chrom FXIII kit, Reanal-ker, Budapest, Hungary; reference range: 69–143%, coefficient of variation: 3.8%).
2.4. Calibrated automated thrombogram
Assessment of the thrombin generation profile was performed as previously described [12]. Citrated plasma samples were thawed at 37 °C for 3 min and 5 mg/ml corn trypsin inhibitor was immediately added to achieve a 0.1 mg/ml final concentration. Eighty μl of each plasma sample was added to a 96-well plate followed by addition of relipidated tissue factor [13] at a final concentration of 5 pM. The fluorogenic substrate used was benzyloxycarbonyl-Gly-Gly-Arg-7- amido-4methylcoumarin·HCl (Z-GGR-AMC) (Bachem, Torrance, CA, USA). Twenty μl of a 2.5 mM Z-GGR-AMC/90 mM CaCl2 solution in HEPES-buffered saline was added to plasma samples to achieve final concentrations of 417 μM and 15 mM, respectively. A 3 min incubation period at 37 °C followed to allow recalcification of the plasma. Twenty μl of a 120 μM phospholipid vesicle solution (25% dioleoyl-sn-glycero- 3-phospho-L serine and 75% 1,2-dioleoyl-sn-glycero-3-phosphocholine) (Avanti Polar Lipids, Inc., Alabaster, Al) in HEPES-buffered saline was then added to plasma samples to achieve a final concentration of 20 μM, thus initiating thrombin generation. Fluorescence readings began im- mediately and hydrolysis of the AMC (7-amino-4-methylcoumarin) substrate (at 370 nm excitation and 460 nm emission wavelengths) was followed over a 3600 s period. Changes in fluorescence were converted to thrombin concentration using a calibration curve built by sequential dilutions of human thrombin (Haematologic Technologies, Inc., Essex Junction, VT). Human thrombin was produced in-house [14]. We used a plate reader, the BioTek Synergy 4 and the Gen5 plate reader software (BioTek, Winooski, VT, USA) to generate the following parameters: (a) time following addition of the trigger until initiation of thrombin gen- eration (lag phase, seconds); (b) peak thrombin (nmol/l); (c) time to reach the peak (time-to peak, seconds); (d) area under the curve, de- fined as endogenous thrombin potential (ETP, nmol/l thrombin*se- conds).
2.5. Clot permeability and lysability
Fibrin clot structure and lysability were evaluated by a turbidi- metric method as previously described by Carter et al. [15]. Briefly, 25 μl of citrated plasma, mixed with 12.5 ng of recombinant tissue plasminogen activator (tPA, Actilyse, Boehringer Ingelheim, Biberach, Germany) in 75 μl of a lysis buffer (0.05 mol/l Tris-HCl, 0.1 mol/l NaCl, pH 7.4), and 50 μl of activation mix (final concentrations: 0.03 U/ml thrombin [Merck KGaA, Darmstadt, Germany], and 7.5 mmol/l calcium in assay buffer), were added to each well of the 96-well plate using a multichannel pipette at 15 s intervals. Plates were read at 340 nm every 12 s during a period of 1 h in a microplate reader (Sunrise Reader, Tecan, Maennedorf, Switzerland). The following parameters were re- corded: a) Clot maximum absorbance (arbitrary units, au) indicating network density, b) Lysis time (Lys50MA, seconds) corresponding to time from full clot formation to 50% lysis, indicating fibrinolytic po- tential; c) Time to complete lysis (LysT, seconds) indicating the time from clot maximum absorbance to the time for absorbance values to return to baseline; d) Lysis area (au), reflecting the balance between
clot formation and lysis. Differences in clot lysis time were confirmed using protocol previously described by Pieters et al. with tPA con- centration of 18–20 ng/ml [16]. Clot lysis time was calculated as the time from the midpoint, from clear to maximum turbidity, to the midpoint in the transition from maximum turbidity to the final baseline turbidity.
2.6. α2-antiplasmin incorporation assay
The extent of α2-antiplasmin incorporation into fibrin clots was determined using an assay described previously [17]. Briefly, α2-anti- plasmin antigen levels of citrated plasma samples were measured using an in-house ELISA that detects all forms of α2-antiplasmin and is not influenced by the presence of plasmin-antiplasmin complexes (re- ference range: 48–85 mg/l). Next, 200 μl of citrated plasma samples were clotted with 2 U/l human thrombin (Sigma-Aldrich, St. Louis, MO, USA) and 12.5 mM CaCl2at 37 °C for 30 min and the amount of non- clot-bound α2-antiplasmin was determined from the serum of the clots, obtained by a 10 min centrifugation. The extent of α2-antiplasmin in- corporation was calculated based on the difference in the amount of α2- antiplasmin between plasma and serum samples using the following formula: extent of α2-antiplasmin incorporation (mg/l) = amount of α2-antiplasmin in plasma (mg/l) − amount of α2-antiplasmin in serum (mg/l).
2.7. Statistical analysis
Categorical variables were presented as numbers (percentages) and compared using Fisher's exact test for 2 × 2 contingency tables and Pearson's chi–squared test for other tables. Continuous variables were expressed as mean ± standard deviation or median and interquartile range. Normality was assessed by the Shapiro–Wilk test. Differences between groups were compared using the Student'st-test for normally distributed continuous variables or the Mann–Whitney U test for non–normally distributed continuous variables. Pearson's correlation coefficient was calculated for normally distributed variables while Spearman's correlation coefficient was determined for non-normally distributed variables. Univariate linear regression model was used to assess the coefficient of determination (R2) representing the contribu- tion of α2-antiplasmin incorporation to the variance of Lys50MA. Backward stepwise multivariate regression models were used to in- vestigate associations between (1) α2-antiplasmin incorporation and metabolic determinants (plasma glucose, HbA1c, diabetes duration, total cholesterol and HDL-C) and determinants associated with T2DM complications (CVD, albuminuria and serum creatinine); (2) Lys50MA
and coagulation and fibrinolysis components (fibrinogen, plasminogen, PAI-1, TAFI, FXIII and plasma α2-antiplasmin) and α2-antiplasmin in- corporation. All variables which were non-normally distributed were log-transformed before inclusion in the model. The effect of each variables was characterized in a regression model using 95% confidence interval (CI) for the regression coefficients with p-values. Two–sided p–values < 0.05 were considered statistically significant. All calcula- tions were done with Statistica (v. 12.5, StatSoft, Inc., Tulsa, OK, USA) and R package [18].
3. Results
3.1. General characteristics of men and women
Female patients did not differ from males in regard to age and BMI, however, they weighed less (Table 1). As few as 2 (3.7%) female pa- tients were of reproductive age, while the rest of the patients were postmenopause. One (1.9%) woman was receiving hormone replace- ment therapy, while 2 (3.7%) other patients had received it in the past.
Female patients had slightly lower hemoglobin, higher platelet count, higher total cholesterol and higher HDL-C compared with male subjects
(Table 1). In terms of coagulation and fibrinolysis parameters, female patients had lower PAI-1 compared with men, while fibrinogen, plas- minogen and TAFI were similar in both sexes (Table 2). Inflammation markers, CRP and IL-6, were comparable between sexes (Table 2). Fe- male sex was associated with enhanced thrombin generation re- presented by shorter time-to-peak (−5.3%,p= 0.033) and higher ETP (+14.7%,Table 2). Factor XIII activity was comparable between sexes (Table 2).
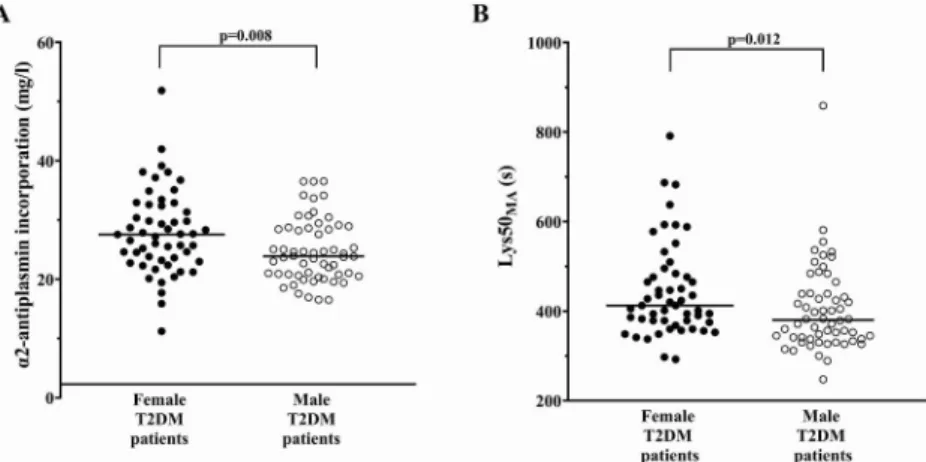
Women had increased α2-antiplasmin incorporation into the clot (27.50 [23.19–32.40] vs. 23.88 [20.79–28.60] mg/l, p= 0.008, Fig. 1A), which was also seen after adjustment for BMI (p= 0.005).
Moreover, women displayed higher plasma α2-antiplasmin concentra- tion (64.70 [60.55–71.10] vs. 60.91 [55.23–66.50] mg/l,p= 0.005) and increased α2-antiplasmin activity (107.0 [103.0–113.0] vs. 99.0 [94.0–106.0] %, p< 0.001) when compared with men. Female sex was associated with impaired fibrinolysis represented by longer Lys50MA(Fig. 1B,Table 2). Sex did not affect LysT(Table 2). Prolonged clot lysis time in women with T2DM when compared with men with T2DM was confirmed using assay by Pieters et al. (128.0 [104.0–169.0]
vs. 116.5 [88.7–141.7] min,p= 0.029).
3.2. Factors affecting α2-antiplasmin incorporation
When female and male patients with T2DM were analyzed together, patients with α2-antiplasmin incorporation in the top quartile (≥29.79 mg/l) did not differ from the remainder with regard to age, BMI, or time since T2DM (data not shown). α2-antiplasmin in- corporation in the top quartile was associated with slightly decreased hemoglobin (133 ± 14 vs. 139 ± 12 g/l,p= 0.043), elevated platelet count (260 ± 64 vs. 221 ± 58 × 109/l, p= 0.007) and increased fasting glucose (8.0 [6.8–9.1] vs. 6.9 [5.9–8.1] mmol/l, p= 0.025) when compared with the remainder. Patients with α2-antiplasmin in- corporation in the top quartile had higher fibrinogen (+11.8%, p= 0.010) and plasminogen (+10.7%,p= 0.002) compared with the remainder (Table 2). α2-antiplasmin incorporation was correlated with its activity (r= 0.409,p< 0.001), fibrinogen (r= 0.229,p= 0.016), and FXIII activity (r= 0.449,p< 0.001). FXIII activity was also in- creased in patients with α2-antiplasmin incorporation in the top quartile when compared with the remainder (Table 2). In terms of thrombin generation, patients with α2-antiplasmin incorporation in the top quartile had markedly higher peak thrombin (+30.2%,p= 0.018) and slightly elevated ETP (+12.2%,p= 0.035) when compared with the remainder (Table 2).
In the multivariate regression model, sex and HbA1c level were predictors of α2-antiplasmin incorporation (Fig. 2A).
Prior MI and CVD did not associate with α2-antiplasmin in- corporation (p= 0.80 and p= 0.88, respectively). Treatment with metformin, sulfonylurea, insulin or other medications did not affect α2- antiplasmin incorporation (data not shown).
3.3. α2-antiplasmin incorporation and clot lysis time
When female and male patients with T2DM were analyzed together, prolonged lysis time as evidenced by increased Lys50MA (+23.0%, p< 0.001), LysT (+11.0%, p= 0.004) and lysis area (+7.1%, p= 0.028,Table 2) were detected in patients with α2-antiplasmin in- corporation in the top quartile when compared with the remainder. In univariate linear regression, α2-antiplasmin incorporation accounted for 22.6% of the total variance in Lys50MA(p< 0.001). In a multi- variate model adjusted for age, sex and BMI, α2-antiplasmin in- corporation was found to be a predictor of Lys50MA (whole model R2= 0.32,Fig. 2B). According to the following equation utilizing log- transformed variables as appropriate: Log(Lys50MA) = 0.31*log(In- corporated α2-antiplasmin) + 0.24*log(fibrinogen)-0.008*log(PAI-1)- 0.08*male sex+0.29*log(BMI) + 3.81, diabetic females had 8% higher Lys50MAwhen compared with men.
Table 1
Comparison of demographic data, comorbidities, medications and routine laboratory investigations between female and male patients with type 2 diabetes (T2DM).
Variable All
(n= 113) Female
(n= 54, 47.8%) Male
(n= 59, 52.2%) p-Value
Age, years 63.8 ± 8.2 64.6 ± 7.7 62.9 ± 8.6 0.28
Weight, kg 89.0 (79.5–102.0) 81.0 (73.0–90.0) 101.0 (85.0–114.0) < 0.001
BMI, kg/m2 32.0 (29.4–37.2) 32.0 (29.4–35.9) 32.3 (29.1–37.9) 0.58
Obesity, n (%) 76 (67.3) 36 (66.7) 40 (67.8) 1.0
Current smoking 16 (14.2) 4 (7.4) 12 (20.3) 0.061
Family history of CVD 31 (27.4) 21 (38.9) 10 (16.9) 0.011
T2DM data
HbA1c, % 6.9 (6.1–8.2) 6.7 (6.0–7.9) 7.7 (6.1–8.4) 0.10
Time since T2DM diagnosis, years 7.0 (3.0–15.0) 8.0 (3.0–17.0) 7.0 (3.0–12.0) 0.20
Comorbidities, n (%)
Arterial hypertension 105 (92.9) 52 (96.3) 53 (89.8) 0.28
CVD 54 (47.8) 22 (40.7) 31 (52.5) 0.26
Previous MI 21 (18.6) 7 (13.0) 14 (23.7) 0.16
Heart failure 9 (8.0) 4 (7.4) 5 (8.5) 1.0
Medication, n (%)
Aspirin 74 (65.4) 33 (61.1) 41 (69.5) 0.43
Clopidogrel 9 (7.9) 4 (7.4) 5 (8.5) 1.0
β-blocker 82 (72.6) 43 (79.6) 39 (66.1) 0.14
Statin 75 (66.4) 38 (70.4) 37 (62.7) 0.43
ACEI 63 (55.8) 31 (57.4) 32 (54.2) 0.85
ARB 35 (31.0) 15 (27.8) 20 (33.9) 0.54
Calcium antagonist 49 (43.4) 25 (46.3) 24 (40.7) 0.57
Thiazide 37 (32.7) 17 (31.5) 20 (33.9) 0.84
Indapamide 26 (23.0) 15 (27.8) 11 (18.6) 0.27
Loop diuretics 21 (18.6) 11 (20.4) 10 (16.9) 0.81
Antidiabetic treatment, n (%)
No hypoglycemic drugs 8 (7.1) 1 (1.9) 7 (11.9) 0.09
Oral drug (metformin, sulfonylurea or both) 60 (53.1) 32 (59.3) 28 (47.5)
Insulin 13 (11.5) 4 (7.4) 9 (15.3)
Insulin and oral drug 32 (28.3) 17 (31.5) 15 (25.4)
Laboratory investigations
Fasting glucose, mmol/l 7.30 (6.00–8.50) 6.80 (6.00–7.90) 7.40 (5.95–9.10) 0.10
WBC,×106/l 7.4 ± 1.6 7.6 ± 1.7 7.3 ± 1.6 0.30
Hemoglobin, g/l 138 ± 13 132 ± 12 142 ± 12 < 0.001
Platelet count,×109/l 231.9 ± 61.4 263.4 ± 55.2 203.1 ± 52.3 < 0.001
ACR, mg/g creatinine 7.6 (3.98–21.9) 5.70 (3.94–13.00) 9.63 (4.42–35.80) 0.09
ACR ≥30 mg/g creatinine 21 (18.6) 6 (11.1) 15 (25.4) 0.06
(continued on next page)
4. Discussion
Our study shows that more compromised fibrinolysis in T2DM fe- male patients, compared with T2DM males, is associated with increased α2-antiplasmin incorporation into the clot. This difference was ob- served despite similar BMI, HbA1c with no association with con- comitant CVD. Elevated plasma α2-antiplasmin incorporation in female diabetic patients was accompanied by increased thrombin generation, possibly leading to faster FXIII activation, responsible for α2-anti- plasmin cross-linking to fibrin. Our findings provide additional in- formation on the regulation of fibrinolysis in T2DM, highlighting the complex gender-related differences.
To the best of our knowledge, we are the first group to observe that α2-antiplasmin incorporation is associated with impairment of fi- brinolysis in female patients with T2DM. It is unclear which
mechanisms could be responsible for the increased α2-antiplasmin in- corporation in females when compared to males. Enhanced cross- linking of commercially available human α2-antiplasmin observed in experiments with fibrinogen purified from plasma of uncontrolled T2DM patients, indicated that fibrinogen and fibrin glycation increases incorporation of normal α2-antiplasmin [7]. It seems rather unlikely that HbA1c determines the differences in α2-antiplasmin incorporation as both HbA1c and sex were independent predictors of α2-antiplasmin incorporation in the multivariate regression model. Metformin, which has been reported to exert several effects on prothrombotic mechanisms in T2DM [19,20], did not associate with α2-antiplasmin incorporation in the present study. To our knowledge, there is no data on the glyca- tion of α2-antiplasmin molecule, and whether it occurs in the proximity of the glutamine residue responsible for cross-linking with fibrinogen.
N-terminus cleavage by soluble fibroblast activation protein (sFAP) Table 1(continued)
Variable All
(n= 113) Female
(n= 54, 47.8%) Male
(n= 59, 52.2%) p-Value
eGFR, ml/min/m2 84.0 (69.0–92.0) 79.0 (68.0–92.0) 85.0 (72.0–93.0) 0.15
eGFR ≤60 ml/min/1.73 m2 17 (15.0) 11 (20.4) 6 (10.2) 0.19
Total cholesterol, mmol/l 4.20 (3.50–5.30) 4.50 (3.88–5.30) 3.92 (3.23–5.20) 0.032
LDL-C, mmol/l 2.50 (1.80–3.50) 2.70 (2.15–3.40) 2.45 (1.63–3.50) 0.13
HDL-C, mmol/l 1.20 (1.0–1.50) 1.40 (1.16–1.70) 1.05 (0.87–1.30) < 0.001
Triglycerides, mmol/l 1.50 (1.17–2.00) 1.50 (1.16–1.80) 1.67 (1.18–2.30) 0.11
Categorical variables are presented as numbers (percentages) and were compared by the Fisher's exact test for 2 × 2 contingency tables. Continuous variables are expressed as mean ± standard deviation or median and interquartile range. Differences between groups were compared using the Student'st-test for normally distributed continuous variables or the Mann–WhitneyUtest for non–normally distributed continuous variables.
BMI denotes body-mass index; HbA1c, glycated hemoglobin; CVD, cardiovascular disease; MI, myocardial infarction; ACEI, angiotensin-converting enzyme inhibitor;
ARB, angiotensin receptor blocker; eGFR, estimated glomerular filtration rate; WBC, white blood cells; ACR, albumin-to-creatinine ratio; LDL-C, low-density lipo- protein cholesterol; HDL-C, high-density lipoprotein cholesterol.
Table 2
Comparison of fibrin clot components and phenotype between female and male patients.
Variable Female
(n= 54, 47.8%) Male
(n= 59, 52.2%) p-Value Patients with α2-antiplasmin incorporation p-Value
≥29.79 mg/dl
(n= 28, 25.2%) < 29.79 mg/dl (n= 86, 74.8%) Coagulation and fibrinolysis components
Fibrinogen, g/l 3.40 (3.06–4.00) 3.49 (3.17–3.80) 0.94 3.80 (3.31–4.00) 3.40 (3.09–3.80) 0.010
Plasminogen, % 109.5 (101.0–118.0) 109.0 (99.0–124.0) 0.70 118.5 (106.5–125.0) 107.0 (99.0–117.0) 0.002
PAI-1, ng/ml 34.80 ± 6.26 37.91 ± 7.62 0.020 36.1 ± 6.67 36.7 ± 7.30 0.68
TAFI, % 104.5 (95.0–114.0) 101.0 (88.0–113.0) 0.10 101.20 ± 13.80 104.2 ± 14.02 0.34
Factor XIII activity, % 134.3 ± 36.78 122.09 ± 37.25 0.085 150.50 ± 31.62 120.90 ± 36.72 < 0.001
Inflammation markers
C-reactive protein, mg/l 3.30 (1.47–5.60) 1.88 (1.08–3.70) 0.78 3.20 (1.55–5.70) 2.1 (1.10–4.40) 0.17
Interleukin 6, pg/ml 4.00 (2.76–5.70) 3.55 (2.43–6.00) 0.61 4.10 (2.81–5.30) 3.50 (2.20–6.70) 0.87
Thrombin generation
Lag phase, s 940 (729–1216) 1067 (859–1444) 0.042 1024 (716–1222) 1008 (839–1359) 0.12
Peak thrombin, nmol/l 116.0 (96.9–159.3) 117.3 (86.6–153.0) 0.41 148.0 (104.0–167.9) 113.7 (86.7–142.1) 0.018
Time-to-peak, s 1330 (1015–1691) 1405 (1171–2022) 0.033 1245 (998–1684) 1430.5 (1164.0–1911.5) 0.056
ETP, nM*s 114,474 ± 26,429 99,796 ± 26,907 0.004 115,870 ± 26,826 103,314 ± 26,828 0.035
Clot lysis parameters
MaxAbsL, au 0.40 (0.33–0.40) 0.38 (0.33–0.40) 0.97 0.40 (0.36–0.50) 0.40 (0.33–0.40) 0.047
Lys50MA, s 413 (377–480) 380 (338–439) 0.012 471 (401–555) 383 (345–435) < 0.001
LysT, s 795 (690–878) 743 (660–833) 0.15 825 (788–930) 743 (653–833) 0.004
Lysis area, au 986 (864–1101) 994 (895–1221) 0.22 1029 (976–1238) 961 (864–1105) 0.028
Data were presented as mean ± standard deviation or median and interquartile range. Groups were compared using the Student'st-test for normally distributed continuous variables or the Mann–Whitney Utest for non–normally distributed continuous variables. PAI-1 denotes plasminogen activator inhibitor 1; TAFI, thrombin activatable fibrinolysis inhibitor; ETP, endogenous thrombin potential; MaxAbsL, maximum clot absorbance in lysis assay; Lys50MA, time to 50% lysis; LysT, time to complete lysis.
Data on α2-antiplasmin incorporation and Lys50MAwere available for 111 and 110 patients, respectively.
occurs in the proximity of this glutamine, resulting in increased velocity of α2-antiplasmin cross-linking to fibrin [5]. While reduced activity of sFAP in healthy women when compared to men has been previously reported [21], the association between sex and sFAP level in T2DM requires verification in further studies. BMI has been identified as an anthropometric factor associated with prothrombotic fibrin clot in diabetic women [3]. BMI predicted α2-antiplasmin incorporation in our study, when analyzing women and men together. Obesity exerts several effects on the thrombotic milieu associated with insulin resistance.
Since there was no difference between sexes with regard to BMI, it is unlikely that obesity-related phenomena affected the relationship be- tween prolonged clot lysis and increased α2-antiplasmin cross-linking in women when compared with men.
Another important finding of our study is the positive association between α2-antiplasmin incorporation and clot lysability as determined
by the turbidimetric assay in T2DM patients. The turbidimetric assay provides dynamic analysis of clot lysis and global assessment of the fibrin phenotype and has been successfully used to study fibrinolysis in T2DM [3,4], metabolic syndrome [15] and myocardial infarction [22].
The only study on turbidimetric lysis time in relation to α2-antiplasmin incorporation involved type 1 diabetes, and the authors did not identify any sex-related differences [23]. In our study increased α2-antiplasmin incorporation in female T2DM patients was associated with prolonged Lys50MAwith no sex-related differences for LysT. Clot lysis time as- sessment with lower concentration of tPA allowed to fully appreciate the difference in clot lysis time between women and men with T2DM.
Unexpectedly, in contrast to previous data [3], we found that female T2DM patients had lower PAI-1 when compared with men, which could be attributed to the markedly lower weight of female patients [24]. PAI- 1 is an important fibrinolysis inhibitor responsible for 40% of the Fig. 1.Comparison of α2-antiplasmin incorporation (A) and lysis time (Lys50MA, B) between female (black dots) and male (white dots) patients with type 2 diabetes mellitus (T2DM). Horizontal line represents median value. Data on α2-antiplasmin incorporation and Lys50MAwere available for 111 and 110 patients, respectively.
Fig. 2.Predictors of α2-antiplasmin incorporation (A) and lysis time (Lys50MA, B) in patients with type 2 diabetes mel- litus. Results are shown as multivariable regression coeffi- cients with 95% confidence interval (CI). Due to the im- portance of the plasminogen activator inhibitor-1 (PAI-1) for fibrinolysis, PAI-1 was retained in the regression model, al- though insignificant. HbA1c denotes glycated hemoglobin;
BMI, body-mass index.
variation in clot lysis time determined by Lisman method in general population [25] and up to 13% of the variation in turbidimetric lysis variables investigated by Carter method among healthy subjects and patients with metabolic syndrome [15]. PAI-1 and α2-antiplasmin in- hibit fibrinolysis by different mechanisms and different are the re- lationships between antigen and activity among those two inhibitors.
PAI-1 is released from platelets and the endothelium and inhibits tPA [26]. In plasma, PAI-1 activity and PAI-1 antigen are correlated with the coefficient of 0.8, and approximately two thirds of the PAI-1 antigen is functionally active [27]. α2-antiplasmin, secreted by the liver, is cross-linked to the fibrin clot and inhibits plasmin [26]. Decreased PAI- 1 in the female patients with type 2 diabetes mellitus when compared with male patients might suggest attenuated inhibition of tissue plas- minogen activator, leading to higher plasmin generation which is in- hibited by the increased cross-linking of plasma α2-antiplasmin into the fibrin clot. These changes may result in prolonged clot lysis time. We observed that α2-antiplasmin incorporation did not relate to the clot maximum absorbance, which was comparable among sexes, being as- sociated with similar fibrinogen concentrations in patients included in our study.
Analysis of thrombin generation profiles in T2DM yielded inter- esting observations in the context of fibrinolysis. Patients with T2DM have been reported by several groups to display enhanced thrombin generation in comparison to controls [28–30], and a more hypercoa- gulable clot has been reported in apparently healthy female subjects as compared with men [4]. Since 90% of α2-antiplasmin incorporation is FXIII-dependent [8], and FXIII becomes activated by thrombin [6], it would be expected that women with T2DM who have increased α2- antiplasmin incorporation could demonstrate increased thrombin gen- eration as compared with men. Indeed in the present study, female diabetic patients were characterized by faster formation of the total amounts of thrombin (which can be generated in a plasma sample) when compared with male subjects. Women have been reported to have elevated platelet count when compared with men [31,32], while pla- telet-dependent thrombin generation has been reported to be higher in patients with poorly glycemic-controlled T2DM when compared with healthy subjects [33]. Based on those reports we suspect that faster formation of thrombin might result in faster FXIII activation and ulti- mately to different clot structure, including increased α2-antiplasmin incorporation.
Our study had several limitations. First, the sizes of study groups were limited, although the study was sufficiently powered to show the difference in Lys50MAand α2-antiplasmin incorporation among sexes.
Secondly, assessment of plasma fibrin ex vivo eliminated the potential influence of platelet or endothelial factors on clot properties. It cannot be ruled out that in platelet-rich plasma the importance of the elevated α2-antiplasmin would be relatively lower given the high PAI-1 content secreted from the platelets [34,35]. Using clot compaction [36] could amplify the difference in α2-antiplasmin incorporation between women and men with T2DM. Finally, due to the cross-sectional design of the study, it provided only single assessment of associations between clot components and its phenotype. Our investigation was meant to be a hypothesis-generating study and possible mechanisms of observed re- lationships should be established in further studies.
In summary, our findings increase the current knowledge on factors affecting efficiency of fibrinolysis in patients with T2DM, showing an association between compromised fibrinolysis and increased α2-anti- plasmin incorporation into the fibrin clot in female patients when compared with male subjects. Further studies are required to elucidate the mechanisms underlying this association.
Financial support
This work was supported by the 2016/21/N/NZ5/01425 grant from the Polish National Science Centre (to A.H.B.), by the Jagiellonian University Medical College grant to A.U. (K/ZDS/005802), grants from
the Hungarian National Office for Research and Technology (K120633 to É.K. and FK128582 to Z.B.) and GINOP-2.3.2-15-2016-00043 co-fi- nanced by the European Union and the European Regional Development Fund (to Z.B.).
Declaration of competing interest None.
References
[1] M. Ząbczyk, A. Undas, Plasma fibrin clot structure and thromboembolism: clinical implications, Pol. Arch. Intern. Med. 127 (2017) 873–881,https://doi.org/10.
20452/pamw.4165.
[2] K. Kearney, D. Tomlinson, K. Smith, R. Ajjan, Hypofibrinolysis in diabetes : a therapeutic target for the reduction of cardiovascular risk, Cardiovasc. Diabetol. 16 (2017) 34,https://doi.org/10.1186/s12933-017-0515-9.
[3] S.H. Alzahrani, K. Hess, J.F. Price, M. Strachan, P.D. Baxter, R. Cubbon, F. Phoenix, T. Gamlen, R.A. Ariëns, P.J. Grant, R.A. Ajjan, Gender-specific alterations in fibrin structure function in type 2 diabetes: associations with cardiometabolic and vas- cular markers, J. Clin. Endocrinol. Metab. 97 (2012) E2282–2287,https://doi.org/
10.1210/jc.2012-2128.
[4] S. Neergaard-Petersen, A.-M. Hvas, S.D. Kristensen, E.L. Grove, S.B. Larsen, F. Phoenix, Z. Kurdee, P.J. Grant, R.A. Ajjan, The influence of type 2 diabetes on fibrin clot properties in patients with coronary artery disease, Thromb. Haemost.
112 (2014) 1142–1150,https://doi.org/10.1160/TH14-05-0468.
[5] S. Abdul, F.W. Leebeek, D.C. Rijken, S. Uitte de Willige, Natural heterogeneity of α2-antiplasmin: functional and clinical consequences, Blood. 127 (2016) 538–545, https://doi.org/10.1182/blood-2015-09-670117.
[6] L. Muszbek, Z. Bereczky, Z. Bagoly, I. Komáromi, É. Katona, Factor XIII: a coagu- lation factor with multiple plasmatic and cellular functions, Physiol. Rev. 91 (2011) 931–972,https://doi.org/10.1152/physrev.00016.2010.
[7] E.J. Dunn, H. Philippou, R.A. Ariëns, P.J. Grant, Molecular mechanisms involved in the resistance of fibrin to clot lysis by plasmin in subjects with type 2 diabetes mellitus, Diabetologia. 49 (2006) 1071–1080,https://doi.org/10.1007/s00125- 006-0197-4.
[8] S. Uitte de Willige, J.J.C.M. Malfliet, S. Abdul, F.W.G. Leebeek, D.C. Rijken, The level of circulating fibroblast activation protein correlates with incorporation of alpha-2-antiplasmin into the fibrin clot, Thromb. Res. 166 (2018) 19–21,https://
doi.org/10.1016/j.thromres.2018.03.018.
[9] WHO, Definition and Diagnosis of Diabetes Mellitus and Intermediate Hyperglycemia: Report of a WHO/IDF Consultation, (2006).
[10] A.H. Bryk, S.M. Prior, K. Plens, M. Konieczynska, J. Hohendorff, M.T. Malecki, S. Butenas, A. Undas, Predictors of neutrophil extracellular traps markers in type 2 diabetes mellitus: associations with a prothrombotic state and hypofibrinolysis, Cardiovasc. Diabetol. 18 (2019) 49,https://doi.org/10.1186/s12933-019-0850-0.
[11] L. Kárpáti, B. Penke, E. Katona, I. Balogh, G. Vámosi, L. Muszbek, A modified, optimized kinetic photometric assay for the determination of blood coagulation factor XIII activity in plasma, Clin. Chem. 46 (2000) 1946–1955http://clinchem.
aaccjnls.org/content/46/12/1946.long.
[12] K.G. Mann, M.F. Whelihan, S. Butenas, T. Orfeo, Citrate anticoagulation and the dynamics of thrombin generation, J. Thromb. Haemost. 5 (2007) 2055–2061, https://doi.org/10.1111/j.1538-7836.2007.02710.x.
[13] K.M. Cawthern, C. van't Veer, J.B. Lock, M.E. DiLorenzo, R.F. Branda, K.G. Mann, Blood coagulation in hemophilia A and hemophilia C, Blood. 91 (1998) 4581–4592 https://www.ncbi.nlm.nih.gov/pubmed/9616154.
[14] R.L. Lundblad, H.S. Kingdon, K.G. Mann, Thrombin, Methods Enzymol. 45 (1976) 156–176.
[15] A.M. Carter, C.M. Cymbalista, T.D. Spector, P.J. Grant, Heritability of clot forma- tion, morphology, and lysis: the EuroCLOT study, Arterioscler. Thromb. Vasc. Biol.
27 (2007) 2783–2789,https://doi.org/10.1161/ATVBAHA.107.153221.
[16] M. Pieters, H. Philippou, A. Undas, Z. de Lange, D.C. Rijken, N.J. Mutch, An in- ternational study on the feasibility of a standardized combined plasma clot turbidity and lysis assay: communication from the SSC of the ISTH, J. Thromb. Haemost. 16 (2018) 1007–1012,https://doi.org/10.1111/jth.14002.
[17] A. Teráz-Orosz, A. Csapó, Z. Bagoly, E.G. Székely, E. Tóth, B. Kovács, Z. Bereczky, L. Muszbek, É. Katona, A new ELISA method for the measurement of total α2- plasmin inhibitor level in human body fluids, J. Immunol. Methods 471 (2019) 27–33,https://doi.org/10.1016/j.jim.2019.05.004.
[18] R Core Team, R: A Language and Environment for Statistical Computing, R Foundation for Statistical Computing, Vienna, Austria, 2018 Available online at https://www.R-project.org/(n.d.).
[19] P.J. Grant, Beneficial effects of metformin on haemostasis and vascular function in man, Diabetes Metab. 29 (2003) 6S44–6S52,https://doi.org/10.1016/S1262- 3636(03)72787-6.
[20] A. Retwiński, M. Kosmalski, M. Crespo-Leiro, A. Maggioni, G. Opolski,
P. Ponikowski, L. Poloński, E. Jankowska, J. Drzewoski, J. Drożdż, The influence of metformin and the presence of type 2 diabetes mellitus on mortality and hospita- lisation in patients with heart failure, Kardiol. Pol. 76 (2018) 1336–1343,https://
doi.org/10.5603/KP.a2018.0127.
[21] S. Uitte, D. Willige, J.J.M.C. Malfliet, J.W. Deckers, D.W. Dippel, F.W. Leebeek, D.C. Rijken, Plasma levels of soluble fibroblast activation protein in arterial
thrombosis: determinants and cleavage of its substrate alpha-2-antiplasmin, Int. J.
Cardiol. 178 (2015) 105–110,https://doi.org/10.1016/j.ijcard.2014.10.091.
[22] W. Sumaya, L. Wallentin, S.K. James, A. Siegbahn, K. Gabrysch, M. Bertilsson, A. Himmelmann, R.A. Ajjan, R.F. Storey, Fibrin clot properties independently predict adverse clinical outcome following acute coronary syndrome: a PLATO substudy, Eur. Heart J. 39 (2018) 1078–1085,https://doi.org/10.1093/eurheartj/
ehy013.
[23] A. Agren, G. Jörneskog, G. Elgue, P. Henriksson, H. Wallen, B. Wiman, Increased incorporation of antiplasmin into the fibrin network in patients with type 1 dia- betes, Diabetes Care 37 (2014) 2007–2014,https://doi.org/10.2337/dc13-1776.
[24] M.C. Alessi, I. Juhan-Vague, PAI-1 and the metabolic syndrome: links, causes, and consequences, Arterioscler. Thromb. Vasc. Biol. 26 (2006) 2200–2207,https://doi.
org/10.1161/01.ATV.0000242905.41404.68.
[25] M.E. Meltzer, C.J. Doggen, P.G. de Groot, F.R. Rosendaal, T. Lisman, Plasma levels of fibrinolytic proteins and the risk of myocardial infarction in men, Blood. 116 (2010) 529–536,https://doi.org/10.1182/blood-2010-01-263103.
[26] A. Undas, R.A.S. Ariëns, Fibrin clot structure and function: a role in the patho- physiology of arterial and venous thromboembolic diseases, Arterioscler. Thromb.
Vasc. Biol. 31 (2011) e88–e99,https://doi.org/10.1161/ATVBAHA.111.230631.
[27] P.J. Declerck, M.C. Alessi, M. Verstreken, E.K. Kruithof, I. Juhan-Vague, D. Collen, Measurement of plasminogen activator inhibitor 1 in biologic fluids with a murine monoclonal antibody-based enzyme-linked immunosorbent assay, Blood. 71 (1988) 220–225http://www.ncbi.nlm.nih.gov/pubmed/3257145.
[28] L. Ay, F. Hoellerl, C. Ay, J.M. Brix, S. Koder, G.H. Schernthaner, I. Pabinger, G. Schernthaner, Thrombin generation in type 2 diabetes with albuminuria and macrovascular Disease, Eur. J. Clin. Invest. 42 (2012) 470–477,https://doi.org/10.
1111/j.1365-2362.2011.02602.x.
[29] A. Tripodi, A. Branchi, V. Chantarangkul, M. Clerici, G. Merati, A. Artoni, P.M. Mannucci, Hypercoagulability in patients with type 2 diabetes mellitus de- tected by a thrombin generation assay, J. Thromb. Thrombolysis 31 (2011)
165–172,https://doi.org/10.1007/s11239-010-0506-0.
[30] H.K. Kim, J.E. Kim, S.H. Park, Y.I. Kim, I.S. Nam-Goong, E.S. Kim, High coagulation factor levels and low protein C levels contribute to enhanced thrombin generation in patients with diabetes who do not have macrovascular complications, J. Diabetes Complicat. 28 (2014) 365–369,https://doi.org/10.1016/j.jdiacomp.2014.01.006.
[31] J.B. Segal, A.R. Moliterno, Platelet counts differ by sex, ethnicity, and age in the United States, Ann. Epidemiol. 16 (2006) 123–130,https://doi.org/10.1016/j.
annepidem.2005.06.052.
[32] G. Biino, I. Santimone, C. Minelli, R. Sorice, B. Frongia, M. Traglia, S. Ulivi, A. Di Castelnuovo, M. Gögele, T. Nutile, M. Francavilla, C. Sala, N. Pirastu, C. Cerletti, L. Iacoviello, P. Gasparini, D. Toniolo, M. Ciullo, P. Pramstaller, M. Pirastu, G. de Gaetano, C.L. Balduini, Age- and sex-related variations in platelet count in italy: a proposal of reference ranges based on 40987 subjects' data, PLoS One 8 (2013) e54289,https://doi.org/10.1371/journal.pone.0054289.
[33] I. Aoki, K. Shimoyama, N. Aoki, M. Homori, A. Yanagisawa, K. Nakahara, Y. Kawai, S.I. Kitamura, K. Ishikawa, Platelet-dependent thrombin generation in patients with diabetes mellitus: effects of glycemic control on coagulability in diabetes, J. Am.
Coll. Cardiol. 27 (1996) 560–566.
[34] N.J. Mutch, L. Thomas, N.R. Moore, K.M. Lisiak, N.A. Booth, TAFIa, PAI-1 and (alpha)2-antiplasmin: complementary roles in regulating lysis of thrombi and plasma clots, J. Thromb. Haemost. 5 (2007) 812–817,https://doi.org/10.1111/j.
1538-7836.2007.02430.x.
[35] L.A. Robbie, N.A. Booth, A.M. Croll, B. Bennett, The roles of alpha 2-antiplasmin and plasminogen activator inhibitor 1 (PAI-1) in the inhibition of clot lysis, Thromb. Haemost. 70 (1993) 301–306http://www.ncbi.nlm.nih.gov/pubmed/
8236139.
[36] D.C. Rijken, S. Abdul, J.J. Malfliet, F.W. Leebeek, S. Uitte de Willige, Compaction of fibrin clots reveals the antifibrinolytic effect of factor XIII, J. Thromb. Haemost. 14 (2016) 1453–1461,https://doi.org/10.1111/jth.13354.