Differences Between Central
Venous and Cerebral Tissue Oxygen Saturation in Anaesthetised
Patients With Diabetes Mellitus
Roberta Sudy
1,2, Ferenc petak
2*, Almos Schranc
1,2, Szilvia Agocs
1, Ivett Blaskovics
1, Csaba Lengyel
3& Barna Babik
1The brain has high oxygen extraction, thus the regional cerebral tissue oxygen saturation (rSO2) is lower than the central venous oxygen saturation (ScvO2). We hypothesised that diabetes widens the physiological saturation gap between ScvO2 and rSO2 (gSO2), and the width of this gap may vary during various phases of cardiac surgery. Cardiac surgery patients with (n = 48) and without (n = 91) type 2 diabetes mellitus (T2DM) underwent either off-pump coronary artery bypass (OPCAB) or other cardiac surgery necessitating cardiopulmonary bypass (CPB) were enrolled. rSO2 was measured by near-infrared spectroscopy (NIRS) and ScvO2 was determined simultaneously from central venous blood. rSO2 was registered before and after anaesthesia induction and at different stages of the surgery. ScvO2 did not differ between the T2DM and control patients at any stage of surgery, whereas rSO2 was lower in T2DM patients, compared to the control group before anaesthesia induction (60.4 ± 8.1%[SD] vs. 67.2 ± 7.9%, p<0.05), and this difference was maintained throughout the surgery. After anaesthesia induction, the gSO2 was higher in diabetic patients undergoing CPB (20.2 ± 10.4% vs. 12.4 ± 8.6%, p < 0.05) and OPCAB grafting surgeries (17.0 ± 7.5% vs. 9.5 ± 7.8%, p < 0.05). While gSO2 increased at the beginning of CPB in T2DM and control patients, no significant intraoperative changes were observed during the OPCAB surgery. The wide gap between ScvO2 and rSO2 and their uncoupled relationship in patients with diabetes indicate that disturbances in the cortical oxygen saturation cannot be predicted from the global clinical parameter, the ScvO2. Thus, our findings advocate the monitoring value of NIRS in T2DM.
Since the increasing prevalence of type 2 diabetes mellitus (T2DM) overwhelms the decreasing rate of diabetes-related cardiovascular complication1,2, there is an increasing burden for health care providers1,3. Currently 30–40% of the patients undergoing cardiovascular surgery have T2DM4, which can partly be attributed to a therapeutic inertia in intensifying treatment of T2DM to reach optimal glycemic, lipid and blood pressure control5. In long-term T2DM, the high perioperative morbidity and mortality6,7 can be partly attributed to the development of characteristic pathophysiological changes in the cardiovascular system. The structural and func- tional abnormalities in the vasculature8 compromise adaptation mechanisms, subsequently increasing the risk of postoperative organ dysfunction including perioperative cerebral circulatory deficiency9,10. The reduced vasodi- latory reserve capacity increases the risk for a reduced cerebral tissue oxygen supply in T2DM patients, which may be responsible for the higher incidence of postoperative adverse neurocognitive dysfunction and stroke in the diabetic population11–14.
In the perioperative period, the oxygen balance is routinely estimated from the oxygen saturation of central venous blood (ScvO2)15. However, ScvO2 reflects the overall oxygen balance16. Since substantial heterogeneity exists in oxygen extraction of various organs17, the mixed venous oxygen saturation is not able to reflect regional changes in the tissue oxygenation. As the oxygen extraction rate of cerebral tissue is one of the highest in the body under physiological conditions17, ScvO2 bounds to overestimate cerebral tissue oxygen saturation18. Vascular dysfunction in T2DM may further impair the cerebral tissue oxygen balance19 and thus, the ability of ScvO2 to assess the intraoperative brain tissue oxygenation is particularly challenged in diabetic patients. Therefore, online
1Department of Anaesthesiology and Intensive Therapy, University of Szeged, Szeged, Hungary. 2Department of Medical Physics and Informatics, University of Szeged, Szeged, Hungary. 31st Department of Internal Medicine, Faculty of Medicine, University of Szeged, Szeged, Hungary. *email: petak.ferenc@med.u-szeged.hu
open
monitoring of regional cerebral tissue oxygen saturation (rSO2) would have an advantage in T2DM patients in the intraoperative period to manage local hypoxemic episodes. Accordingly, we hypothesise that T2DM patients exhibit a significant widening of the gap between ScvO2 and rSO2 (gSO2), and ScvO2 is not suitable to infer rSO2
as a cardiovascular consequence of diabetes.
To test this hypothesis, we aimed at comparing direct measurements of rSO2 using near-infrared spectroscopy (NIRS) to simultaneously obtained ScvO2 data in patients with and without T2DM. ScvO2, rSO2 and gSO2 are expected to exhibit intraoperative changes during cardiac surgery depending on the patient management with or without cardiopulmonary bypass (CPB). Thus, measurements were made during anaesthesia in two groups of cardiac surgery patients: those undergoing CPB and those scheduled for off-pump coronary artery bypass (OPCAB) grafting procedure.
Methods
Patients.
Hundred thirty-nine consecutive patients with T2DM (n = 48) and control (C) subjects without T2DM (n = 91) undergoing cardiac surgery were enrolled in this prospective descriptive cohort study. Patients were defined as having T2DM if their medical history included a diagnosis of T2DM and haemoglobin A1c (HbA1c) > 6.4%. All patients underwent either OPCAB (C-OPCAB, n = 31 and T2DM-OPCAB, n = 24) or CPB (C-CPB, n = 60, T2DM-CPB, n = 24). Patients older than 80 years of age or with poor ejection fraction (<40%), unilateral internal carotid stenosis (>75%), or medical history of smoking, chronic obstructive pulmo- nary disease or stroke were excluded from the study. The protocol was approved by the Human Research Ethics Committee of Szeged University, Hungary (no. WHO 2788), and the patients gave their informed consent to par- ticipation in the study. The study was performed in accordance with the ethical standards laid down in the 1964 Declaration of Helsinki and its later amendments between January and August 2017. This manuscript adheres to the applicable CONSORT guidelines, and the patient flow chart is depicted on Fig. 1.Anaesthesia.
One hour before the surgery, patients were premedicated with lorazepam (per os, 2.5 mg).Before induction of anaesthesia, the NIRS sensors (INVOS 3100, Somanetics, MI, USA) were positioned on both sides of the forehead. Sensors to detect depth of anaesthesia were also mounted on the forehead to monitor EMG and EEG activities. These signals were used to calculate response (RE) and state entropy (SE), respectively (GE Healthcare, Chicago, USA). Induction of anaesthesia was achieved by iv midazolam (30 μg/kg), sufentanil (0.4–0.5 μg/kg), and propofol (0.3–0.5 mg/kg), and iv propofol (50 mg/kg/min) was administered to maintain anaesthesia. Intravenous boluses of rocuronium (0.6 mg/kg for induction and 0.2 mg/kg every 30 minutes for maintenance) was administered iv to ensure neuromuscular blockade. A cuffed tracheal tube (internal diame- ter of 7, 8, or 9 mm) was used for tracheal intubation, and patients were mechanically ventilated (Dräger Zeus, Figure 1. Patient flow chart.
Lübeck, Germany) in volume-controlled mode with decelerating flow. A tidal volume of 7 ml/kg and a positive end-expiratory pressure of 4 cmH2O were applied, and the ventilation frequency was adjusted to 12–14 breaths/
min to maintain end-tidal CO2 partial pressure of 36-38 mmHg. Mechanical ventilation was performed with a fraction of inspired oxygen of 0.5 during the entire OPCAB procedure and before CPB, and it was increased to 0.8 after CPB. As a standard part of the cardiac anaesthesia procedure, oesophageal and rectal temperature probes were introduced, and a central venous line was inserted into the right jugular vein. The left radial artery was also cannulated to monitor systolic, diastolic and mean arterial (MAP) blood pressures and arterial blood gas samples.
The membrane oxygenator was primed with 1,500 ml lactated Ringer’s solution prior to CPB. Intravenous heparin (150 or 300 U/kg for OPCAB and CPB procedures, respectively) was injected into the patient, and an activated clotting time of 300 s was achieved during OPCAB and of 400 s during CPB procedures. During CPB, mild hypothermia was allowed, the mechanical ventilation was stopped, and the ventilator was disconnected without applying positive airway pressure. Before restoring ventilation, the lungs were inflated 3–5 times to a peak airway pressure of 30 cmH2O to facilitate lung recruitment. Normothermia was maintained in the OPCAB patients.
Measurement of cerebral-tissue oxygen saturation.
The spatially resolved continuous-wave NIRS technique was applied to estimate rSO2. This monitor uses two different wavelengths (730 and 810 nm) and has two detectors positioned 3 and 4 cm from the light source. Computing the differences between the intensity of the emitted and the reflected light20 with two receivers21 allows the measurement of the oxygen saturation of the cerebral cortex. In this study, two adult sensors were applied on the left and right sides of the patient’s forehead symmetrically, placed more than 3 cm from the superior rim of the orbit22.The cerebral-tissue oxygen saturation was monitored continuously during the surgical procedures and the data were registered in each protocol stage.The mean value of the rSO2 measured by the sensors was calculated for each protocol stage and used for further analyses.
Measurement of central venous oxygen saturation and arterial blood gas parameters.
The ScvO2 was measured from central venous blood samples (Radiometer ABL 505, Copenhagen, Denmark). The proper positioning of the central venous catheter was verified by the surgeon via manually palpating the catheter tip. The partial pressures of oxygen (PaO2) and carbon-dioxide (PaCO2), haemoglobin, pH and oxygen content (CaO2) were determined from arterial blood gas samples at each protocol stage.Measurement protocol.
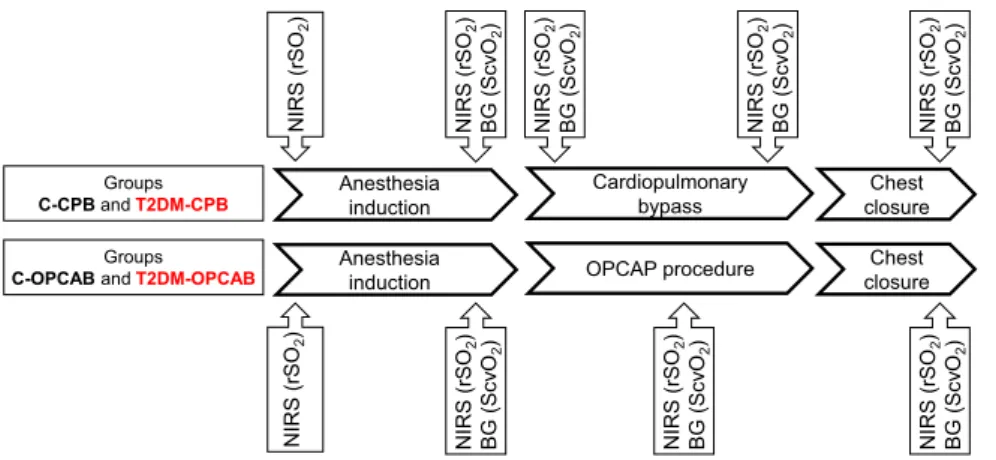
The scheme of the measurement protocol is outlined on Fig. 2. After securing arterial and peripheral venous lines and placement of NIRS and entropy sensors, data collection was initiated immediately before anaesthesia induction in all groups of patients. Since catheterization of the jugular vein was scheduled after anaesthesia induction, ScvO2 and gSO2 data were not available at the first protocol stage. After anaesthesia induction and muscle relaxation, all measurements were repeated before surgical incision. For the patients undergoing CPB procedures, the whole data set was registered at the beginning of CPB after clamping the aorta and 5 min before the end of CPB. For the patients undergoing OPCAB procedures, collection of the full set of data was performed during performance of the first proximal anastomosis between the aorta and saphe- nous vein graft. The final stage of the protocol was allocated to the end of the operation after sternal closure. All invasive (i.e. arterial and venous blood gas) and non-invasive data were registered simultaneously at each protocol stage after ensuring a 3 min steady-state condition.Statistical analyses.
For numerically reported data, the scatters in measured variables are expressed as 95% confidence interval for the mean. The normality of the data was verified with the Shapiro-Wilk test; one-wayAnesthesia
induction Cardiopulmonary
bypass Chest
closure Groups
C-CPBandT2DM-CPB
NIRS (rSO2) BG (ScvO2) NIRS (rSO2) BG (ScvO2)
NIRS (rSO2) NIRS (rSO2) BG (ScvO2) NIRS (rSO2) BG (ScvO2)
Groups
C-OPCABandT2DM-OPCAB Anesthesia
induction OPCAP procedure Chest
closure
NIRS (rSO2) NIRS (rSO2) BG (ScvO2) NIRS (rSO2) BG (ScvO2) NIRS (rSO2) BG (ScvO2)
Figure 2. The scheme of the measurement protocol. Measurements were made at five time points in the patients with cardiac surgeries requiring cardiopulmonary bypass (Groups C-CPB and T2DM-CPB), while four measurements were performed in the patients with off-pump coronary bypass grafting surgeries (C-OPCAB and T2DM-OPCAB). Cerebral tissue oxygen saturation (rSO2) measured by near infrared spectroscopy (NIRS).
Central venous oxygen saturation (ScvO2) determined from blood gas analyses (BG).
analysis of variance (ANOVA) was used to test differences in the demographic, anthropometric, and clinical char- acteristics of the patients when they were included in the control, and diabetic groups. Fisher’s exact test was per- formed to assess the differences in the surgical procedures between the protocol groups. Pearson’s correlation test was applied to assess the relationship between global and regional oxygen saturation indices. Two-way repeated measures ANOVA with the inclusion of an interaction term was used for all measured variables with the protocol stage as within-subject factor (protocol stages) and group allocation as between-subject factor to establish the effects of T2DM and the surgical procedure on the oxygen saturation indices. The Holm–Sidak multiple com- parison procedure was adopted to compare the variables in the study groups at different protocol stages. Further two-way repeated measures ANOVA tests were applied to assess between-group and within-group differences in the parameters influencing cerebral-tissue oxygen saturation. Sample sizes were estimated to enable the detection of a 10% difference in the primary outcome parameter gSO2 that we considered clinically significant. Accordingly, sample-size estimation based on an ANOVA test with four groups of patients indicated that 24 patients were required in each group to detect a significant difference between the protocol groups (the assumed variability of 10%, power of 80% and the significance level of 5%). Due to the prevalence of T2DM in cardiac surgery, this targeted number of T2DM patients resulted in twofold number of the patients without diabetes. The statistical tests were performed with the SigmaPlot statistical software package (Version 13, Systat Software, Inc., Chicago, IL, USA) and R environment. All reported p values are two-sided.
Ethics approval and consent to participate.
The protocol was approved by the Human Research Ethics Committee of Szeged University, Hungary (no. WHO 2788), and the patients gave their informed consent to par- ticipation in the study. The study was performed in accordance with the ethical standards laid down in the 1964 Declaration of Helsinki and its later amendments.Results
Patient characteristics.
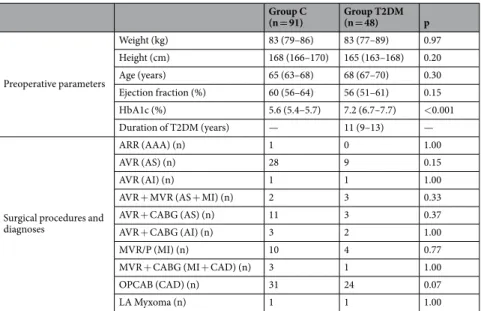
Table 1 summarises the demographic, anthropometric and clinical characteristics and surgical procedures of the patients with and without T2DM. HbA1c was significantly higher in diabetic patients while there was no significant difference in the other parameters (i.e. weight, height, age or ejection fraction).Serum glucose level, rSO2 and parameters determining tissue oxygen balance obtained before anaesthesia induction are demonstrated on Table 2. The serum glucose level was higher and the rSO2 values were lower in the T2DM patients as compared to the control patients. Evidence for a difference in parameters determining the oxygen supply was only observed in haemoglobin concentration and CaO2. Response entropy, state entropy and oesophageal temperature did not differ between the protocol groups.
Effects of T2DM on central venous and cerebral oxygen saturation during CPB and OPCAB pro- cedures.
Oxygen saturation in central venous blood (ScvO2), in cerebral tissue (rSO2) and their difference expressed as a saturation gap (gSO2), are presented in Fig. 3 for the patients underwent cardiac surgery with (top) or without (bottom) CPB. No significant difference was observed in ScvO2 between patients with and without T2DM at any protocol stage. Conversely, rSO2 was significantly lower in the T2DM-CPB and T2DM-OPCAB groups than in the corresponding controls (p < 0.001 for both), and this difference endured in all phases of theGroup C
(n = 91) Group T2DM
(n = 48) p
Preoperative parameters
Weight (kg) 83 (79–86) 83 (77–89) 0.97
Height (cm) 168 (166–170) 165 (163–168) 0.20
Age (years) 65 (63–68) 68 (67–70) 0.30
Ejection fraction (%) 60 (56–64) 56 (51–61) 0.15
HbA1c (%) 5.6 (5.4–5.7) 7.2 (6.7–7.7) <0.001
Duration of T2DM (years) — 11 (9–13) —
Surgical procedures and diagnoses
ARR (AAA) (n) 1 0 1.00
AVR (AS) (n) 28 9 0.15
AVR (AI) (n) 1 1 1.00
AVR + MVR (AS + MI) (n) 2 3 0.33
AVR + CABG (AS) (n) 11 3 0.37
AVR + CABG (AI) (n) 3 2 1.00
MVR/P (MI) (n) 10 4 0.77
MVR + CABG (MI + CAD) (n) 3 1 1.00
OPCAB (CAD) (n) 31 24 0.07
LA Myxoma (n) 1 1 1.00
Table 1. Patient characteristics, surgical procedures and diagnoses (in parentheses). HbA1c: Hemoglobin-A1c, ARR: aortic root replacement, AAA: aortic arch reconstruction; AVR: aortic valve replacement to repair aortic stenosis (AS) or aortic insufficiency (AI); MVR/P: mitral valve replacement/plasty; CABG: coronary artery bypass grafting; MI: mitral insufficiency; LA: left atrium, CAD: coronary artery disease. Data for preoperative parameters are shown as mean and 95% confidence interval for the mean; data for surgical procedures and diagnoses are represented as number of patients.
surgery. This result was reflected in significant differences in gSO2 between patients with and without T2DM in the CPB and OPCAB patients (p < 0.001 for both). During the surgical procedure, prominent and signifi- cant increases in ScvO2 (p < 0.001) with smaller but statistically significant decreases in rSO2 (p < 0.05) were observed at the beginning of CPB, resulting in marked elevations in gSO2 (p < 0.001). In both CPB groups, the ScvO2 and gSO2 reversed by the end of CPB, and these parameters decreased below their initial levels in C-CPB patients (p < 0.005). No significant intraoperative changes were observed in the oxygen saturation parameters in the OPCAB patients.
Effects of T2DM on clinical parameters affecting cerebral oxygen supply and demand.
Main clinical parameters characterizing tissue oxygen balance obtained at different stages of the protocol are summa- rised in Figs. 1S–4S in the Supplemental Digital Content. Between-group differences were observed only in the CaO2 before the surgical procedure (Fig. 1S, p < 0.05) in the blood glucose levels throughout the surgery (Fig. 4S, p < 0.05) and in the arterial oxygen saturation rSO2 differences (Fig. 2S, p < 0.05). Considerable within-group intraoperative changes were observed primarily during the CPB procedure. The onset of CPB was associated with small but significant decreases in core body temperature in both T2DM-CPB and C-CPB patients (Fig. 3S, p < 0.05), which subsequently returned to the initial value by the end of the surgery. Furthermore, MAP and CaO2 decreased significantly in both groups of patients when CPB was established (Fig. 1S, p < 0.05), and returned to their initial values following chest closure. RE and SE decreased significantly after anaesthesia induction in all groups of patients with no difference between patients with and without T2DM (Fig. 3S).Relationship between central venous and cerebral oxygen saturation: effects of T2DM.
The relationship between central venous and cerebral oxygen saturation obtained after anaesthesia induction prior to the surgery for control and T2DM patients is illustrated in Fig. 4. Significant correlation was observed between ScvO2 and rSO2 in the control group (r = 0.52, p < 0.0001). In contrast, no significant correlation was found between these global and regional oxygen saturation parameters in patients with T2DM (r = 0.13, p = 0.34).Discussion
Significant reduction of brain tissue oxygen saturation was obtained in the present study in T2DM patients. Since this finding was not reflected in the central venous oxygen saturation, the gap between ScvO2 and rSO2 widened significantly and the relationship between these two values became uncoupled in patients with diabetes. In the T2DM patient, the oxygen saturation gap remained elevated throughout the cardiac surgery procedure.
The lower initial rSO2 (Fig. 3B,E) and the associated widening of gSO2 (Fig. 3C,F) in patients with T2DM cannot be attributed to differences in demographic, anthropometric and clinical characteristics between the two groups (Tables 1 and 2). In both groups of patients, the oxygen demand of the cerebral cortex was expected to be in a uniformly low range throughout the surgery, as suggested by the therapeutic entropy levels (Fig. 3S). The glu- cose levels differed between normal and diabetic patients (Table 2 and Fig. 4S), which may affect the light scatter- ing in the near infrared wavelength range23. However, this effect was negligible at the applied wavelength24 or was markedly smaller (<1.5%) that the differences obtained between the study groups23. Therefore, this phenomenon may have had a minor contribution to our findings, but cannot fully explain the differences in rSO2 between the diabetic and control groups. The presence of anaemia and lower CaO2 in the T2DM patients (Table 2) may con- tribute to the differences in rSO2 between control and diabetic patients. However, ScvO2 did not differ between the protocol groups (Fig. 3), suggesting sufficient oxygen supply in all patients under general anaesthesia with muscle relaxation when the oxygen demand of the paralyzed skeletal muscle decreases markedly. Accordingly, the diminished overall oxygen extraction can be supplied both in patients with normal or compromised micro- circulation (such as T2DM). Moreover, the widened gap in diabetic patients remains after CPB despite the lack of difference in CaO2 and MAP between diabetic and non-diabetic patients. Most probably, the compromised
Group C (n = 91) Group T2DM (n = 48) p
Glucose (mmol/L) 5.9 (5.7–6.0) 8.04 (7.2–8.9) <0.001
rSO2 (%) 68 (66–69) 60 (58–63) <0.001
MAP (mmHg) 88 (86–90) 86 (83–90) 0.29
CaO2 (ml/dl) 17.0 (16.4–17.5) 16.0 (15.2–16.7) 0.034
Hemoglobin (g/dl) 13.0 (12.7–13.5) 12.4 (11.9–13) 0.043
PaO2 (mmHg) 77.09 (71.70–82.48) 72.29 (69.11–75.46) 0.13
pHa 7.412 (7.408–7.417) 7.408 (7.396–7.420) 0.86
PaCO2 (mmHg) 38.27 (37.27–39.26) 37.88 (36.46–39.31) 0.66
RE 90 (83–96) 92 (86–97) 0.394
SE 86 (79–92) 91 (84–97) 0.33
Te (°C) 36.5 (36.2–36.7) 36.7 (36.2–37.0) 0.6
CPB duration (min) 83 (74–92) 89 (69–109) 0.625
Table 2. Intraoperative parameters before anaesthesia induction. The serum glucose level and initial cerebral tissue oxygen saturation (rSO2) with parameters determining tissue oxygen balance. MAP: mean arterial pressure; CaO2: arterial oxygen content; PaO2: arterial partial pressure of oxygen; PaCO2: arterial partial pressure of CO2; RE: response entropy; SE: state entropy, Te: esophageal temperature, CPB: cardiopulmonary bypass. Data are shown as mean and 95% confidence interval for the mean.
rSO2 can rather be explained by the adverse cerebrovascular consequences of T2DM. The pathologic metabolic milieu is characterised by hyperglycaemia, insulin resistance and elevated level of free fatty acids25. Blockade of the vasodilatory insulin signalling pathway diminishes endothelial nitric oxide (NO) synthesis26. Endothelial NO production is further compromised by the advanced glycation end-products26 and by the increased inactivation of NO by oxidative stress26. The reduced NO-mediated endothelium-dependent vasodilation increases the vas- cular tone. The elevated arterial tone and/or vascular remodelling facilitated by these mechanisms are associated with low-grade inflammatory, prothrombotic proliferative processes, resulting in atherosclerotic plaque forma- tion27. All these mechanisms converge to an impaired microcirculation28, which may be reflected in impaired cerebral-tissue oxygen saturation.
The few previous results available for anaesthetised patients measured before surgical intervention revealed somewhat lower cerebral oxygen saturation in diabetic than non-diabetic patients18,29,30, or failed to demonstrate an effect of diabetes on this outcome31. The discrepancies between these earlier results and the current find- ing may be attributed to the relatively small number of patients involved in the previous studies. Considering the substantial inter-individual variability in our rSO2 data obtained in diabetic patients (Fig. 3), the statistical power may not have been robust enough to reach a conclusion with confidence in the previous studies. All these previous studies applied jugular venous bulb oximetry to assess cerebral oxygen saturation, which reflects the oxygen status of the entire brain, whereas NIRS utilised in the present study focuses on the cortex. Since both the blood flow and oxygen demand is higher in the cortex than in the white matter17, microvascular dysfunction and remodelling may be more apparent in the cortical region. The sole previous study where NIRS data were reported for a diabetic subpopulation was part of a preoperative assessment without evaluating changes in the intraopera- tive period32. In this study, diabetes was associated with lower baseline rSO2 in vascular surgery patients; however, patients undergoing cardiac surgery procedures exhibited no difference preoperatively. Nevertheless, the high ratio of smokers and inclusion of aged patients in this previous study may have blunted the distinct effects of diabetes on the measured outcomes.
Remarkable intraoperative changes were observed in ScvO2, rSO2 and gSO2 at the beginning of CPB (Fig. 3, top panel). The increases in ScvO2 can be attributed to a decreased core temperature (Fig. 3S) and subsequent
Before Ind After Ind OPCAB Closure
gSO2 (%)
0 10 20 30 40
Before Ind After Ind Start CPB End CPB Closure
ScvO2 (%)
0 50 60 70 80 90
Before Ind After Ind Start CPB End CPB Closure
rSO2 (%)
0 50 60 70 80 90
C-CPB T2DM-CPB
Before Ind After Ind Start CPB End CPB Closure
gSO2 (%)
0 10 20 30 40
Before Ind After Ind OPCAB Closure
rSO2 (%)
0 50 60 70 80 90
* * *
* * *
*
Before Ind After Ind OPCAB Closure
ScvO2 (%)
0 50 60 70 80 90
C-OPCAB T2DM-OPCAB
* * * * * *
*
* *
#
#
#
$
$
$ $
# $
#
$
#
#
$
$
A
$§B C
F E
D
Figure 3. The central venous oxygen saturation (ScvO2, panels A,D), the cerebral oxygen saturation (rSO2, panels B,E) and the differences between these indices (gSO2, panels C,F) according to the protocol stages in patients with (red symbols) and without T2DM (black symbols) who underwent CPB (top panels) or OPCAB procedures (bottom panels). Error bars represent the following: SD. *p < 0.001 between the protocol groups within a stage, #p < 0.05 vs. stage “After Ind.”, $p < 0.05 vs. condition “Start CPB”, §p < 0.05 vs. condition “End CPB” within a group.
decrease in the systemic oxygen demand33. The concomitant slight, but significant, decrease in rSO2 in the dia- betic patients should be interpreted in terms of a decreased MAP and haemoglobin concentration associated with an elevation in arterial pH (Fig. 1S)34. The opposite changes in ScvO2 and rSO2 after the onset of CPB are reflected in the striking elevations in gSO2 (Fig. 3C). It is of note that in diabetic patients the gSO2 may rise to a value threefold greater than physiologically normal (i.e. from around 10 to around 30%, Fig. 3C). The compromised rSO2 observed in the present study may be responsible for the increases in postoperative adverse neurocognitive outcomes and stroke in T2DM patients11–14. In contrast with the CPB patients, no intraoperative changes in oxy- gen saturation indices were detected in the patients with OPCAB procedures (Fig. 3, bottom panel). This more stable pattern of cerebral-tissue oxygen saturation may explain the lower incidence of postoperative stroke13,35 and cognitive dysfunction36 after cardiac surgery with OPCAB.
The brain has high oxygen demand as well as low hypoxic tolerance and the regulation of cerebrovascular circulation is correspondingly complex37. Therefore, the oxygen saturation of this organ can distinctly differ from the rest of the systemic circulation. NIRS offers a simple, non-invasive, real-time monitoring tool to quantify the oxygen status of brain tissue. Hence, this technique has a great potential to reveal disturbances in the regional oxygen saturation promptly, with a particular advantage of assessing cerebral tissue oxygen saturation in the perioperative period. In non-diabetic patients, there is a significant difference between global and cerebral-tissue oxygen saturations, although they exhibit significant correlations (Fig. 4). Nevertheless, there is a scatter in this relationship due to recognized interindividual variability even in the control patients38,39. The scatter in the rSO2 data can be attributed to the relatively large age range (67.1 ± 12.2 for the whole population) and to the involve- ment of patients with wide variety of heart diseases to our cohort. Nevertheless, the associations between these regional and global oxygenation indices suggest the possibility to predict of the brain oxygen status from the ScvO2 value when the cerebral circulation is intact. Conversely, our results also demonstrate that in addition to the gap between ScvO2 and rSO2, these parameters became uncoupled in diabetic patients (Fig. 4). The lack of a clear relationship between these indices impedes the assessment of cerebral-oxygen saturation from ScvO2 in the T2DM population. Accordingly, our findings demonstrate the particular monitoring value of NIRS in the pres- ence of a disease affecting cerebral microcirculation. These considerations may contribute to the clarification of the monitoring value of NIRS in a critically ill population, which is currently under debate40–43.
A methodological aspect of the study is related to the general limitations of the NIRS in the accurate assess- ment of cerebral oxygenation, such as lack of established baseline values, possible contamination by scalp tissue, localised reading and the assumption of fixed arterial-venous blood ratio of the tissue40,44. The INVOS is consid- ered as a trend monitor. However, several studies based their conclusions on absolute values of the rSO245,46. In our study, involvement of high number of patients enabled to detect statistically significant differences between the protocol groups with high statistical power, confirming the validity of our conclusions. Another methodo- logical aspect concerns the interindividual variability in the cardiac surgery patients. However, the groups of the patients with and without T2DM did not differ in anthropometric parameters, diagnoses or surgical procedures, and the comorbidities with potential biasing effect on cerebral circulation were excluded. This study focused on the intraoperative changes of tissue oxygenation, further studies are required to follow-up potential differences in the clinical outcomes (e.g. stroke or neurocognitive dysfunction) between normal and T2DM patients.
ScvO2 (%)
40 50 60 70 80 90 100
rSO2 (%)
40 50 60 70 80 90 100
Control
T2DMLinear regression in the control group Linear regression in the T2DM group Line of identity
Figure 4. Correlation between cerebral oxygen saturation (rSO2) and central venous oxygen saturation (ScvO2) after the induction of anaesthesia in each patient. Linear regression in the T2DM group (p = 0.34, r = 0.13), Linear regression in the control group (p < 0.0001, r = 0.52).
Conclusions
In conclusion, the present study demonstrated that diabetes mellitus worsens the oxygen saturation of the cerebral tissue and uncouples indices reflecting regional cortical and global central venous oxygenation. Consequently, disturbances in the cortical oxygen saturation in diabetic patients become unpredictable from the well-established global clinical parameter of central venous oxygen saturation. Thus, diabetic patients may benefit from the con- tinuous intraoperative measurement of regional brain-tissue oxygen saturation to optimise tissue oxygenation with adjusting cerebral perfusion pressure, arterial oxygen content and/or avoiding alkalosis. Our findings may also contribute to the identification of patient populations with abnormal microcirculation when NIRS has par- ticular monitoring value for detecting cerebrovascular adverse consequences.
Data availability
The datasets analysed during the current study are available from the corresponding author on a reasonable request.
Received: 14 May 2019; Accepted: 28 November 2019;
Published: xx xx xxxx
References
1. Gregg, E. W. et al. Changes in diabetes-related complications in the United States, 1990–2010. N Engl J Med 370, 1514–1523, https://
doi.org/10.1056/NEJMoa1310799 (2014).
2. Rawshani, A. et al. Mortality and Cardiovascular Disease in Type 1 and Type 2 Diabetes. N Engl J Med 376, 1407–1418, https://doi.
org/10.1056/NEJMoa1608664 (2017).
3. Collaboration, N. C. D. R. F. Worldwide trends in diabetes since 1980: a pooled analysis of 751 population-based studies with 4.4 million participants. Lancet 387, 1513–1530, https://doi.org/10.1016/S0140-6736(16)00618-8 (2016).
4. Raza, S., Blackstone, E. H. & Sabik, J. F. III. The diabetes epidemic and its effect on cardiac surgery practice. The Journal of thoracic and cardiovascular surgery 150, 783–784, https://doi.org/10.1016/j.jtcvs.2015.07.037 (2015).
5. Khunti, K., Wolden, M. L., Thorsted, B. L., Andersen, M. & Davies, M. J. Clinical inertia in people with type 2 diabetes: a retrospective cohort study of more than 80,000 people. Diabetes care 36, 3411–3417, https://doi.org/10.2337/dc13-0331 (2013).
6. Engelen, S. E. et al. Incidence of cardiovascular events and vascular interventions in patients with type 2 diabetes. Int J Cardiol 248, 301–307, https://doi.org/10.1016/j.ijcard.2017.07.081 (2017).
7. Kogan, A. et al. Impact of type 2 diabetes mellitus on short- and long-term mortality after coronary artery bypass surgery. Cardiovasc Diabetol 17, https://doi.org/10.1186/S12933-018-0796-7 (2018).
8. Feener, E. P. & King, G. L. Vascular dysfunction in diabetes mellitus. Lancet 350(Suppl 1), SI9–13 (1997).
9. Morricone, L. et al. Diabetes and complications after cardiac surgery: comparison with a non-diabetic population. Acta Diabetol 36, 77–84 (1999).
10. Fulesdi, B. et al. Cerebrovascular reactivity and reserve capacity in type II diabetes mellitus. J Diabetes Complications 13, 191–199 (1999).
11. Perez-Belmonte, L. M. et al. Assessment of long-term cognitive impairment after off-pump coronary-artery bypass grafting and related risk factors. J Am Med Dir Assoc 16, 263 e269–211, https://doi.org/10.1016/j.jamda.2014.12.001 (2015).
12. Notzold, A., Michel, K., Khattab, A. A., Sievers, H. H. & Huppe, M. Diabetes mellitus increases adverse neurocognitive outcome after coronary artery bypass grafting surgery. Thorac Cardiovasc Surg 54, 307–312, https://doi.org/10.1055/s-2006-924089 (2006).
13. Bucerius, J. et al. Stroke after cardiac surgery: a risk factor analysis of 16,184 consecutive adult patients. Ann Thorac Surg 75, 472–478 (2003).
14. Kadoi, Y. & Goto, F. Factors associated with postoperative cognitive dysfunction in patients undergoing cardiac surgery. Surg Today 36, 1053–1057, https://doi.org/10.1007/s00595-006-3316-4 (2006).
15. Walley, K. R. Use of central venous oxygen saturation to guide therapy. American journal of respiratory and critical care medicine 184, 514–520, https://doi.org/10.1164/rccm.201010-1584CI (2011).
16. Dueck, M. H., Klimek, M., Appenrodt, S., Weigand, C. & Boerner, U. Trends but not individual values of central venous oxygen saturation agree with mixed venous oxygen saturation during varying hemodynamic conditions. Anesthesiology 103, 249–257 (2005).
17. Barret, K., Barman, S., Boitano, S. & Brooks, H. In Ganong’s Review of Medical Physiology Ch. Circulation Through Special Regions, 569–585 (McGraw-Hill Companies, Inc, 2010).
18. Kadoi, Y. et al. Jugular venous bulb oxygen saturation in patients with preexisting diabetes mellitus or stroke during normothermic cardiopulmonary bypass. Anesthesiology 92, 1324–1329 (2000).
19. Hill, M. D. Stroke and diabetes mellitus. Handb Clin Neurol 126, 167–174, https://doi.org/10.1016/B978-0-444-53480-4.00012-6 (2014).
20. Scholkmann, F. et al. A review on continuous wave functional near-infrared spectroscopy and imaging instrumentation and methodology. Neuroimage 85(Pt 1), 6–27, https://doi.org/10.1016/j.neuroimage.2013.05.004 (2014).
21. Owen-Reece, H., Smith, M., Elwell, C. E. & Goldstone, J. C. Near infrared spectroscopy. Br J Anaesth 82, 418–426 (1999).
22. Gregory, A. J., Hatem, M. A., Yee, K. & Grocott, H. P. Optimal Placement of Cerebral Oximeter Monitors to Avoid the Frontal Sinus as Determined by Computed Tomography. J Cardiothorac Vasc Anesth 30, 127–133, https://doi.org/10.1053/j.jvca.2015.07.004 (2016).
23. Maier, J. S., Walker, S. A., Fantini, S., Franceschini, M. A. & Gratton, E. Possible correlation between blood glucose concentration and the reduced scattering coefficient of tissues in the near infrared. Opt Lett 19, 2062–2064, https://doi.org/10.1364/ol.19.002062 (1994).
24. Golic, M., Walsh, K. & Lawson, P. Short-wavelength near-infrared spectra of sucrose, glucose, and fructose with respect to sugar concentration and temperature. Appl Spectrosc 57, 139–145, https://doi.org/10.1366/000370203321535033 (2003).
25. Rask-Madsen, C. & King, G. L. Vascular complications of diabetes: mechanisms of injury and protective factors. Cell Metab 17, 20–33, https://doi.org/10.1016/j.cmet.2012.11.012 (2013).
26. Sena, C. M., Pereira, A. M. & Seica, R. Endothelial dysfunction - a major mediator of diabetic vascular disease. Biochim Biophys Acta 1832, 2216–2231, https://doi.org/10.1016/j.bbadis.2013.08.006 (2013).
27. Westein, E., Hoefer, T. & Calkin, A. C. Thrombosis in diabetes: a shear flow effect? Clin Sci (Lond) 131, 1245–1260, https://doi.
org/10.1042/CS20160391 (2017).
28. Brownlee, M. The pathobiology of diabetic complications: a unifying mechanism. Diabetes 54, 1615–1625 (2005).
29. Miyoshi, S., Morita, T., Kadoi, Y. & Goto, F. Analysis of the factors related to a decrease in jugular venous oxygen saturation in patients with diabetes mellitus during normothermic cardiopulmonary bypass. Surg Today 35, 530–534, https://doi.org/10.1007/
s00595-004-2977-0 (2005).
30. Kadoi, Y. et al. Time course of changes in jugular venous oxygen saturation during hypothermic or normothermic cardiopulmonary bypass in patients with diabetes mellitus. Acta Anaesthesiol Scand 45, 858–862 (2001).
31. Oh, Y. J. et al. Diabetes mellitus does not affect jugular bulb oxygen saturation in patients undergoing off-pump coronary artery bypass graft surgery. Circ J 72, 1259–1264 (2008).
32. Baikoussis, N. G., Karanikolas, M., Siminelakis, S., Matsagas, M. & Papadopoulos, G. Baseline cerebral oximetry values in cardiac and vascular surgery patients: a prospective observational study. J Cardiothorac Surg 5, 41, https://doi.org/10.1186/1749-8090-5-41 (2010).
33. Drury, P. P. et al. Deep hypothermic circulatory arrest during the arterial switch operation is associated with reduction in cerebral oxygen extraction but no increase in white matter injury. The Journal of thoracic and cardiovascular surgery 146, 1327–1333, https://
doi.org/10.1016/j.jtcvs.2013.02.011 (2013).
34. Ono, M. et al. Duration and magnitude of blood pressure below cerebral autoregulation threshold during cardiopulmonary bypass is associated with major morbidity and operative mortality. The Journal of thoracic and cardiovascular surgery 147, 483–489, https://
doi.org/10.1016/j.jtcvs.2013.07.069 (2014).
35. Kowalewski, M. et al. Off-pump coronary artery bypass grafting improves short-term outcomes in high-risk patients compared with on-pump coronary artery bypass grafting: Meta-analysis. The Journal of thoracic and cardiovascular surgery 151, 60–77 e61-58, https://doi.org/10.1016/j.jtcvs.2015.08.042 (2016).
36. Sun, J. H., Wu, X. Y., Wang, W. J. & Jin, L. L. Cognitive dysfunction after off-pump versus on-pump coronary artery bypass surgery:
a meta-analysis. J Int Med Res 40, 852–858, https://doi.org/10.1177/147323001204000303 (2012).
37. Willie, C. K., Tzeng, Y. C., Fisher, J. A. & Ainslie, P. N. Integrative regulation of human brain blood flow. J Physiol 592, 841–859, https://doi.org/10.1113/jphysiol.2013.268953 (2014).
38. Bickler, P. E., Feiner, J. R. & Rollins, M. D. Factors affecting the performance of 5 cerebral oximeters during hypoxia in healthy volunteers. Anesth Analg 117, 813–823, https://doi.org/10.1213/ANE.0b013e318297d763 (2013).
39. Moerman, A. & Wouters, P. Near-infrared spectroscopy (NIRS) monitoring in contemporary anesthesia and critical care. Acta anaesthesiologica Belgica 61, 185–194 (2010).
40. Bevan, P. J. Should Cerebral Near-infrared Spectroscopy be Standard of Care in Adult Cardiac Surgery? Heart Lung Circ 24, 544–550, https://doi.org/10.1016/j.hlc.2015.01.011 (2015).
41. Green, M. S., Sehgal, S. & Tariq, R. Near-Infrared Spectroscopy: The New Must Have Tool in the Intensive Care Unit? Semin Cardiothorac Vasc Anesth 20, 213–224, https://doi.org/10.1177/1089253216644346 (2016).
42. Rescoe, E. et al. Cerebral near-infrared spectroscopy insensitively detects low cerebral venous oxygen saturations after stage 1 palliation. The Journal of thoracic and cardiovascular surgery 154, 1056–1062, https://doi.org/10.1016/j.jtcvs.2017.03.154 (2017).
43. Simons, J., Sood, E. D., Derby, C. D. & Pizarro, C. Predictive value of near-infrared spectroscopy on neurodevelopmental outcome after surgery for congenital heart disease in infancy. The Journal of thoracic and cardiovascular surgery 143, 118–125, https://doi.
org/10.1016/j.jtcvs.2011.09.007 (2012).
44. Chan, M. J., Chung, T., Glassford, N. J. & Bellomo, R. Near-Infrared Spectroscopy in Adult Cardiac Surgery Patients: A Systematic Review and Meta-Analysis. Journal of cardiothoracic and vascular anesthesia 31, 1155–1165, https://doi.org/10.1053/j.
jvca.2017.02.187 (2017).
45. Rogers, C. A. et al. Randomized trial of near-infrared spectroscopy for personalized optimization of cerebral tissue oxygenation during cardiac surgery. Br J Anaesth 119, 384–393, https://doi.org/10.1093/bja/aex182 (2017).
46. Conway, B. A., Hultborn, H. & Kiehn, O. Proprioceptive input resets central locomotor rhythm in the spinal cat. Exp Brain Res 68, 643–656, https://doi.org/10.1007/bf00249807 (1987).
Acknowledgements
The authors thank the staff of the Cardiac Surgery Unit, Second Department of Internal Medicine and Cardiological Center, University of Szeged, Szeged, Hungary for their assistance in the data collection. This research was supported by Grant GINOP-2.3.2-15-2016-00006 and a Hungarian Basic Research Council Grant (OTKA-NKFIH K115253).
Author contributions
R. S.: acquisition, analysis and interpretation of data, writing up the paper; F.P.: study design, data analysis and writing up the paper; A. S.: acquisition, analysis, interpretation of data; Sz.A.: patient recruitment, acquisition, interpretation of data; I.B.: patient recruitment, acquisition, interpretation of data; Cs.L.: interpretation of data, and writing up the paper; B.B.: Patient recruitment, analysis and interpretation of data, and writing up the paper.
All authors read and approved the final manuscript.
Competing interests
The authors declare no competing interests.
Additional information
Supplementary information is available for this paper at https://doi.org/10.1038/s41598-019-56221-4.
Correspondence and requests for materials should be addressed to F.P.
Reprints and permissions information is available at www.nature.com/reprints.
Publisher’s note Springer Nature remains neutral with regard to jurisdictional claims in published maps and institutional affiliations.
Open Access This article is licensed under a Creative Commons Attribution 4.0 International License, which permits use, sharing, adaptation, distribution and reproduction in any medium or format, as long as you give appropriate credit to the original author(s) and the source, provide a link to the Cre- ative Commons license, and indicate if changes were made. The images or other third party material in this article are included in the article’s Creative Commons license, unless indicated otherwise in a credit line to the material. If material is not included in the article’s Creative Commons license and your intended use is not per- mitted by statutory regulation or exceeds the permitted use, you will need to obtain permission directly from the copyright holder. To view a copy of this license, visit http://creativecommons.org/licenses/by/4.0/.
© The Author(s) 2019