24-hour near-infrared spectroscopy monitoring of acute ischaemic stroke patients undergoing thrombolysis or thrombectomy: a pilot study
Ádám Annus MD1, András Nagy MD2, László Vécsei MD, PhD, DSc 1,3, Péter Klivényi MD, PhD, DSc 1
Affiliations:
1 Department of Neurology, Albert Szent-Györgyi Clinical Center, University of Szeged, H- 6725 Szeged, Semmelweis u. 6, Hungary
2Department of Radiology, Albert Szent-Györgyi Clinical Center, University of Szeged, H- 6725 Szeged, Semmelweis u. 6, Hungary
3 MTA-SZTE Neuroscience Research Group, H-6725 Szeged, Semmelweis u. 6, Hungary E-mail: annus.adam@med.u-szeged.hu, andras.nagy@med.u-szeged.hu,
vecsei.laszlo@med.u-szeged.hu, klivenyi.peter@med.u-szeged.hu
Shortened title: NIRS monitoring in acute ischaemic stroke.
Grant support: project GINOP (2.3.2-15- 2016-00048.).
Corresponding author:
Péter Klivényi MD, PhD, DSc
Department of Neurology, Faculty of Medicine, University of Szeged, Semmelweis u. 6,
H-6725 Szeged, Hungary
Tel:+36 62 545351 Fax:+36 62 545597
E-mail: klivenyi.peter@med.u-szeged.hu
Abstract Introduction
Monitoring of acute ischaemic stroke patients during thrombolysis or thrombectomy is based mostly on frequent physical examinations, since no objective measurement of cerebrovascular haemodynamics is available in routine clinical practice. Near-infrared spectroscopy (NIRS) is a bed-side, non-invasive assessment tool that could help monitor these patients and potentially guide therapeutic interventions. Our goal in this pilot study was to investigate whether NIRS is a suitable method to monitor leptomeningeal collateral circulation via changes in cortical oxygen saturation in the first 24 hours of acute ischaemic stroke.
Patients and methods
Our study included 5 patients with acute anterior circulation infarcts. All patients received thrombolytic therapy and one had thrombectomy. 24-hour continuous NIRS monitoring was performed on all participants.
Results
We aimed to give a detailed description of each NIRS recording and explain how the observed findings could correlate with changes in anterior watershed territory collateral circulation and clinical outcome.
Conclusion
Our pilot study supports the use of NIRS monitoring in acute ischaemic stroke. We believe that this technique could provide real-time information on the dynamic changes of
leptomeningeal collateral circulation and help monitor the effects of thrombolysis and thrombectomy.
Keywords: near-infrared spectroscopy (NIRS), ischaemic stroke, thrombolysis, collateral circulation.
1. Introduction
Intravenous administration of recombinant tissue plasminogen activator (rt-PA) is the treatment of choice in eligible acute ischaemic stroke patients who arrive to the hospital within the therapeutic time window (1). If large vessel occlusion is present, mechanical thrombectomy should be performed as well. Monitoring of patients during these procedures is based mostly on frequent physical examinations. For the time being, no objective
measurement of the patients’ cerebrovascular haemodynamics is used in routine clinical practice. Near-infrared spectroscopy (NIRS) is a bed-side, non-invasive, continuous, real time assessment tool which could help monitor patients with acute ischaemic stroke. It is most commonly used during cardiac surgery and carotid endarterectomy to detect and prevent cortical desaturations which might lead to permanent neurological sequelae (2). To our knowledge, only a few observational and pilot studies have been published that investigated the potential of NIRS monitoring during acute ischaemic stroke (3-6).
NIRS utilizes a light source which emits photons in the near-infrared range (700-1100 nm).
These photons can penetrate thought the skull and a few centimetres deep into the brain tissue. The emitted light is partly redirected, scattered and absorbed. The absorption spectrum of oxyhaemoglobin (Hboxy) and deoxyhaemoglobin (Hbdeoxy) is different at various
wavelengths(7). This difference allows for calculation of Hboxy and Hbdeoxy concentrations based on the difference in intensity of emitted and received light, using the Beer-Lambert equation:
𝐴 = 𝑙𝑔𝐼0
𝐼 = 𝜀 × 𝑐 × 𝑙
(A: absorption, I0: intensity of emitted light, I: intensity of received light, 𝜀: absorption coefficient, c: concentration, l: photon pathlenght).
Total haemoglobin (HbT) concentration equals the sum of Hboxy and Hbdeoxy concentrations and is proportional to cerebral blood volume (CBV) (8). Therefore NIRS can be used to measure cortical blood oxygenation/saturation (the fraction of Hboxy relative to HbT) and serve as an indicator for the balance between cerebral oxygen delivery and consumption (2, 9).
Mean cortical saturation measured with NIRS comprises of approximately 70% venous and 30% arterial blood (7). It has been established that the relative change in regional O2
saturation (rSO2) and not the absolute rSO2 is considered as a marker of cerebral
haemodynamics, since absolute values show great interindividual variability (10, 11). Other limitations of NIRS are environmental and individual features that influence absolute rSO2
values. These features are summarized in Table 1 (3, 12). Combined effect of the listed factors can sometimes make the interpretation of NIRS measurements uncertain.
It has been established that collateral circulation plays a pivotal role in reducing progression of ischaemic brain damage (13). Patients with good collaterals develop smaller infarcts, respond better to mechanical thrombectomy, show better clinical outcome and have a lesser chance for haemorrhagic transformation after thrombolysis (14-16). However, real-time assessment of collateral circulation in the setting of acute ischaemic stroke is lacking. We know from multimodal MRI studies that augmented CBV, preserved cerebral blood flow (CBF) and delayed mean transit time (MTT) imply the presence of collateral flow (17).
Taussky et al. showed a linear correlation between rSO2 and CBF measured with CT perfusion (18). Therefore, since CBV and CBF correlates with rSO2 values, our goal in this pilot study was to investigate whether NIRS is a suitable method to monitor anterior
watershed territory leptomeningeal collateral circulation via changes in cortical oxygenation during thrombolysis and thrombectomy. Due to the small sample size of our pilot study, we could not draw statistical conclusions. Instead, we aimed to give detailed analysis of the 5 NIRS recordings and explain how these findings could correlate with cerebrovascular haemodynamics and clinical picture.
2. Patients and methods
The study was approved by an independent ethics committee (University of Szeged, Faculty of Medicine, Ethics Committee, ID: 211/2016-SZTE). All patients or first degree relatives gave written informed consent prior to NIRS monitoring. Our study population included 5 acute stroke patients who had left sided anterior circulation infarcts. Detailed patient
characteristics are highlighted in Table 2. All participants received alteplase as recommended by the 2018 AHA/ASA acute ischaemic stroke guideline (1). One patient also had mechanical thrombectomy due to left M1 occlusion (Patient 3). INVOS™ 5100C Cerebral/Somatic Oximeter (Medtronic, Minneapolis, MN, USA) was used for 24-hour continuous monitoring.
Application of the NIRS sensors did not delay the start of thrombolysis. The sensors were placed over bilateral frontal areas, as recommended by the manufacturer. The studied brain areas correspond to the anterior watershed territories. Baseline rSO2 was measured before the initiation of intravenous rt-PA. rSO2 measurements were made approximately every 30 seconds. We analysed the 5 minute average rSO2 values registered at the start of thrombolysis
and also 1 hour, 6 hours, 12 hours, 18 hours and 24 hours after the initiation of alteplase treatment. Interhemispheric rSO2 difference (IHΔrSO2) was calculated as rSO2 on the affected side minus rSO2 measured above the contralateral side. Based on previous articles, 4% change in rSO2 value, and 2% change in IHΔrSO2 was considered significant (5, 19). Simultaneously, blood pressure, peripheral O2 saturation (SpO2), heart rate and electrocardiography were also monitored. The patients’ SpO2 was above 92% while breathing ambient air, therefore they did not receive O2 supplementation during the study period. The only exception was Patient 3 who underwent thrombectomy. He was intubated because he could not cooperate to the procedure due to severe aphasia. The patients’ clinical outcome was assessed with the
National Institutes of Health Stroke Scale (NIHSS) and modified Rankin scale (mRS). A mRS score of 0-2 at 90 days was considered as good functional outcome. If large vessel occlusion (LVO) was present, collateral circulation on imaging was assessed by a neuroradiologist using a 3 grade scale (good-intermediate-poor). Initially, Patients 1-3 had CT angiography (CTA) and Patients 4-5 had MR angiography – time of flight (MRA-TOF) imaging. Figure 1 shows CT and MRI scans approximately 24 hours after thrombolysis for each patient.
3. Results
3.1. Descriptive analysis of each patients’ NIRS recordings
Patient 1 suffered a left middle cerebral artery (MCA) territory stroke due to M2 occlusion.
Collateral circulation was good based on CTA. During NIRS monitoring, no relevant rSO2
difference was observed between the two hemispheres (IHΔrSO2 was between -2% and 0%).
rSO2 values were quite stable on both sides. The patient had a good clinical outcome at 3 months.
Patient 2 had clinical signs of left hemispheric stroke. CTA revealed a left internal carotid artery (ICA) occlusion. Good collaterals were detected on CTA and rSO2 absolute values were higher above the ipsilateral side (average IHΔrSO2 was 3%). rSO2 levels gradually rose in the first 12 hours on both sides. This might indicate subtle increase in CBV and CBF in the leptomeningeal collaterals. The patient’s NIHSS score decreased in the first few days and eventually showed good clinical outcome at 3 months.
Patient 3 had a left M1 occlusion and underwent endovascular thrombectomy after thrombolysis. Collaterals were graded as intermediate on CTA. Initially, a significant IHΔrSO2 was observed. The affected side had a lower absolute rSO2 value (55% vs.63%).
This difference did not change after thrombolysis (1 h post thrombolysis IHΔrSO2 was -7%).
However, after thrombectomy there was a significant increase in rSO2 on the ipsilateral side and consequently IHΔrSO2 substantially decreased. IHΔrSO2 absolute values even became positive after 12 hours. These findings possibly indicate that NIRS sensors were either placed above ischaemic territory or the leptomeningeal collateral circulation was insufficient. As expected from the NIRS recording of the first 24 hours, the patient’s recovery went well (mRS 1 at 90 days).
Patient 4 was the only participant who did not achieve good functional outcome at 90 days (mRS was 3). She suffered a left MCA territory infarction, MRA-TOF imaging did not show LVO. Before thrombolysis, absolute rSO2 was significantly higher on the affected side (69%
vs. 61%). After 1 hour, a marked increase of rSO2 was observed above both hemispheres (+9%, IHΔrSO2 remained 8%). IHΔrSO2 then steeply decreased to -2% at 12 hours. The patient’s NIHSS score worsened. Control CT scan revealed a left striatocapsular infarct. The striatocapsular territory is supplied by perforator arteries stemming from the proximal part of M1 and does not have collateral circulation (20). Since rSO2 increased similarly above both hemispheres in the first hour, it is possible that the ischaemic insult provoked an increase in global cerebral perfusion.
Patient 5 had markedly elevated rSO2 values above the ipsilateral hemisphere (82% vs 69%).
The significantly high IHΔrSO2 was possibly a consequence of chronic right ICA occlusion which led to long-term, effective Willisian collateralization and consequent enlargement of left ICA, MCA and anterior cerebral artery (ACA) (Figure 1/f). Increased blood flow in the left MCA and ACA could explains the high rSO2 values above the ipsilateral watershed area, implying well-developed leptomeningeal collaterals. The IHΔrSO2 value remained high throughout the 24-hour monitoring. The patient had a good functional outcome at 3 months.
Data of NIRS recordings and diagrams are found in the Supplementary material.
3.2. Analysis of combined results
The initial rSO2 above the affected hemispheres showed greater variability compared to the contralateral sides. Patient 5’s results might have led to bias, therefore we only examined the first 4 patients’ results. Still, the difference in variability remained significant, which was most prominent in the first 12 hours. This finding probably reflects impaired autoregulation
on the affected side. Graphs demonstrating rSO2 variability are found in the Supplementary material.
4. Discussion
Most of the previous studies that used NIRS in the setting of acute ischaemic stroke aimed to study the oxygenation of ischaemic brain area. Instead, we tried to investigate whether NIRS is feasible in evaluating leptomeningeal collaterals located at the anterior watershed areas. We believe, that a good example for our hypothesis is the case of Patient 5. Due to a chronic right ICA occlusion, we measured significantly higher rSO2 values above the left hemisphere. The explanation of this finding is possibly the increased blood flow in the left ICA, MCA and ACA which provides adequate blood perfusion to both hemispheres through the circle of Willis. Long-term increased flow led to enlargement of these vessels and subsequently well- developed leptomeningeal collateral circulation in the monitored hemisphere.
Ritzenthaler et al. performed 24-hour NIRS monitoring in 17 acute stroke patients who underwent mechanical thrombectomy (4). All their patients had lower absolute rSO2 values above the affected hemisphere. They did not find a significant relationship between initial ipsilateral rSO2 and collateral circulation (assessed with American Society of Interventional and Therapeutic Neuroradiology Collateral Flow Grading scale, ASITN). Explanations behind their finding might be that NIRS sensors were above ischaemic territory or the leptomeningeal collateral circulation was insufficient in all participants. Since the authors reported patients with ASITN score of more than 3 (indicating good collateral flow), the latter explanation seems unlikely. In our study, Patient 3 demonstrated a similar NIRS trend to those cases published in Ritzenthaler’s article. After successful recanalization, IHΔrSO2 significantly decreased. Patient 2 had left ICA occlusion, but still had higher rSO2 on the ipsilateral side possibly due to well-developed leptomeningeal collaterals.
In another study, NIRS monitoring was also used during thrombectomy in 43 acute ischaemic stroke patient (3). Hametner et al. reported that absolute values of median IHΔrSO2, measured at the end of thrombectomy, were significantly lower in patients who died by 90 days. In addition, patients whose variability in rSO2 values were lower, showed significantly worse 90-day outcomes (mRS score 3-6). Due to the small sample size of our study, we could not draw significant statistical correlations related to NIRS parameters and clinical outcome.
Instead, we aimed to give individual descriptions of each patients’ monitoring.
Damian and Schlosser investigated patients with MCA occlusions who had consequent brain oedema (19). NIRS monitoring was performed in the subacute phase of stroke (at least 12 hours, but within 4 days after the ictus). Interestingly, 22 out of 24 patients had higher absolute rSO2 values above the ipsilateral frontal area. These data are quite the opposite of that published by Ritzenthaler et al. We hypothesize that this difference is because the measurements were made at different time points (subacute vs. acute phase of stroke). It is possible, that the observed positive absolute IHΔrSO2 values in Damien and Schlosser’s study reflects increased compensatory leptomeningeal collateral circulation, which developed on the affected side a few days after the cerebrovascular insult. The article reported good clinical outcome (Glasgow Outcome Scale 3-4) in cases where average IHΔrSO2 values increased over time. Outcomes were assessed between 6-24 weeks, after rehabilitation. In all 5 cases, where the initial IHΔrSO2 decreased, the patients died. Another important finding of the study was that clinical signs of progressing brain oedema and unfavourable rSO2 changes were reversible in some cases by hemicraniectomy, hyperventilation, hypothermia or improved systemic perfusion (19). Therefore, correct interpretation of NIRS monitoring could guide therapeutic interventions. Previous studies showed, that decrease in systemic blood pressure and/or peripheral oxygen saturation (SpO2) correlates well with a drop in rSO2 (3, 5). We believe, that NIRS parameters can guide clinicians in finding the target blood pressure and SpO2 values of each individual patient. For example, some patients with acute ICA occlusion could benefit from increasing blood pressure to maintain adequate collateral circulation until thrombectomy can be performed to achieve recanalization. A preclinical study investigated this concept and found that mild induced hypertension increased cortical collateral blood flow and significantly reduced infarct volume in mice with transient distal MCA occlusion (21).
NIRS monitoring would provide additional information if more sensors were placed over the cerebral hemispheres. This way, rSO2 could be simultaneously measured over the ischaemic territory and watershed areas. Rummel et al. used multichannel NIRS monitoring during transient balloon occlusion of cerebral arteries (8). They demonstrated that different rSO2
changes are observed over the ischaemic core and watershed areas during transient LVOs due to haemodynamic changes in collateral flow. Moreau et al. also applied multichannel NIRS monitoring in 5 acute ischaemic stroke patient who had LVO. The sensors were placed over the frontal, parasagittal frontal, Rolandic sulcus, Broca and Wernicke areas of the brain (12).
The symptom onset to monitoring time was within 9 hours. They found that, at least one region of the infarcted hemisphere showed reduced rSO2 values compared to the unaffected,
contralateral side. One of their patient’s suffered a haemorrhagic transformation a few days after the ischaemic event. Not surprisingly, rSO2 values were significantly higher above the affected hemisphere compared to the contralateral side. This finding is probably explained by the presence of still highly oxygenated blood within the brain tissue (12).
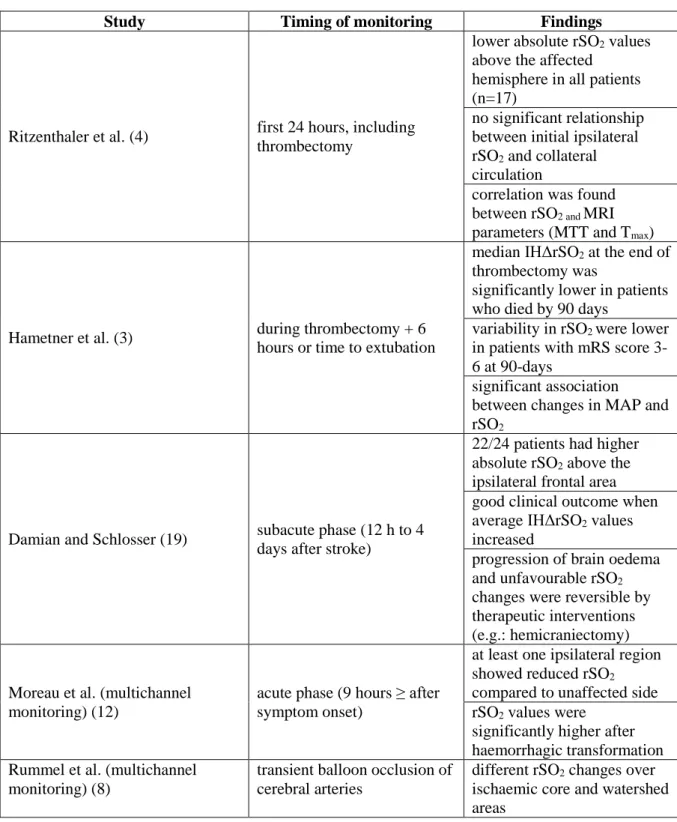
Table 3 highlights the most important findings of previous NIRS studies.
In summary, the results of our pilot study support the use of NIRS monitoring in the setting of acute ischaemic stroke. We believe that this technique could provide valuable information on the state of leptomeningeal collaterals and help monitor the effects of thrombolysis and thrombectomy. In addition, rSO2 values could guide individual management of patients’
blood pressure and oxygen supplementation to widen the therapeutic time window for recanalization (17). However, future studies, preferably with multichannel NIRS monitoring are warranted to gain further information on the relation between leptomeningeal collaterals, ischaemic territory and rSO2 absolute values and trends.
5. Acknowledgements
This work was supported by the project GINOP (2.3.2-15- 2016-00048.), and the MTA-SZTE Neuroscience Research Group of the Hungarian Academy of Sciences and the University of Szeged. We are grateful for the help of the Department of Anaesthesiology and Intensive Therapy for allowing us to use the INVOS™ 5100C Cerebral/Somatic Oximeter.
6. Conflicts of interest
The authors declare that they have no conflict of interest.
References
1. Powers WJ, Rabinstein AA, Ackerson T, Adeoye OM, Bambakidis NC, Becker K, et al. 2018 Guidelines for the Early Management of Patients With Acute Ischemic Stroke: A Guideline for Healthcare Professionals From the American Heart Association/American Stroke Association. Stroke.
2018;49(3):e46-e110.
2. Scheeren TW, Schober P, Schwarte LA. Monitoring tissue oxygenation by near infrared spectroscopy (NIRS): background and current applications. Journal of clinical monitoring and computing. 2012;26(4):279-87.
3. Hametner C, Stanarcevic P, Stampfl S, Rohde S, Veltkamp R, Bosel J. Noninvasive cerebral oximetry during endovascular therapy for acute ischemic stroke: an observational study. Journal of cerebral blood flow and metabolism : official journal of the International Society of Cerebral Blood Flow and Metabolism. 2015;35(11):1722-8.
4. Ritzenthaler T, Cho TH, Mechtouff L, Ong E, Turjman F, Robinson P, et al. Cerebral Near- Infrared Spectroscopy: A Potential Approach for Thrombectomy Monitoring. Stroke.
2017;48(12):3390-2.
5. Aries MJ, Coumou AD, Elting JW, van der Harst JJ, Kremer BP, Vroomen PC. Near infrared spectroscopy for the detection of desaturations in vulnerable ischemic brain tissue: a pilot study at the stroke unit bedside. Stroke. 2012;43(4):1134-6.
6. Terborg C, Bramer S, Harscher S, Simon M, Witte OW. Bedside assessment of cerebral perfusion reductions in patients with acute ischaemic stroke by near-infrared spectroscopy and indocyanine green. Journal of neurology, neurosurgery, and psychiatry. 2004;75(1):38-42.
7. Murkin JM, Arango M. Near-infrared spectroscopy as an index of brain and tissue oxygenation. British journal of anaesthesia. 2009;103 Suppl 1:i3-13.
8. Rummel C, Zubler C, Schroth G, Gralla J, Hsieh K, Abela E, et al. Monitoring cerebral oxygenation during balloon occlusion with multichannel NIRS. Journal of cerebral blood flow and metabolism : official journal of the International Society of Cerebral Blood Flow and Metabolism.
2014;34(2):347-56.
9. Obrig H. NIRS in clinical neurology - a 'promising' tool? NeuroImage. 2014;85 Pt 1:535-46.
10. Misra M, Stark J, Dujovny M, Widman R, Ausman JI. Transcranial cerebral oximetry in random normal subjects. Neurological research. 1998;20(2):137-41.
11. Mille T, Tachimiri ME, Klersy C, Ticozzelli G, Bellinzona G, Blangetti I, et al. Near infrared spectroscopy monitoring during carotid endarterectomy: which threshold value is critical? European journal of vascular and endovascular surgery : the official journal of the European Society for
Vascular Surgery. 2004;27(6):646-50.
12. Moreau F, Yang R, Nambiar V, Demchuk AM, Dunn JF. Near-infrared measurements of brain oxygenation in stroke. Neurophotonics. 2016;3(3):031403.
13. Ginsberg MD. The cerebral collateral circulation: Relevance to pathophysiology and treatment of stroke. Neuropharmacology. 2018;134(Pt B):280-92.
14. Menon BK, Smith EE, Modi J, Patel SK, Bhatia R, Watson TW, et al. Regional leptomeningeal score on CT angiography predicts clinical and imaging outcomes in patients with acute anterior circulation occlusions. AJNR American journal of neuroradiology. 2011;32(9):1640-5.
15. van den Wijngaard IR, Boiten J, Holswilder G, Algra A, Dippel DW, Velthuis BK, et al. Impact of Collateral Status Evaluated by Dynamic Computed Tomographic Angiography on Clinical Outcome in Patients With Ischemic Stroke. Stroke. 2015;46(12):3398-404.
16. Yeo LL, Paliwal P, Low AF, Tay EL, Gopinathan A, Nadarajah M, et al. How temporal evolution of intracranial collaterals in acute stroke affects clinical outcomes. Neurology. 2016;86(5):434-41.
17. Liebeskind DS. Collaterals in acute stroke: beyond the clot. Neuroimaging clinics of North America. 2005;15(3):553-73, x.
18. Taussky P, O'Neal B, Daugherty WP, Luke S, Thorpe D, Pooley RA, et al. Validation of frontal near-infrared spectroscopy as noninvasive bedside monitoring for regional cerebral blood flow in brain-injured patients. Neurosurgical focus. 2012;32(2):E2.
19. Damian MS, Schlosser R. Bilateral near infrared spectroscopy in space-occupying middle cerebral artery stroke. Neurocritical care. 2007;6(3):165-73.
20. Kaesmacher J, Huber T, Lehm M, Zimmer C, Bernkopf K, Wunderlich S, et al. Isolated Striatocapsular Infarcts after Endovascular Treatment of Acute Proximal Middle Cerebral Artery Occlusions: Prevalence, Enabling Factors, and Clinical Outcome. Frontiers in neurology. 2017;8:272.
21. Shin HK, Nishimura M, Jones PB, Ay H, Boas DA, Moskowitz MA, et al. Mild induced hypertension improves blood flow and oxygen metabolism in transient focal cerebral ischemia.
Stroke. 2008;39(5):1548-55.
Tables and Figures
Table 1. Factors influencing rSO2 values Contamination form hair and skin
Sweating Skull thickness
Extracranial circulation
O2 extraction of brain tissue (e.g.: reduced O2 extraction of infarcted or oedematous territory) Blood pressure
Peripheral oxygen saturation
Haemoglobin concentration in blood Level of consciousness
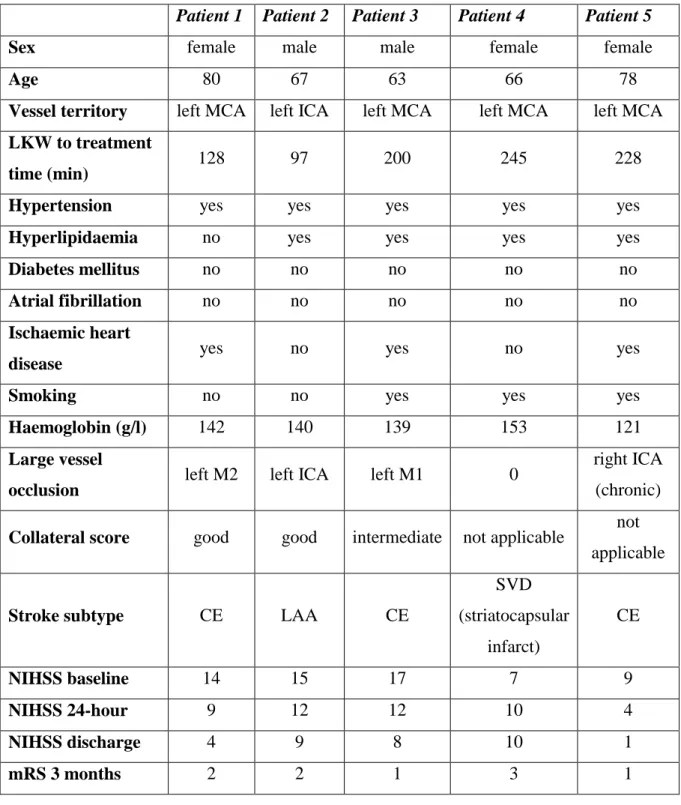
Table 2. Patient characteristics
Patient 1 Patient 2 Patient 3 Patient 4 Patient 5
Sex female male male female female
Age 80 67 63 66 78
Vessel territory left MCA left ICA left MCA left MCA left MCA LKW to treatment
time (min) 128 97 200 245 228
Hypertension yes yes yes yes yes
Hyperlipidaemia no yes yes yes yes
Diabetes mellitus no no no no no
Atrial fibrillation no no no no no
Ischaemic heart
disease yes no yes no yes
Smoking no no yes yes yes
Haemoglobin (g/l) 142 140 139 153 121
Large vessel
occlusion left M2 left ICA left M1 0 right ICA
(chronic) Collateral score good good intermediate not applicable not
applicable
Stroke subtype CE LAA CE
SVD (striatocapsular
infarct)
CE
NIHSS baseline 14 15 17 7 9
NIHSS 24-hour 9 12 12 10 4
NIHSS discharge 4 9 8 10 1
mRS 3 months 2 2 1 3 1
Abbreviations: CE: cardioembolic, ICA: internal carotid artery, LAA: large-artery
atherosclerosis, LKW: last known well, MCA: middle cerebral artery, mRS: modified Rankin score, NIHSS: National Institutes of Health Stroke Scale, SVD: small vessel disease, VA:
vertebral artery.
Table 3. Relevant findings of previous studies with NIRS
Study Timing of monitoring Findings
Ritzenthaler et al. (4) first 24 hours, including thrombectomy
lower absolute rSO2 values above the affected
hemisphere in all patients (n=17)
no significant relationship between initial ipsilateral rSO2 and collateral circulation
correlation was found between rSO2 and MRI parameters (MTT and Tmax)
Hametner et al. (3) during thrombectomy + 6 hours or time to extubation
median IHΔrSO2 at the end of thrombectomy was
significantly lower in patients who died by 90 days
variability in rSO2 were lower in patients with mRS score 3- 6 at 90-days
significant association between changes in MAP and rSO2
Damian and Schlosser (19) subacute phase (12 h to 4 days after stroke)
22/24 patients had higher absolute rSO2 above the ipsilateral frontal area good clinical outcome when average IHΔrSO2 values increased
progression of brain oedema and unfavourable rSO2
changes were reversible by therapeutic interventions (e.g.: hemicraniectomy)
Moreau et al. (multichannel monitoring) (12)
acute phase (9 hours ≥ after symptom onset)
at least one ipsilateral region showed reduced rSO2
compared to unaffected side rSO2 values were
significantly higher after haemorrhagic transformation Rummel et al. (multichannel
monitoring) (8)
transient balloon occlusion of cerebral arteries
different rSO2 changes over ischaemic core and watershed areas
Abbreviations: IHΔrSO2: interhemispheric rSO2 difference, MAP: mean arterial pressure, MRI: magnetic resonance imaging, mRS: modified Rankin scale, MTT: mean transit time, Tmax: time-to-maximum, rSO2: regional oxygen saturation.
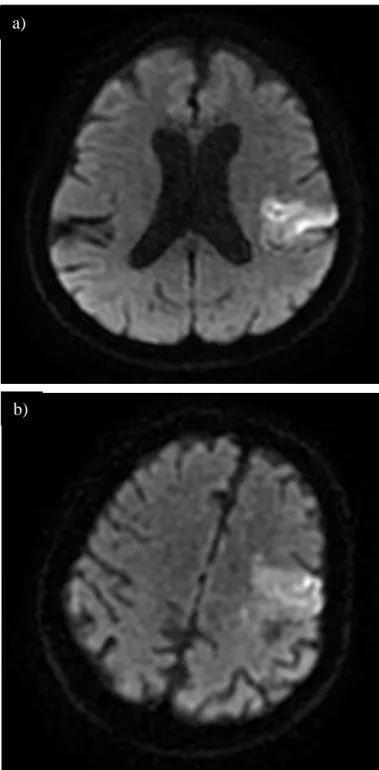
Figure 1. CT and MRI scans of patients approximately 24 hours after thrombolysis. a) Diffusion-weighted imaging (DWI) scan of Patient 1, showing left MCA territory cortical ischaemia. b) DWI scan of Patient 2 shows a similar brain infarct. c) Non-contrast CT (NCCT) scan of Patient 3 after thrombectomy. The infarct mainly involves the left basal ganglia and internal capsule. d) NCCT of Patient 4 showing slight hypodensity in the left corona radiata (striatocapsular infarct). e) DWI scan of patient 5 shows a left MCA territory infarct. f) MRA-TOF reconstruction of Patient 5 demonstrating enlarged left ICA and MCA.
a)
b)
c)
d)
e)
f)
Supplementary material NIRS data from Patient 1.
Time Affected side rSO2 (%)
Unaffected side rSO2
(%) IHΔrSO2 (%)
Before thrombolysis 63 64 -1
1 h post thrombolysis 63 63 0
6 h post thrombolysis 60 61 -1
12 h post thrombolysis 59 59 0
18 h post thrombolysis 61 63 -2
24 h post thrombolysis 61 62 -1
Average 60,80 61,60 -0,80
rSO2 (%) trends of Patient 1.
IHΔrSO2 (%) trend of Patient 1.
50 55 60 65 70 75 80 85
Before 1 h 6 h 12 h 18 h 24 h
affected side rSO2 unaffected side rSO2
-20 -15 -10 -5 0 5 10 15 20
Before 1 h 6 h 12 h 18 h 24 h
IHΔrSO
2NIRS data from Patient 2.
Time Affected side rSO2 (%)
Unaffected side rSO2
(%) IHΔrSO2 (%)
Before thrombolysis 67 63 4
1 h post thrombolysis 69 64 5
6 h post thrombolysis 73 71 2
12 h post thrombolysis 74 73 1
18 h post thrombolysis 63 62 1
24 h post thrombolysis 70 65 5
Average 69,33 66,33 3
rSO2 (%) trends of Patient 2.
IHΔrSO2 (%) trend of Patient 2.
50 55 60 65 70 75 80 85
Before 1 h 6 h 12 h 18 h 24 h
affected side rSO2 unaffected side rSO2
-20 -15 -10 -5 0 5 10 15 20
Before 1 h 6 h 12 h 18 h 24 h
IHΔrSO
2NIRS data from Patient 3.
Time Affected side rSO2 (%)
Unaffected side rSO2
(%) IHΔrSO2 (%)
Before thrombolysis 55 63 -8
1 h post thrombolysis 54 61 -7
6 h post thrombolysis 65 66 -1
12 h post thrombolysis 63 62 1
18 h post thrombolysis 62 58 4
24 h post thrombolysis 61 60 1
Average 60,00 61,67 -1,67
rSO2 (%) trends of Patient 3.
IHΔrSO2 (%) trend of Patient 3.
50 55 60 65 70 75 80 85
Before 1 h 6 h 12 h 18 h 24 h
affected side rSO2 unaffected side rSO2
-20 -15 -10 -5 0 5 10 15 20
Before 1 h 6 h 12 h 18 h 24 h
IHΔrSO
2NIRS data from Patient 4.
Time Affected side rSO2 (%)
Unaffected side rSO2
(%) IHΔrSO2 (%)
Before thrombolysis 69 61 8
1 h post thrombolysis 78 70 8
6 h post thrombolysis 68 62 6
12 h post thrombolysis 69 71 -2
18 h post thrombolysis 70 71 -1
24 h post thrombolysis 73 75 -2
Average 71,17 68,33 2,83
rSO2 (%) trends of Patient 4.
IHΔrSO2 (%) trend of Patient 4.
50 55 60 65 70 75 80 85
Before 1 h 6 h 12 h 18 h 24 h
affected side rSO2 unaffected side rSO2
-20 -15 -10 -5 0 5 10 15 20
Before 1 h 6 h 12 h 18 h 24 h
IHΔrSO
2NIRS data from Patient 5.
Time Affected side rSO2 (%)
Unaffected side
rSO2 (%) IHΔrSO2 (%)
Before thrombolysis 82 69 13
1 h post thrombolysis 86 68 18
6 h post thrombolysis 78 63 15
12 h post thrombolysis 77 60 17
18 h post thrombolysis 81 71 10
24 h post thrombolysis 77 60 17
Average 80,17 65,17 15,00
rSO2 (%) trends of Patient 5.
IHΔrSO2 (%) trend of Patient 5.
50 55 60 65 70 75 80 85
Before 1 h 6 h 12 h 18 h 24 h
affected side rSO2 unaffected side rSO2
-20 -15 -10 -5 0 5 10 15 20
Before 1 h 6 h 12 h 18 h 24 h
IHΔrSO2
Data and graphs on rSO2 variability a) Ipsilateral side
Time rSO2 max. (%) including Patient 5
rSO2 max. (%) not
including Patient 5 rSO2 min. (%)
Before thrombolysis 82 69 55
1 h post thrombolysis 86 78 54
6 h post thrombolysis 78 73 60
12 h post thrombolysis 77 74 59
18 h post thrombolysis 81 70 61
24 h post thrombolysis 77 73 61
50 55 60 65 70 75 80 85 90
Before 1 h 6 h 12 h 18 h 24 h
rSO
2max-min difference (%) on affected side including Patient 5
50 55 60 65 70 75 80 85 90
Before 1 h 6 h 12 h 18 h 24 h
rSO
2max-min difference (%) on affected side not
including Patient 5
b) Contralateral side
Time rSO2 max. (%) rSO2 min. (%)
Before thrombolysis 69 61
1 h post thrombolysis 70 61
6 h post thrombolysis 71 61
12 h post thrombolysis 73 60
18 h post thrombolysis 71 58
24 h post thrombolysis 75 60
50 55 60 65 70 75 80 85 90
Before 1 h 6 h 12 h 18 h 24 h