DOI10.17219/acem/141646
Copyright
© 2021 by Wroclaw Medical University This is an article distributed under the terms of the Creative Commons Attribution 3.0 Unported (CC BY 3.0) (https://creativecommons.org/licenses/by/3.0/)
Address for correspondence
László Vécsei
E-mail: vecsei.laszlo@med.u-szeged.hu
Funding sources
Grants No. GINOP 2.3.2-15-2016-00048; EFOP-3.6.1-16-2016- 00008; TUDFO/47138-1/2019-ITM; 20391-3/2018/FEKUSTRAT.
Conflict of interest
None declared
Acknowledgements
We are grateful for the dedicated work of the nurses of the Stroke Unit at Department of Neurology, Albert Szent-Györgyi Clinical Centre, University of Szeged. We also appreciate the help of our co-workers in our Biobank facility, who handled and stored the blood samples.
Received on March 16, 2021 Reviewed on June 25, 2021 Accepted on August 27, 2021 Published online on October 12, 2021
Abstract
Background. Biomarkers for predicting treatment response to thrombolysis in acute ischemic stroke are currently lacking. Both, animal models and clinical studies have provided evidence that the kynurenine (KYN) pathway is activated in ischemic stroke.
Objectives. In our pilot study, we aimed to investigate whether KYN pathway enzymes and metabolites could serve as potential biomarkers for treatment response in the hyperacute phase of ischemic stroke.
Materials and methods. We included 48 acute ischemic stroke patients who received thrombolysis.
Blood samples were taken both before and 12 h after treatment. Concentrations of 11 KYN metabolites were determined using ultra-high-performance liquid chromatography-mass spectrometry. To assess the treatment response, we used early neurological improvement (ENI), calculated as the difference between the admission and discharge National Institutes of Health Stroke Scale (NIHSS) scores. We performed receiver operating characteristic (ROC) analysis for KYN pathway metabolites and enzymes that showed a correlation with ENI.
Results. In the samples taken before thrombolysis, significantly lower concentrations of kynurenic acid (KYNA) and kynurenine aminotransferase (KAT) activity were found in patients who had ENI (p = 0.01 and p = 0.002, respectively). According to the ROC analysis, the optimal cut-off value to predict ENI for KYNA was 37.80 nM (sensitivity (SN) 69.2%, specificity (SP) 68.4%) and 0.0127 for KAT activity (SN 92.3%, SP 73.7%).
Conclusions. Our research is the first clinical pilot study to analyze changes in the KYN pathway in ischemic stroke patients who received thrombolytic treatment. Based on our results, baseline KYNA concentration and KAT activity could serve as potential biomarkers to predict early treatment response to thrombolysis.
Key words: kynurenine, biomarker, ischemic stroke, acute stroke, thrombolysis
Kynurenic acid and kynurenine aminotransferase
are potential biomarkers of early neurological improvement after thrombolytic therapy: A pilot study
Ádám Annus
1,B–D, Ferenc Tömösi
2,B,D, Ferenc Rárosi
3,C, Evelin Fehér
4,B, Tamás Janáky
2,B,E, Gábor Kecskeméti
2,B, József Toldi
4,E, Péter Klivényi
1,A, László Sztriha
5,E,F, László Vécsei
1,6,7,A,E,F1 Department of Neurology, Albert Szent-Györgyi Health Centre, University of Szeged, Hungary
2 Department of Medical Chemistry, University of Szeged, Hungary
3 Department of Medical Physics and Informatics, University of Szeged, Hungary
4 Department of Physiology, Anatomy and Neuroscience, University of Szeged, Hungary
5 Department of Neurology, King’s College Hospital, London, UK
6 MTA-SZTE Neuroscience Research Group, Szeged, Hungary
7 Interdisciplinary Excellence Centre, University of Szeged, Hungary
A – research concept and design; B – collection and/or assembly of data; C – data analysis and interpretation;
D – writing the article; E – critical revision of the article; F – final approval of the article
Advances in Clinical and Experimental Medicine, ISSN 1899–5276 (print), ISSN 2451–2680 (online) Adv Clin Exp Med. 2021;30(12):1225–1232
Cite as
Annus Á, Tömösi F, Rárosi F, et al. Kynurenic acid and kynurenine aminotransferase are potential biomarkers of early neurological improvement after thrombolytic therapy: A pilot study. Adv Clin Exp Med. 2021;30(12):1225–1232.
doi:10.17219/acem/141646
Introduction
Biomarkers are objective indicators of physiological or pathological processes and have valuable applications in predicting and monitoring clinical response to thera- peutic interventions.1 At present, biomarkers aiding in pre- diction of response to intravenous thrombolysis treatment and prognosis in acute ischemic stroke are lacking in rou- tine clinical practice.2 However, a few blood biomarkers have shown promise: copeptin, a fragment of vasopressin produced in the hypothalamus, was shown to increase the prognostic accuracy of the National Institutes of Health Stroke Scale (NIHSS) in predicting functional outcome and mortality.3 Matrix metalloproteinase-9 (MMP-9) levels correlated with hemorrhagic transformation after thrombolytic therapy, and S100B was elevated in patients with malignant middle cerebral artery syndrome.4,5 Higher activated/inactivated thrombin-activatable fibrinolysis in- hibitor levels correlated with higher NIHSS scores 2 days after treatment, and with poor outcome on the modified Rankin Scale (mRS) score at day 90.6 Faille et al. reported that low admission levels of soluble thrombomodulin and soluble endothelial protein C receptor in patients with arte- rial occlusion were associated with higher recanalization rates after thrombolytic therapy.7 In another study, low endogenous thrombin potential before thrombolysis was found to be an independent predictor of both short- and long-term mortality following treatment.8
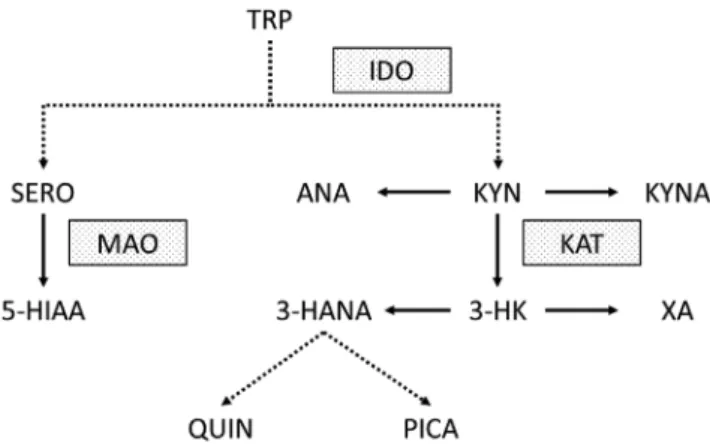
The kynurenine (KYN) pathway is the main route of tryptophan (TRP) metabolism. Animal models and clinical studies have unequivocally proven that the KYN pathway is activated in acute ischemic stroke.9–15 The first step of the pathway is the metabolism of TRP to KYN by indoleamine-2,3-dioxygenase (IDO). Inflammatory cytokines (e.g., interleukin 1β (IL-1β), tumor necrosis fac- tor α (TNF-α) and interferon γ (INF-γ)) were shown to in- crease the expression of IDO.16,17 Therefore, the activation of the KYN pathway following ischemic brain injury is likely part of a secondary inflammatory reaction.18,19 The most well-studied metabolites of the pathway are kynurenic acid (KYNA), 3-hydroxykynurenine (3-HK) and quinolinic acid (QUIN). Kynurenic acid is metabolized by kynurenine ami- notransferase (KAT) from KYN. It is a known endogenous, competitive inhibitor of the N-methyl-D-aspartate receptor (NMDAR) and is therefore thought to have neuroprotective properties.20 In contrast, 3-HK and QUIN are neurotoxic compounds that produce free radicals and cause oxidative stress. Further metabolites and enzymes of the KYN path- way that were analyzed in our study are highlighted in Fig. 1.
The KYN pathway is linked to a number of traditional cerebrovascular risk factors that could influence serum levels of KYN metabolites.21 It has been demonstrated that IDO expression regulates blood pressure in mouse mod- els of systemic inflammation.22 Administration of KYNA into the rostral ventrolateral medulla of spontaneously hypertensive rats, decreased mean arterial blood pressure
by approx. 40 mm Hg.23 Median blood KYN levels of pa- tients with stable angina pectoris were higher in hyper- tensive patients compared to normotensive individuals.24 Elevated xanthurenic acid (XA) levels have been found in diabetic patients.25 Xanthurenic acid forms a complex with insulin that does not activate insulin receptors.26 There- fore, elevated XA levels contribute to insulin resistance.27
Aging, the most relevant non-modifiable risk factor for cerebrovascular diseases, showed a significant association in a multivariate linear regression analysis with serum con- centrations of KYN, TRP, and IDO activity.28 In the Horda- land Health Study, an inverse association was found between heavy smoking and anthranilic acid (AA), TRP, KYN, KYNA, XA, and 3-hydroxyanthranilic acid (3-HANA).29
Objectives
Our aim in this single-center pilot study was to investi- gate whether metabolites of the KYN pathway and activ- ity of relevant enzymes measured before and 12 h after thrombolytic therapy in ischemic stroke could serve as po- tential biomarkers for predicting treatment response and prognosis.
Patients and methods
Patients and outcomes
Our inclusion criteria were patients with a diagnosis of acute ischemic stroke who underwent intravenous thrombolysis with alteplase between January and December 2018. We excluded patients who received thrombectomy and those who had a baseline mRS score >2. The pilot study
Fig. 1. Kynurenine pathway and other tryptophan metabolites measured in our pilot study. Dotted lines indicate more than 1 enzymatic step.
Dotted boxes highlight the most relevant enzymes of the pathway 3-HANA – 3-hydroxyanthranilic acid; 3-HK – 3-hydroxy-kynurenine;
5-HIAA – 5-hydroxy-3-indoleacetic acid; ANA – anthranilic acid;
IDO – indoleamine 2,3-dioxygenase; KAT – kynurenine aminotransferase;
KYN – kynurenine; KYNA – kynurenic acid; MAO – monoamine oxidase;
PICA – picolinic acid; QUIN – quinolinic acid; SERO – serotonin;
TRP – tryptophan; XA – xanthurenic acid.
was conducted in accordance with the revised Declaration of Helsinki, and the protocol was approved by the Ethics Committee of the University of Szeged, Albert Szent-Györ- gyi Clinical Centre (Project GINOP 2.3.2-15-2016-00048).
All patients or their relatives gave informed consent for inclusion before the participation in the study.
C-reactive protein (CRP) and white cell count were mea- sured from blood samples taken upon arrival in the emer- gency department. The time when the alteplase bolus was administered is referred to as “needle time”. All patients underwent repeat imaging approx. 24 h after treatment.
The NIHSS and mRS scores were established by a certified expert. The NIHSS scores were calculated on admission before thrombolysis, and at discharge from the stroke unit.
Efficacy endpoints were early neurological improvement (ENI) and good functional outcome at 30 and 90 days after the stroke. We defined ENI as a ≥4 point decrease in the NIHSS score from admission to discharge. The cri- terion for good functional outcome was an mRS score ≤2.
Sampling
Peripheral venous blood samples were taken just before thrombolysis and 12 h after the initiation of treatment (sam- ples A and B, respectively). Blood samples were centrifuged at 3000/min for 13 min, and sera were then stored at −80°C until further analysis. Due to restricted opening times of our biobank facility, samples were only processed on weekdays.
Measurement of kynurenines by ultra- high-performance liquid chromatography (UHPLC) coupled to tandem mass
spectrometry (MS/MS)
Reagents and chemicals
All reagents and chemicals were of analytical or liquid chromatography-mass spectrometry (LC-MS) grade. Tryp- tophan and its metabolites and d4-picolinic acid (PICA) were purchased from Sigma-Aldrich (St. Louis, USA).
The d3-3-HK was obtained from Buchem BV (Apeldoorn, the Netherlands). The other deuterated internal standards (ISs; d4-serotonin (SERO), d4-KYN, d3-3-3-HANA, d5- TRP, d5-5-hydroxy-3-indoleacetic acid (5-HIAA), d5- KYNA, d4-XA and d3-QUIN) were purchased from To- ronto Research Chemicals (Toronto, Canada). Acetone, methanol (MeOH) and water were obtained from VWR Chemicals (Monroeville, USA). Formic acid (FA) was pur- chased from Thermo Fisher Scientific (Portsmouth, USA).
Preparation of standard, IS and quality control solutions
Stock solutions, calibration standards and quality con- trol (QC) samples were prepared as described previously.30
Calibration standards consisted of 100 μL of “blank” serum, 10 μL of standard solution mix (156.25–5000 nM SERO, 312.5–10,000 nM KYN, 7.8–250 nM 3-HANA, 6.25–200 µM TRP, 7.8–250 nM 5-HIAA, 6.25–200 nM ANA, 4.7–150 nM KYNA, 6.25–200 nM 3-HK, 1.5–50 nM XA, 3.125–100 nM PICA, and 62.5–2000 nM QUIN in 0.1% (v/v) aqueous FA), were treated with 370 μL of ice-cold acetone: MeOH (1:1, (v/v)) containing 10 μL of the SIL-IS mix (1500 nM d4-SERO, 1000 nM d4-KYN, 65 nM d3-3-HANA, 5250 nM d5-TRP, 200 nM d5-5-HIAA, 50 nM d5-KYNA, 90 nM d3-3-HK, 25 nM d4-XA, 80 nM d4-PICA, and 300 nM d3-QUIN) to precipitate proteins. After centrifugation, 400 μL of su- pernatant were transferred to a new tube, spun for 15 s and split into 2 equal parts. After concentration under a vacuum (Savant SC 110 A Speed Vac Plus; Savant, Holbrook, USA), half of the sample was treated with 70 μL of derivatizing re- agent (n-butanol-acetyl chloride, 9:1, (v/v)) and was incubated for 1 h at 60°C. The mixture was dried under nitrogen be- fore reconstitution. Both parts of the sample were dissolved in 100–100 μL of the starting eluent, vortexed, centrifuged, and combined.
Preparation of human serum samples for analysis The human serum samples were prepared as described previously.30 Briefly, to 100 μL of each serum sample, 10 μL 0.1% (v/v) of aqueous FA and 370 μL of ice-cold ac- etone–MeOH (1:1, (v/v)) containing 10 μL of the SIL-IS mix (the same as used in the preparation of the calibration standards) were added, and 400 μL of supernatant was treated as above.
Instrumentation and UHPLC-MS/MS analysis
The UHPLC separation of TRP and its metabolites was performed on a pentafluorophenyl (PFP) column (100 Å, 100 mm × 2.1 mm, particle size 2.6 μm; Phenomenex, Torrance, USA) connected to an ACQUITY I-Class UPLC™ liquid chromatography system (Waters, Man- chester, UK) using 0.1% (v/v) aqueous FA as solvent A and MeOH containing 0.1% (v/v) FA as solvent B. All mass spectrometric measurements were carried out on an on- line connected Q Exactive™ Plus Hybrid Quadrupole- Orbitrap Mass Spectrometer (Thermo Fisher Scientific, San Jose, USA), operating in the positive electrospray ion- ization mode. For quantitative mass spectrometric analysis through MS/MS, the parallel reaction monitoring (PRM) data acquisition mode was chosen. The optimization of parameters and the validation of the UHPLC-MS/MS analysis for human serum were carried out previously.30
Statistical analyses
Our outcome measures were categorical variables (ENI, good outcome at 30 and 90 days). Based on the Shapiro–
Wilk test, some KYN metabolites and enzymatic activities
did not show normal distribution (namely, 3-HANA, TRP, ANA, 3-HK, PICA, XA, monoamine oxidase (MAO), and KAT). Therefore, based on the distribution, continuous variables were either expressed as mean ± standard de- viation (SD) or median and interquartile range (IQR).
Kynurenine metabolite concentrations and enzymatic ac- tivities measured at the 2 timepoints were compared with either paired sample t-test (if the distribution was normal), or Wilcoxon matched-pairs signed-ranks test (when data was nonparametric) for cases where both samples were taken. To compare means of concentrations and enzymatic activities between groups with and without ENI or good functional outcome, we used the independent sample t-test or Mann–Whitney U test (depending on the distribution of the data). Boxplots were drawn to allow for better visu- alization of statistically significant findings. Furthermore, if statistical significance was met, we performed receiver operating characteristic (ROC) analysis. We calculated area under the curve (AUC), as well as sensitivity (SN) and specificity (SP) for different cut-off values. Due to the small sample size of our pilot study, logistic regression was not performed. A p-value of <0.05 was regarded statistically significant. Confidence intervals (CI) of 95% were presented where appropriate. Analyses were carried out with IBM SPSS v. 24 (IBM Corp., Armonk, USA) statistical software.
Results
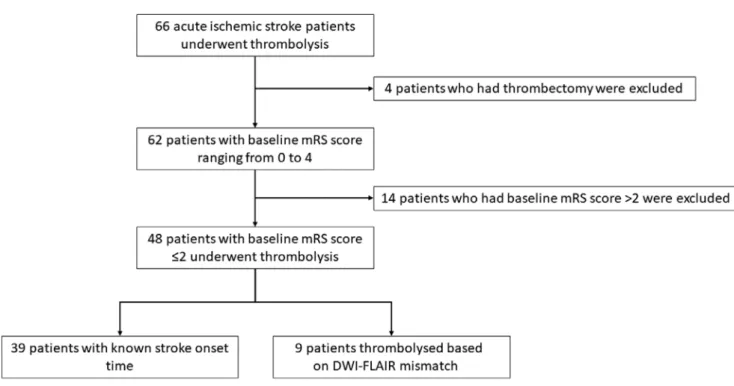
Our pilot study included 48 patients. Thirty-nine were known to be within the 4.5 h thrombolysis time window.
In the remaining 9 patients with unknown stroke onset time, intravenous alteplase was administered on the ba- sis of a diffusion-weighted imaging (DWI)-fluid-attenu- ated inversion recovery (FLAIR) mismatch demonstrated on an acute brain magnetic resonance imaging (MRI), as per the WAKE-UP trial.31 The flowchart of patient selection is shown in Fig. 2. The clinical characteristics of our study population are highlighted in Table 1. Seventeen patients had large vessel occlusion (LVO), but mechanical thrombec- tomy was not performed due to limited availability of this service in our center at the time. We collected 32 blood samples before thrombolysis and 36 samples 12 h after treatment. Twenty-three patients had samples taken at both timepoints. The UHPLC-MS/MS method provided simul- taneous quantification of TRP and its 10 most important metabolites (SERO, KYN, 3-HANA, 5-HIAA, ANA, KYNA, 3-HK, XA, PICA, and QUIN).30 Concentrations of the mea- sured KYN metabolites of the 23 patients who had sampling at both timepoints are shown in Table 2. Significant changes in paired serum levels were observed for KYN, ANA, KYNA, XA, PICA, and QUIN. Enzymatic activity of IDO, MAO and KAT were calculated by the following ratios: KYN/TRP, 5-HIAA/SERO and KYNA/KYN, respectively. Enzymatic activities are also demonstrated in Table 2. The activity of IDO and MAO decreased significantly after 12 h.
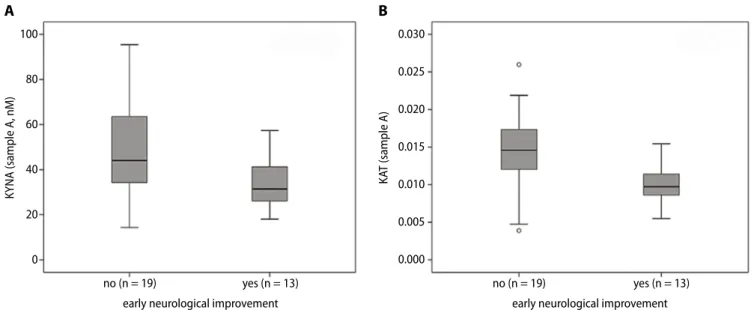
Patients with ENI had significantly lower concentra- tions of KYNA and lower KAT activity in sample A (in- dependent sample t-test, p = 0.01, df = 30, t = −2.722; and Mann–Whitney U test, p = 0.002, z = −3.050, respectively, Fig. 3). There was no statistically significant difference in sample B. Regarding the presence or absence of good outcome at 30 and 90 days, concentrations and enzymatic activities did not statistically significantly differ in sam- ples A or B. Receiver operating characteristic analysis for ENI was performed using KYNA levels and KAT activity measured before treatment (Fig. 4). The AUC for KYNA concentrations was 0.74, 95% CI = 0.57–0.91, p = 0.02.
The optimal cut-off value to predict ENI was 37.8 nM (SN 69.2%, SP 68.4%). Similarly, the AUC for KAT activity was 0.82, 95% CI = 0.67–0.98, p = 0.002. The optimal cut-off activity was 0.0127 (SN 92.3%, SP 73.7%).
Discussion
To our knowledge, this is the first study to analyze the changes in KYN metabolite serum levels and enzymatic
Table 1. Clinical data of our study population (n = 48). Some data were not available for all patients. These are highlighted after each criteria accordingly
Patient characteristics Value
Mean age ±SD [years] 67.33 ±12.04
Female 24 (50%)
Male 24 (50%)
Hypertension 41 (85.42%)
Diabetes mellitus 13 (27.08%)
Hyperlipidemia 39 (81.25%)
Smoking 14 (29.17%)
Atrial fibrillation 7 (14.58%)
Coronary artery disease 10 (20.83%)
Mean baseline NIHSS score ±SD 8.81 ±4.29
Mean baseline mRS score ±SD 0.79 ±0.77
Large vessel occlusion 17 (35.42%)
Mean SOtN time ±SD (min, n = 39) 136.59 ±53.9 Mean DtN time ±SD (min, n = 47) 57.45 ±35.72 Length of stay in stroke unit [days] 4.91 ±2.05 Intracerebral hemorrhage after treatment 4 (8.33%) Mean C-reactive protein ±SD [mg/L], n = 47) 10.44 ±18.78 Mean white cell count ±SD [g/L] 8.07 ±2.31 Mean discharge NIHSS score ±SD 6.71 ±7.89 Early neurological improvement 19 (39.58%) Mean mRS score at 30 days ±SD (n = 45) 2.47 ±1.84 Mean mRS score at 90 days ±SD (n = 40) 2.38 ±1.9 Good functional outcome at day 30 (n = 45) 27 (60%) Good functional outcome at day 90 (n = 40) 24 (60%) DtN – door to needle; mRS – modified Rankin Scale; NIHSS – National Institutes of Health Stroke Scale; SD – standard deviation; SOtN – stroke onset to needle.
activity in acute ischemic stroke patients who received thrombolytic treatment.
The main finding of our pilot study is that ischemic stroke patients with ENI after thrombolysis have significantly lower concentrations of KYNA and lower KAT activity at baseline. Therefore, we propose that pre-thrombolysis
KYNA levels and KAT activity are potential biomarkers of ENI. It should be highlighted that ENI was defined as the difference between the admission and discharge NIHSS scores, although we are aware that ENI is usually calculated with the NIHSS score taken 24 h after symptom onset or treatment.32 The mean time difference between
Table 2. Mean and median concentrations of KYN metabolites taken before thrombolysis (sample A) and 12 hours after (sample B) alteplase treatment.
Only the results of 23 patients who had sampling at both timepoints are presented. The unit of measurement for all metabolites is nanomoles (nM).
Enzymatic activities are also shown (these ratios do not have units of measurement). Concentrations are expressed as mean ±SD if the distribution was normal or median and interquartile range when data was nonparametric. Concentrations and enzymatic activities were compared with either paired sample t-test (if the distribution was normal) or Wilcoxon matched-pairs signed-ranks test (when data was nonparametric)
Metabolites and
enzymes Sample A (nM) (n = 23) Sample B (nM) (n = 23) p-value
SERO 655.34 ±301.3 680.97 ±263.54 0.44
KYN 3669.52 ±1044.79 3413.1 ±1114.47 0.03
3-HANA 53.07 (40.9–79.74) 43.33 (35.58–62.01) 0.05
TRP 46,371.75 (41,588.69–54,644.26) 50,599.91 (41,798.89–53,961.54) 0.56
5-HIAA 96.58 ±35.47 88.15 ±36.29 0.18
ANA 53.75 (38.73–68.44) 43.8 (27.07–60.2) 0.01
KYNA 45.44 ±20.02 37.69 ±14.55 0.004
XA 11.27 (5.8–16.51) 4.58 (2.56–7.93) 0.001
3-HK 125.68 (79.33–175.98) 115.73 (87.04–161.72) 0.26
PICA 43.33 (34.09–52.22) 29.47 (24.12–39.6) <0.001
QUIN 673.69 ±230.82 620.26 ±236.66 0.001
IDO 0.08 ±0.02 0.07 ±0.02 0.02
MAO 0.16 (0.11–0.21) 0.12 (0.08–0.2) 0.02
KAT 0.01 (0.01–0.02) 0.01 (0.01–0.01) 0.14
3-HANA – 3-hydroxyanthranilic acid; 3-HK – 3-hydroxykynurenine; 5-HIAA – 5-hydroxy-3-indoleacetic acid; ANA – anthranilic acid; IDO – indoleamine 2,3-dioxygenase; KAT – kynurenine aminotransferase; KYN – kynurenine; KYNA – kynurenic acid; MAO – monoamine oxidase; PICA – picolinic acid;
QUIN – quinolinic acid; SD – standard deviation; SERO – serotonin; TRP – tryptophan; XA – xanthurenic acid.
Fig. 2. Flowchart showing patient enrollment in our pilot study
DWI – diffusion weighted imaging; FLAIR – fluid attenuated inversion recovery; mRS – modified Rankin Scale.
the admission and discharge date in our population was 4.91 days. We believe that this five-day difference does not confound the treatment effect size of intravenous al- teplase. Our view is that the true effect of thrombolysis is better reflected in the short-term NIHSS change than in the 30 and 90 day mRS scores, which are more depen- dent on a number of additional factors, such as the pre- stroke condition of patients, comorbidities, polypharmacy, the availability and quality of rehabilitation, and support provided by family.
Based on our previous research in animal stroke models, we had hypothesized that levels of neuroprotective KYNA
would be higher in patients with better outcomes.13,33 However, lower concentrations of KYNA and lower KAT activity were found to predict good treatment response, with good sensitivity and specificity. Our findings support previous observations by Darlington et al. of higher KYNA levels being detected in patients who died within 21 days after ischemic stroke compared to those who survived.11 It is unclear why increased levels of KYNA are associated with worse clinical outcome in ischemic stroke. One pos- sible explanation is that KYNA is an endogenous NMDAR antagonist; therefore, it could further decrease synaptic activity in brain ischemia and, consequently, worsen brain function.11,34 It has also been reported that KYNA can in- terfere with mitochondrial respiration, resulting in reduced ATP synthesis and increased levels of oxidative stress.35
We did not find any correlation between KYN metabo- lites or enzymes and good functional outcome measured 30 and 90 days after the stroke. This finding was somewhat surprising, given the results of the ROC analysis. Brouns et al. reported that the KYN/TRP ratio correlated with the mRS score 3 months after the ischemic stroke.10 Pos- sible explanations behind the lack of correlation in our study are the small sample size and the effect of throm- bolytic treatment.
Limitations
The main limitations of our pilot study are the small sample size and the absence of a control group. An ideal control group would have been acute ischemic stroke pa- tients who did not receive alteplase treatment. However, this would have been unethical, given the evidence sup- porting thrombolytic treatment.36
Fig. 3. Boxplots highlighting the significant difference of KYNA levels (A) and KAT activity (B) between patients with and without early neurological improvement. Measurements were made from samples taken before alteplase treatment. For each box, the horizontal line inside the box shows the median.
The ends of the boxes represent the 1st and 3rd quartiles. The whiskers extend to the highest and lowest values not considered outliers (defined as 1.5 times the interquartile range (IQR)). Outliers are shown as circles
KAT – kynurenine aminotransferase; KYNA – kynurenic acid.
Fig. 4. Receiver operating characteristic (ROC) curve showing the accuracy of KYNA concentration and KAT activity (measured before thrombolysis) in predicting early neurological improvement
KAT – kynurenine amino transferase; KYNA – kynurenic acid.
100
80
60
40
20
0
no (n = 19) yes (n = 13)
early neurological improvement
KYNA (sample A, nM)
A
0.030
0.025
0.020
0.015
0.010
0.005
0.000
no (n = 19) yes (n = 13)
early neurological improvement
KAT (sample A)
B
0.0 1.0
0.8
0.6
0.4
0.2
0.0 0.0 0.0 0.0
1-specificity
sensitivity
0.0 0.0
KYNAKAT activity
We could not obtain blood samples from every patient at both timepoints due to occasional limited availability of our biobank facility, and the loss of several patients be- fore follow-up. Due to the small number of individuals included in our study, logistic regression analysis was not applicable.
Also, it is important to note that KYN metabolites were measured from the serum of patients. Therefore, our findings do not necessarily reflect the intracerebral changes in KYN metabolites and enzymes in the setting of acute ischemic stroke. It has been previously reported that approx. 40% of KYN is produced locally in the central nervous system and the remaining 60% is taken up from circulation.37 Metabolites that can cross the blood-brain barrier (BBB) via large neutral amino acid transporters are TRP, KYN and 3-HK.20,38 Kynurenic acid only has a limited ability to traverse across the BBB.
Conclusions
In conclusion, our pilot study provides further evidence that the KYN pathway is already activated within the first few hours after symptom onset in acute ischemic stroke.
We propose that baseline serum KYNA concentration and KAT activity are potential biomarkers predicting early treatment response to thrombolytic therapy in stroke.
Consequently, genetic polymorphisms of KAT could also hold promise as a further research target. Future studies with larger samples, well-chosen control groups and rigor- ous methodology are needed.
ORCID iDs
Ádám Annus https://orcid.org/0000-0003-0498-6578 Ferenc Tömösi https://orcid.org/0000-0002-6657-5777 Ferenc Rárosi https://orcid.org/0000-0002-1014-9242 Evelin Fehér https://orcid.org/0000-0003-2564-3937 Tamás Janáky https://orcid.org/0000-0002-6466-8283 Gábor Kecskeméti https://orcid.org/0000-0002-5584-6869 József Toldi https://orcid.org/0000-0001-7355-0503 Péter Klivényi https://orcid.org/0000-0002-5389-3266 László Sztriha https://orcid.org/0000-0003-4639-3180 László Vécsei https://orcid.org/0000-0001-8037-3672
References
1. Biomarkers Definitions Working Group. Biomarkers and surro- gate endpoints: Preferred definitions and conceptual framework.
Clin Pharmacol Ther. 2001;69(3):89–95. doi:10.1067/mcp.2001.113989 2. Kim SJ, Moon GJ, Bang OY. Biomarkers for stroke. J Stroke. 2013;15(1):
27–37. doi:10.5853/jos.2013.15.1.27
3. Katan M, Fluri F, Morgenthaler NG, et al. Copeptin: A novel, indepen- dent prognostic marker in patients with ischemic stroke. Ann Neurol.
2009;66(6):799–808. doi:10.1002/ana.21783
4. Castellanos M, Sobrino T, Millan M, et al. Serum cellular fibronec- tin and matrix metalloproteinase-9 as screening biomarkers for the prediction of parenchymal hematoma after thrombolytic therapy in acute ischemic stroke: A multicenter confirmatory study. Stroke.
2007;38(6):1855–1859. doi:10.1161/STROKEAHA.106.481556 5. Foerch C, Otto B, Singer OC, et al. Serum S100B predicts a malignant
course of infarction in patients with acute middle cerebral artery occlusion. Stroke. 2004;35(9):2160–2164. doi:10.1161/01.STR.0000138 730.03264.ac
6. Alessi MC, Gaudin C, Grosjean P, et al. Changes in activated throm- bin-activatable fibrinolysis inhibitor levels following thrombolytic therapy in ischemic stroke patients correlate with clinical outcome.
Cerebrovasc Dis. 2016;42(5–6):404–414. doi:10.1159/000447722 7. Faille D, Labreuche J, Meseguer E, Huisse MG, Ajzenberg N, Mazighi M.
Endothelial markers are associated with thrombolysis resistance in acute stroke patients. Eur J Neurol. 2014;21(4):643–647. doi:10.1111/
ene.12369
8. Hudak R, Szekely EG, Kovacs KR, et al. Low thrombin generation pre- dicts poor prognosis in ischemic stroke patients after thrombolysis.
PloS One. 2017;12(7):e0180477. doi:10.1371/journal.pone.0180477 9. Hertelendy P, Toldi J, Fulop F, Vecsei L. Ischemic stroke and kynurenines:
Medicinal chemistry aspects. Curr Med Chem. 2018;25(42):5945–5957.
doi:10.2174/0929867325666180313113411
10. Brouns R, Verkerk R, Aerts T, et al. The role of tryptophan catabolism along the kynurenine pathway in acute ischemic stroke. Neurochem Res.
2010;35(9):1315–1322. doi:10.1007/s11064-010-0187-2
11. Darlington LG, Mackay GM, Forrest CM, Stoy N, George C, Stone TW.
Altered kynurenine metabolism correlates with infarct volume in stroke. Eur J Neurosci. 2007;26(8):2211–2221. doi:10.1111/j.1460-9568.
2007.05838.x
12. Mo X, Pi L, Yang J, Xiang Z, Tang A. Serum indoleamine 2,3-dioxy- genase and kynurenine aminotransferase enzyme activity in patients with ischemic stroke. J Clin Neurosci. 2014;21(3):482–486. doi:10.1016/j.
jocn.2013.08.020
13. Robotka H, Sas K, Agoston M, et al. Neuroprotection achieved in the ischaemic rat cortex with L-kynurenine sulphate. Life Sci. 2008;
82(17–18):915–919. doi:10.1016/j.lfs.2008.02.014
14. Colpo GD, Venna VR, McCullough LD, Teixeira AL. Systematic review on the involvement of the kynurenine pathway in stroke: Pre-clinical and clinical evidence. Front Neurol. 2019;10:778. doi:10.3389/fneur.
2019.00778
15. Ormstad H, Verkerk R, Aass HC, Amthor KF, Sandvik L. Inflammation- induced catabolism of tryptophan and tyrosine in acute ischemic stroke. J Mol Neurosci. 2013;51(3):893–902. doi:10.1007/s12031-013- 0097-2
16. Maes M, Leonard BE, Myint AM, Kubera M, Verkerk R. The new ‘5-HT’
hypothesis of depression: Cell-mediated immune activation induces indoleamine 2,3-dioxygenase, which leads to lower plasma trypto- phan and an increased synthesis of detrimental tryptophan catabo- lites (TRYCATs), both of which contribute to the onset of depression.
Prog Neuropsychopharmacol Biol Psychiatry. 2011;35(3):702–721.
doi:10.1016/j.pnpbp.2010.12.017
17. Oxenkrug GF. Genetic and hormonal regulation of tryptophan kyn- urenine metabolism: Implications for vascular cognitive impairment, major depressive disorder, and aging. Ann N Y Acad Sci. 2007;1122:35–49.
doi:10.1196/annals.1403.003
18. Eltzschig HK, Eckle T. Ischemia and reperfusion: From mechanism to translation. Nat Med. 2011;17(11):1391–1401. doi:10.1038/nm.2507 19. Schroeter M, Jander S, Witte OW, Stoll G. Local immune responses in
the rat cerebral cortex after middle cerebral artery occlusion. J Neuro
immunol. 1994;55(2):195–203. doi:10.1016/0165-5728(94)90010-8 20. Vecsei L, Szalardy L, Fulop F, Toldi J. Kynurenines in the CNS: Recent
advances and new questions. Nat Rev Drug Discov. 2013;12(1):64–82.
doi:10.1038/nrd3793
21. Song P, Ramprasath T, Wang H, Zou MH. Abnormal kynurenine path way of tryptophan catabolism in cardiovascular diseases. Cell Mol Life Sci.
2017;74(16):2899–2916. doi:10.1007/s00018-017-2504-2
22. Wang Y, Liu H, McKenzie G, et al. Kynurenine is an endothelium-deri- ved relaxing factor produced during inflammation. Nat Med. 2010;16(3):
279–285. Erratum in: Nat Med. 2010;16(5):607. doi:10.1038/nm.2092 23. Ito S, Komatsu K, Tsukamoto K, Sved AF. Excitatory amino acids in
the rostral ventrolateral medulla support blood pressure in spon- taneously hypertensive rats. Hypertension. 2000;35(1 Pt 2):413–417.
doi:10.1161/01.hyp.35.1.413
24. Pedersen ER, Tuseth N, Eussen SJ, et al. Associations of plasma kynu- renines with risk of acute myocardial infarction in patients with stab- le angina pectoris. Arterioscler Thromb Vasc Biol. 2015;35(2):455–462.
doi:10.1161/ATVBAHA.114.304674
25. Hattori M, Kotake Y, Kotake Y. Studies on the urinary excretion of xant- hurenic acid in diabetics. Acta Vitaminol Enzymol. 1984;6(3):221–228.
PMID:6524581
26. Kotake Y, Ueda T, Mori T, Igaki S, Hattori M. Abnormal tryptophan metabolism and experimental diabetes by xanthurenic acid (XA).
Acta Vitaminol Enzymol. 1975;29(1–6):236–239. PMID:1244098 27. Stone TW, Darlington LG. Endogenous kynurenines as targets for
drug discovery and development. Nat Rev Drug Discov. 2002;1(8):
609–620. doi:10.1038/nrd870
28. Capuron L, Schroecksnadel S, Féart C, et al. Chronic low-grade inflamma- tion in elderly persons is associated with altered tryptophan and tyro- sine metabolism: Role in neuropsychiatric symptoms. Biol Psychiatry.
2011;70(2):175–182. doi:10.1016/j.biopsych.2010.12.006
29. Theofylaktopoulou D, Midttun Ø, Ulvik A, et al. A community-based study on determinants of circulating markers of cellular immune acti- vation and kynurenines: The Hordaland Health Study. Clin Exp Immunol.
2013;173(1):121–130. doi:10.1111/cei.12092
30. Tomosi F, Kecskemeti G, Cseh EK, et al. A validated UHPLC-MS method for tryptophan metabolites: Application in the diagnosis of multi- ple sclerosis. J Pharm Biomed Anal. 2020;185:113246. doi:10.1016/j.
jpba.2020.113246
31. Thomalla G, Simonsen CZ, Boutitie F, et al. MRI-guided thromboly- sis for stroke with unknown time of onset. N Engl J Med. 2018;379(7):
611–622. doi:10.1056/NEJMoa1804355
32. Agarwal S, Cutting S, Grory BM, et al. Redefining early neurological improvement after reperfusion therapy in stroke. J Stroke Cerebrovasc Dis.
2020;29(2):104526. doi:10.1016/j.jstrokecerebrovasdis.2019.104526
33. Gigler G, Szenasi G, Simo A, et al. Neuroprotective effect of L-kynuren- ine sulfate administered before focal cerebral ischemia in mice and global cerebral ischemia in gerbils. Eur J Pharmacol. 2007;564(1–3):
116–122. doi:10.1016/j.ejphar.2007.02.029
34. Kessler M, Terramani T, Lynch G, Baudry M. A glycine site associated with N-methyl-D-aspartic acid receptors: Characterization and identifica- tion of a new class of antagonists. J Neurochem. 1989;52(4):1319–1328.
doi:10.1111/j.1471-4159.1989.tb01881.x
35. Baran H, Kepplinger B, Herrera-Marschitz M, Stolze K, Lubec G, Nohl H. Increased kynurenic acid in the brain after neonatal asphyxia.
Life Sci. 2001;69(11):1249–1256. doi:10.1016/s0024-3205(01)01215-2 36. Powers WJ, Rabinstein AA, Ackerson T, et al. Guidelines for the early
management of patients with acute ischemic stroke. 2019 update to the 2018 guidelines for the early management of acute ischemic stroke: A guideline for healthcare professionals from the American Heart Association/American Stroke Association. Stroke. 2019;50(12):
e344–e418. doi:10.1161/STR.0000000000000211
37. Gal EM, Sherman AD. Synthesis and metabolism of L-kynurenine in rat brain. J Neurochem. 1978;30(3):607–613. doi:10.1111/j.1471-4159.1978.
tb07815.x
38. Pardridge WM. Blood-brain barrier carrier-mediated transport and brain metabolism of amino acids. Neurochem Res. 1998;23(5):635–644.
doi:10.1023/a:1022482604276