0139–3006 © 2019 The Author(s) DOI: 10.1556/066.2019.0001
Preliminary communication
SUBJECTIVE PALATABILITY AND APPETITE AFTER GLUTEN-FREE PASTA: A PILOT STUDY
I. CIOFFIa*, L.SANTARPIAa, A. VACCAROa, M. NACCARATOa, R. IACONEa, M. MARRAa, F.CONTALDOb and F. PASANISIb
a Internal Medicine and Clinical Nutrition Unit, Department of Clinical Medicine and Surgery, Federico II University Hospital, Pansini 5, 80131 Naples. Italy
bInteruniversity Center for Obesity and Eating disorders (CISRO), Department of Clinical Medicine and Surgery, Federico II University Hospital, Pansini 5, 80131 Naples. Italy
(Received: 14 September 2018; accepted: 2 December 2018)
The interest in gluten-free (GF) diet has greatly increased also in people without celiac disease (CD). This pilot study aimed to investigate the postprandial effect of GF-pasta, made by using the pasta-making process applied to artisan wheat pasta, on palatability, appetite sensation, and glucose metabolism in 8 healthy volunteers. Two iso-caloric lunch-meals consisting of: 1) gluten-free pasta (GFP) and 2) refi ned wheat pasta (RP) were compared in cross-over design. Both subjective appetite, assessed by visual analogue scale (VAS), and blood sample were taken before meal and at half-hour intervals for 4 hours. Palatability was evaluated immediately after the meal-test by VAS. All participants underwent pre- and postprandial energy expenditure (EE) measured by indirect calorimetry. We found that subjective palatability did not signifi cantly differ between meals. Similarly, repeated measures ANOVA showed that GFP did not affect appetite ratings, postprandial glucose, and insulin responses compared to RP. Then, postprandial EE was affected by time (P=0.006), increasing at 60 min, but not by meals. In conclusion, artisanal GFP was as palatable as RP pasta, without affecting perceived satiety and postprandial glycaemia compared to RP in healthy subjects. Clearly, GFP results are preliminary and need to be investigated in larger studies.
Keywords: gluten free pasta, palatability, satiety, energy expenditure, glucose response
In the last years, interest in gluten free diet (GFD) has greatly increased not only among people who must avoid gluten (e.g. people with celiac disease) but also by others who wish to exclude gluten-based products for other reasons (MARTI & PAGANI, 2013; WU et al., 2015).
As a result, the increasing demand for GF products is raising the needs to produce food that can better mimic the sensorial and nutritive characteristics of the traditional gluten-based products (THOMPSON, 2009). However, due to technological diffi culties in replacing gluten, GF foods can contain more carbohydrates and lipids than their gluten-containing equivalents, providing more calories and getting less nutritive and palatable (DO NASCIMENTO et al., 2013;
SCAZZINA et al., 2015).
* To whom to correspondence should be addressed.
Phone: +39 081746 2333; fax: 081 546 6152; e-mail: iolanda.cioffi @unina.it
This is an open-access article distributed under the terms of the Creative Commons Attribution-NonCommercial 4.0 International License (https://creativecommons.org/licenses/by-nc/4.0/), which permits unrestricted use, distribu- tion, and reproduction in any medium for non-commercial purposes, provided the original author and source are credited, a link to the CC License is provided, and changes - if any - are indicated.
Moreover, the absence of gluten, a mixture of proteins that interferes with starch digestion, could affect the glycaemic response, increasing the glycaemic index (GI) (BJÖRCK
et al. 1994; FOSTER-POWELL et al. 2002) and potentially lowering perceived satiety (BASCUÑÁN
et al. 2017). Currently, data on glycaemic response of GF products still show contradicting results. For instance, the nutritional composition of several commercial GF products, especially pasta, was reported as of low (dry pasta) to medium (fresh pasta) values of glycaemic index (GI) by BACCHETTI and co-workers (2014) and SCAZZINA and co-workers (2015), a nd of increased values by BERTI and co-workers (2004) and JOHNSTON and co-workers (2017). Additionally, most GF pasta exhibit poor cooking and texture qualities compared to their gluten equivalents, with potential infl uence on appetite sensation (WIKAREK et al., 2014).
As previously published, we tested different types of artisanal pasta on subjective appetite, palatability, and postprandial glucose response in healthy subjects (CIOFFI et al., 2016). Beside gluten-containing pasta, a novel gluten-free pasta (GFP) was specifi cally made and subsequently evaluated within the same participant group. Thus, this pilot study aimed to show the postprandial effect of this artisanal GFP on palatability, appetite sensation, and glucose metabolism in comparison with artisanal gluten-containing pasta. In addition, pre- and postprandial energy expenditure over 3 hours was measured by indirect calorimetry.
1. Materials and methods
Eight healthy volunteers (4 men and 4 women), aged 25–65 years and body mass index (BMI) of 20–27 kg m–2, were recruited at the Internal Medicine and Clinical Nutrition Unit, Federico II University Hospital, in Naples (Italy). Exclusion criteria were: known chronic illnesses, diabetes, hypertension, hyperlipidemia, smoking, athletic physical activity, daily use of prescription medication, use of dietary supplements, allergies or food intolerances, or dislikes of relevance to the composition of meals.
Two different iso-caloric lunch meals were tested in all participants, who underwent one test day per week. As previously described (CIOFFI et al., 2016), on the day before the test day, subjects were instructed to follow a standardized fasting procedure from 10 p.m. On the test day, participants were not allowed to smoke, and they were asked to consume a standardized breakfast meal at home (8.00 a.m.) within 10–12 min, which consisted of 200 ml of semi- skimmed milk and 25 g of cornfl akes (766 kJ; 18% protein, 65% carbohydrate and 16% fat).
At their arrival at the department around 11.00 a.m., they underwent anthropometrics measurement (body weight, height, and BMI) only at the screening visit. Firstly, resting energy expenditure (REE) was measured, then baseline blood sample was taken, and subjective appetite sensation was assessed by Visual Analogue Scale (VAS) questionnaire (time point 0’) (FLINT et al., 2000). Meals were served with 250 ml of water and consumed within 15 min; hereafter the subjective palatabilitywas assessed by VAS (FLINT et al., 2000).
Afterwards, postprandial energy expenditure (EE) by indirect calorimetry was measured for 3 hours consecutively. Blood samples and appetite sensation were measured every hour for a total of 4 hours (time points 60, 120, 180, and 240 min). Questionnaires for assessing appetite and palatability as well as EE were previously described (CIOFFI et al., 2016). All participants provided written informed consent prior to enrolment and the protocol was conducted according to the Declaration of Helsinki and approved by the Local Ethical Committee of Federico II University.
1.1. Meal test composition
Gluten free pasta (GFP) was made by a mixture of rice (50%) and corn (50%) fl ours and prepared by the same pasta making process required for gluten-containing pasta. Refi ned wheat pasta (RP) used for the current project is classifi ed as PGI (Protected Geographical Indication) according to the European Council Regulation No 510/2006 (EC, 2006), as previously described (CIOFFI et al., 2016). Briefl y, PGI requirements are as follows: the dough extrusion must be done through bronze dies and pasta drying must be accomplished at a temperature between 40 °C and 80 °C and for 6 to 60 hours. (MIPAAFT, 2018)
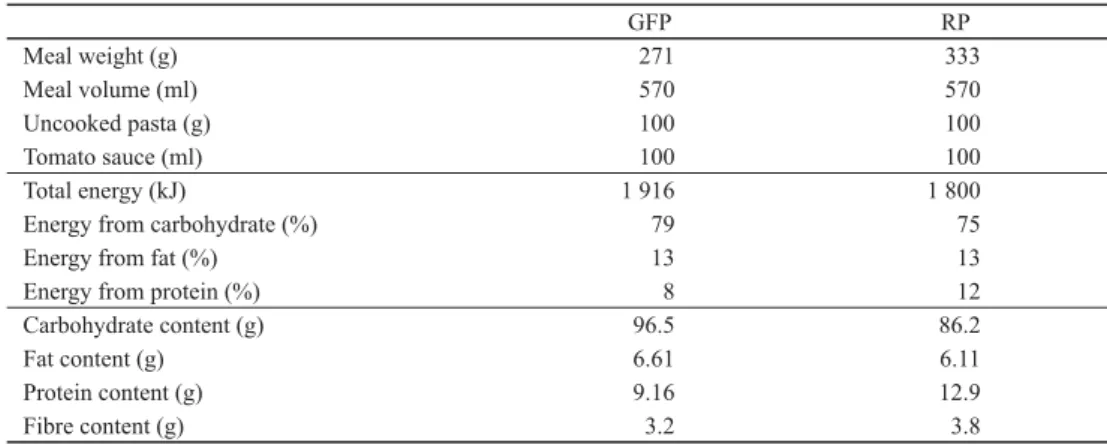
Meals were prepared at the kitchen laboratory of the Department of Clinical Medicine and Surgery, Federico II University and consisted of: 1) 100 g of GFP and 2) 100 g of RP, both dressed with 100 ml of tomato sauce as shown in Table 1. The shape was short spaghetti;
GFP and RP pasta were boiled in salted water (7 g NaCl/l) for 6 min and 7 min, respectively.
Tomato based sauces were prepared, frozen, and delivered to the kitchen laboratory in Naples, as previously reported (CIOFFI et al., 2016). All food products were provided by the Italian pasta company “La Fabbrica della Pasta di Gragnano”, Gragnano, Naples, Italy.
Table 1. Characteristics of gluten free pasta (GFP) and refi ned wheat pasta (RP) meals
GFP RP
Meal weight (g) 271 333
Meal volume (ml) 570 570
Uncooked pasta (g) 100 100
Tomato sauce (ml) 100 100
Total energy (kJ) 1 916 1 800
Energy from carbohydrate (%) 79 75
Energy from fat (%) 13 13
Energy from protein (%) 8 12
Carbohydrate content (g) 96.5 86.2
Fat content (g) 6.61 6.11
Protein content (g) 9.16 12.9
Fibre content (g) 3.2 3.8
1.2. Blood samples analysis
Blood samples were immediately centrifuged, and serum aliquots were stored at –80 °C until the analysis. Glucose and triglyceride concentrations were measured by automated methods (ABX Pentra 400, HORIBA ABX – Rome, Italy) within the following ranges: 0.1–8.3 mmol l–1, 0.08–4.57 mmol l–1, respectively. Insulin and c-peptide serum concentrations were measured by ELISA kits (Diasource Immunoassays S.A. – Louvain la Neuve, Belgium) and automatic ELISA Triturus analyzer (Biomedical Diagnostics – Antwerpen, Belgium) within these ranges: 0.17–250 μUI/ml and 0.01–4.9 pmol ml–1, respectively. Finally, for glucose, triglycerides, insulin, and c-peptide the coeffi cient of variation (CV) were 0.6%, 1.7%, 5.1%, and 4.8%, respectively; whereas, the limits of detection were 0.1 mmol l–1, 0.08 mmol l–1, 0.17 μUI/ml, and 0.01 pmol ml–1.
1.3. Sample size calculation and statistical analysis
Based on fi ndings of FLINT and co-workers (2000), a difference of 10 mm in VAS score would be detected with α=0.05 and a power of 80% using 8 or less subjects over a 4.5-hour test meal by using paired design. Data are shown as means ± standard deviation (SD), unless otherwise stated. The incremental area under the curve (iAUC) was calculated as the net increment/
decrement area above/below baseline value and AUC as the total area under the curve using the trapezoid model. All dependent variables were controlled for normal distribution by Shapiro–Wilk test, and if it was skewed, the variable was log-transformed prior to analyses.
Within and between effects over time in both groups were tested by two-way repeated measure ANOVA and the statistical signifi cance level is defi ned as P<0.05. All analyses were performed using SPSS version 18.0, SPSS Inc., Chicago, IL.
2. Results and discussion
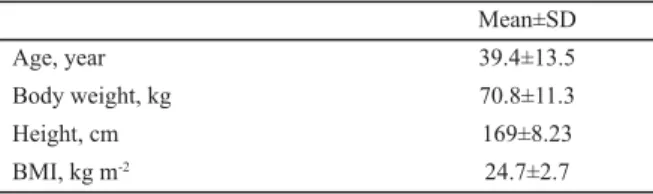
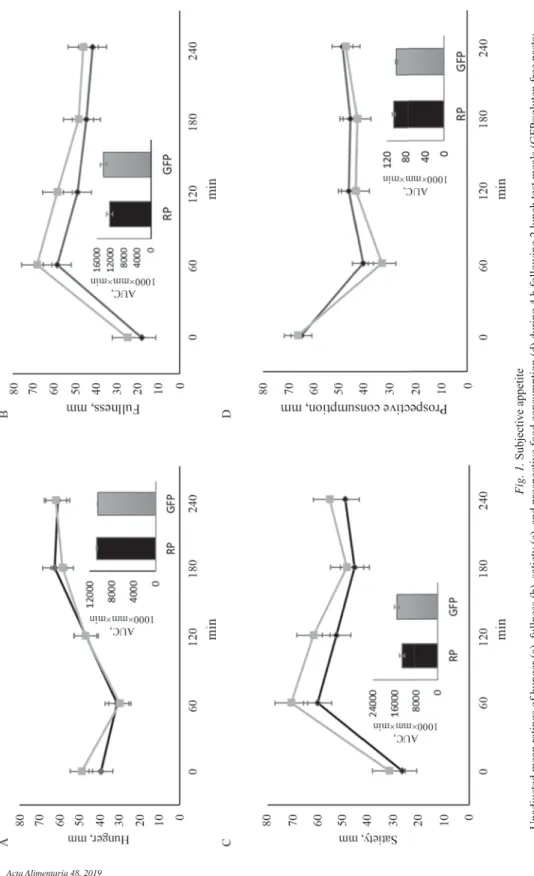
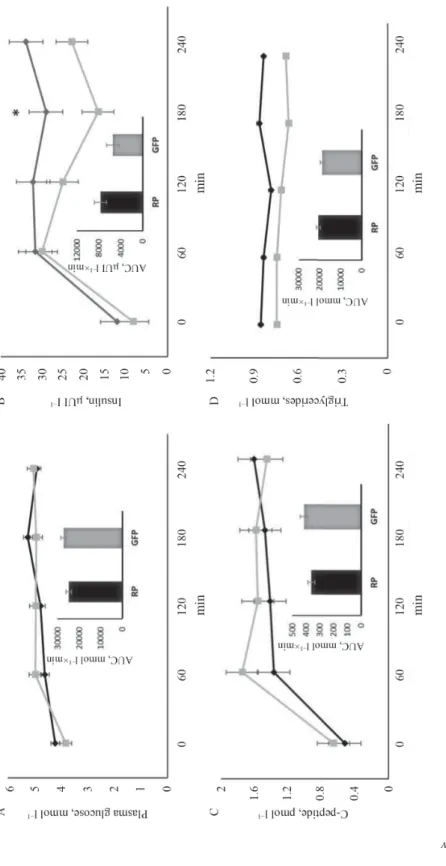
All subjects completed the RP test meal and 7 completed the GFP test meal. Age and anthropometric data of volunteers are presented in Table 2. To avoid any confounding factor on appetite sensation, pasta meals had the same volume (~570 ml). No difference was observed for subjective palatability scores, except for off taste (GFP=10±6 mm; RP=28±28 mm) and overall pleasantness (GFP=9±7 mm; RP=23±17 mm) that were both higher, albeit not signifi cantly, for RP meal. Appetite ratings with the corresponding AUCs are shown in Figure 1 without reporting any differences between meals. Postprandial glucose, insulin, c-peptide, and triglycerides responses and their corresponding AUCs are shown in Figure 2.
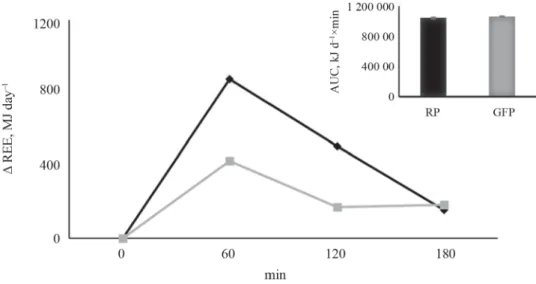
Overall, glucose response, c-peptide, and triglycerides were not signifi cantly affected by meals; while post-hoc pairwise analysis showed that insulin response was lower at time point 180 (P<0.01) for GFP compared to RP. The AUCs for glucose, insulin, c-peptide, and triglycerides were not signifi cantly different between meals (P=0.26; P=0.14; P=0.53, and P=0.58, respectively). Finally, postprandial EE increased for both meals (Fig. 3), and repeated measures showed that postprandial EE was affected by time (P<0.01) but not by meals (P=0.9). Post hoc analysis revealed that EE for GFP was lower than EE for RP at time point 60 min (P=0.01), while AUC was not different between meals.
Table 2. Characteristics of 8 healthy volunteers Mean±SD
Age, year 39.4±13.5
Body weight, kg 70.8±11.3
Height, cm 169±8.23
BMI, kg m-2 24.7±2.7
BMI= body mass index; SD=standard deviation
Thus, this study examined the postprandial effects of GFP on subjective palatability, appetite, and glucose metabolism in healthy people. Our preliminary fi ndings showed that GFP did not affect perceived satiety and palatability as well as postprandial glucose metabolism compared to RP.
Fig. 1. Subjective appetite Unadjusted mean ratings of hunger (a), fullness (b), satiety (c), and prospective food consumption (d) during 4 h following 2 lunch test meals (GFP=gluten free pasta; RP=refi ned wheat pasta) and the corresponding area under the curve (AUC) expressed as mean ± standard error (SE) (n=7). : RP; : GFP
Fig. 2. Metabolic response ls (GFP= gluten free pasta; RP=refi ned wheat pasta) and the corresponding area under the curve (AUC) expressed as mean ± standard error (SE) (n=7). * P< 0.01 : RP; : GFP
Fig. 3. Energy expenditure
Postprandial energy expenditure expressed as delta value (kJ day–1) during the 3 h following 2 lunch test meals (GFP= gluten free pasta; RP=refi ned wheat pasta) and corresponding area under the curve (AUC) expressed as
mean ± standard error (SE) (n=7). * P<0.01 : RP; : GFP
There is evidence, so far, that GFP is one of the most challenging products to formulate and produce, especially in terms of texture and cooking quality, since gluten is the architectural key (MARTI & PAGANI, 2013). Both raw materials and processing conditions can play an essential role in determining the nutritional and sensory quality of pasta (MARIOTTI et al., 2011; LUCISANO et al., 2012; MARTI & PAGANI, 2013). Although we found that palatability was substantially in favour of RP; our data suggest that GFP seems to infl uence appetite sensation in the same way as pasta containing gluten. Similar results on appetite ratings were shown by BERTI and co-workers (2004). In detail, the authors compared different products such as bread, GF bread, GF pasta, and quinoa in 7 healthy subjects, showing that appetite sensation (reported as the difference of the rating expressed before and after the consumption of the meal) was not signifi cantly affected by the different products. Interestingly, they also reported that GF pasta was the most palatable food among those tested; however, no direct comparison was made between gluten-containing pasta and GF pasta, as we did.
As concerns the effect of the products tested on glycaemic response, our results suggest that GFP did not impair postprandial glycaemia in comparison with RP, in accordance with previous results. BACCHETTI and co-workers (2014) found lower values of GI in pasta containing a mixture of rice and corn fl ours compared to rice fl our only as the main ingredient, either in healthy and celiac subjects. Similarly, SCAZZINA and co-workers (2015) showed that GI values of GFP ranged from low (<55 for dry pasta) to medium GI (56–69 for fresh pasta) in healthy volunteers; hypothesizing a good optimization of production process. On the contrary, JOHNSTON and co-workers (2017) reported higher postprandial glycaemia for GF pasta composed of rice and corn fl ours compared to wheat pasta in healthy subjects.
Differences in glycaemic response could be ascribed to the different formulations and the food processing procedures used in the manufacturing of gluten-free products, which may
affect starch digestibility (MERAYO et al., 2011; MARTI & PAGANI, 2013). Since pasta investigated in our works is a PGI pasta (CIOFFI et al. 2016), it is likely that some properties related to the processing cycle, such as drying temperature required for artisanal pasta production, could positively improve both the sensory and nutritional quality of this pasta compared to industrial pasta (MARIOTTI et al., 2011). Finally, no signifi cant results were observed for REE, since it is likely that the small difference in the amount of carbohydrates between meals was not adequate to modulate post-prandial EE (VAN BAAK, 2008).
There are some limitations in this study. First and most important, the small sample size, and some weakness within study design, such as late sampling points after meal, could have prevented us from showing signifi cant results. Secondly, meals were not matched for carbohydrate content as shown in Table 1, and the absence of any information on starch morphology may be regarded as further study limitation. However, our strengths include that the number of subjects needed for studies assessing appetite can be reduced considerably by using paired designs, therefore it is possible to detect a difference in VAS (FLINT et al., 2000) by enrolling 8 subjects only. Additionally, meals were matched for volume for studying subjective appetite.
3. Conclusions
This pilot study showed that this artisanal GFP was perceived as palatable as the gluten- counterpart, without affecting subjective appetite or postprandial glycaemia compared to RP in healthy volunteers. Clearly, GFP results on palatability and glycaemia are preliminary and need to be confi rmed in larger studies.
*
The authors gratefully acknowledge all participants enrolled in the study, “La Fabbrica della Pasta s.r.l.” that provided the pasta and POR CAMPANIA FSE 2007/2013, Project Carina funded the PhD grant to Dr Iolanda Cioffi . The authors declare that they have no competing interests.
References
BACCHETTI, T., SATURNI, L., TURCO, I. & FERRETTI, G. (2014): The postprandial glucose response to some varieties of commercially available gluten-free pasta: A comparison between healthy and celiac subjects. Food Funct., 5, 3014–3017.
BASCUÑÁN, K.A., VESPA, M.C. & ARAYA, M. (2017): Celiac disease: understanding the gluten-free diet. Eur. J. Nutr., 56, 449–459.
BERTI, C., RISO, P., MONTI, L.D. & PORRINI, M. (2004): In vitro starch digestibility and in vivo glucose response of gluten-free foods and their gluten counterparts. Eur. J. Nutr., 43, 198–204.
BJÖRCK, I., GRANFELDT, Y., LILJEBERG, H., TOVAR, J. & ASP, N.G. (1994): Food properties affecting the digestion and absorption of carbohydrates. Am. J. Clin. Nutr., 59, 699S–705S.
CIOFFI, I., SANTARPIA, L., VACCARO, A., IACONE, R., LABRUNA, G., MARRA, M., CONTALDO F., KRISTENSEN M. & PASANISI
F. (2016): Whole-grain pasta reduces appetite and meal-induced thermogenesis acutely: A pilot study. Appl.
Physiol. Nutr. Me., 41, 277–283.
DO NASCIMENTO, A.B., FIATES, G.M., DOS ANJOS, A. & TEIXEIRA, E. (2013): Analysis of ingredient lists of commercially available gluten-free and gluten-containing food products using the text mining technique. Int. J. Food Sci.
Nutr., 64, 217–222.
EC (2006): European Council Regulation (EC) No 510/2006 of 20 March 2006 on the protection of geographical indications and designations of origin for agricultural products and foodstuffs.
FLINT, A., RABEN, A., BLUNDELL, J.E. & ASTRUP, A. (2000): Reproducibility, power and validity of visual analogue scales in assessment of appetite sensations in single test meal studies. Int. J. Obes., 24, 38–48.
FOSTER-POWELL, K., HOLT, S.H. & BRAND-MILLER, J.C. (2002): International table of glycemic index and glycemic load values: 2002. Am. J. Clin. Nutr., 76, 5–56.
JOHNSTON C.S., SNYDER D. & SMITH, C. (2017): Commercially available gluten-free pastas elevate postprandial glycemia in comparison to conventional wheat pasta in healthy adults: a double-blind randomized crossover trial. Food Funct., 8, 3139–3144.
LUCISANO, M., CAPPA, C., FONGARO, L. & MARIOTTI, M. (2012): Characterisation of gluten-free pasta through conventional and innovative methods: evaluation of the cooking behaviour. J. Cereal Sci., 56, 667–675.
MARIOTTI, M., IAMETTI, S., CAPPA, C., RASMUSSEN, P. & LUCISANO, M. (2011): Characterisation of gluten-free pasta through conventional and innovative methods: Evaluation of the uncooked products, J. Cereal Sci., 53, 319–
327.
MARTI, A. & PAGANI, M.A. (2013): What can play the role of gluten in gluten free pasta? Trends Food Sci. Tech., 31(1), 63-71.
MERAYO, Y.A., GONZALEZ, R.J., DRAGO, S.R., TORRES, R.L. & DE GREEF, D.M. (2011): Extrusion conditions and zea mays endosperm hardness affecting gluten-free spaghetti quality. Int. J. Food Sci. Tech., 46, 2321–2328.
MIPAAFT (2018): Disciplinari di produzione prodotti DOP e IGP riconosciuti. www.politicheagricole.it/fl ex/cm/
pages/ServeBLOB.php/L/IT/IDPagina/3348. Last accessed: 02. Dec. 2018)
SCAZZINA, F., DALL’ASTA, M., PELLEGRINI, N. & BRIGHENTI, F. (2015): Glycaemic index of some commercial gluten- free foods. Eur. J. Nutr., 54, 1021–1026.
THOMPSON, T. (2009): The nutritional quality of gluten-free foods. -in: GALLAGHER, E. (Ed.) Gluten-free food science and technology. Wiley, Oxford, pp. 42–51.
VAN BAAK, M.A. (2008): Meal-induced activation of the sympathetic nervous system and its cardiovascular and thermogenic effects in man. Physiol. Behav., 94, 178–186.
WIKAREK, T., CHUDEK, J., OWCZAREK, A. & OLSZANECKA-GLINIANOWICZ, M. (2014): Effect of dietary macronutrients on postprandial incretin hormone release and satiety in obese and normal-weight women. Br. J. Nutr., 111, 236–246.
WU, J.H., NEAL, B., TREVENA, H., CRINO, M., STUART-SMITH, W., FAULKNER-HOGG, K., YU LOUIE, J.C. & DUNFORD, E.
(2015): Are gluten-free foods healthier than non-gluten-free foods? An evaluation of supermarket products in Australia. Br. J. Nutr., 114, 448–454.