Research report
Barriers for progress in salt reduction in the general population. An international study
q,qqR.S. Newson
a, I. Elmadfa
b, Gy. Biro
c, Y. Cheng
d, V. Prakash
e, P. Rust
f, M. Barna
c, R. Lion
a, G.W. Meijer
a, N. Neufingerl
a, I. Szabolcs
c, R. van Zweden
a, Y. Yang
g, G.I.J. Feunekes
a,⇑aUnilever Research & Development, Vlaardingen, The Netherlands
bInstitute of Nutritional Sciences, University of Vienna, Austria
cFaculty of Health Sciences, Semmelweis University, Hungary
dDepartment of Nutritional Sciences, Chinese Nutrition Society, China
eCouncil of Scientific & Industrial Research (CSIR) and JSS MVP, India
fDepartment of Nutrition Sciences, University of Vienna, Austria
gNational Institute of Nutrition and Food Safety, Chinese Center for Disease Control and Prevention, China
a r t i c l e i n f o
Article history:
Received 15 March 2013
Received in revised form 2 July 2013 Accepted 15 July 2013
Available online 23 July 2013
Keywords:
Salt Salt reduction Public health Behaviour change Population-based health International
a b s t r a c t
Salt reduction is important for reducing hypertension and the risk of cardiovascular events, nevertheless worldwide salt intakes are above recommendations. Consequently strategies to reduce intake are required, however these require an understanding of salt intake behaviours to be effective. As limited information is available on this, an international study was conducted to derive knowledge on salt intake and associated behaviours in the general population. An online cohort was recruited consisting of a rep- resentative sample from Germany, Austria, United States of America, Hungary, India, China, South Africa, and Brazil (n= 6987; aged 18–65 years; age and gender stratified). Participants completed a comprehen- sive web-based questionnaire on salt intake and associated behaviours. While salt reduction was seen to be healthy and important, over one third of participants were not interested in salt reduction and the majority were unaware of recommendations. Salt intake was largely underestimated and people were unaware of the main dietary sources of salt. Participants saw themselves as mainly responsible for their salt intake, but also acknowledged the roles of others. Additionally, they wanted to learn more about why salt was bad for health and what the main sources in the diet were. As such, strategies to reduce salt intake must raise interest in engaging in salt reduction through improving understanding of intake levels and dietary sources of salt. Moreover, while some aspects of salt reduction can be globally implemented, local tailoring is required to match level of interest in salt reduction. These findings provide unique insights into issues surrounding salt reduction and should be used to develop effective salt reduction strategies and/or policies.
Ó2013 The Authors. Published by Elsevier Ltd. All rights reserved.
Introduction
Elevated dietary salt intake is an established risk factor for high blood pressure (Sacks et al., 2001; Hypertension Prevention Trial Research Group, 1990), and salt reduction has consistently been shown to reduce cardiovascular events (Cook et al., 2007;
Strazzullo, D’Elia, & Cappuccio, 2009; He & MacGregor, 2011;
He, Li, & MacGregor, 2013). Consequently, the World Health Organization issued a public health recommendation of a maxi- mum intake for adults of 5 grams per day (WHO, 2012). How- ever, a review of international salt intakes reveals that most countries have intakes well above this level (Elliott & Brown, 2007). Disturbingly this problem pertains to both adults and chil- dren, and is present in both developing and developed countries (Gregory et al., 2000; Strazzullo, D’Elia, & Cappuccio, 2009). Given 0195-6663/$ - see front matterÓ2013 The Authors. Published by Elsevier Ltd. All rights reserved.
http://dx.doi.org/10.1016/j.appet.2013.07.003
qThis is an open-access article distributed under the terms of the Creative Commons Attribution-NonCommercial-No Derivative Works License, which per- mits non-commercial use, distribution, and reproduction in any medium, provided the original author and source are credited.
qqAcknowledgements:We would like to thank the participants for their time and effort and everyone involved in the data collection process, particularly the International Union of Nutrition Sciences, Ben de Boer and the Unilever country nutritionists.Competing interest and financial disclosure:R.S.N., R.L., G.W.M., N.N. &
R.vZ., G.I.J.F. are employees of Unilever R&D. Unilever produces foods of which some are marketed to fit in a healthy diet and lifestyle. The other authors have no disclosures to make. All authors have been involved in the design of the study, drafting or revising of the manuscript for intellectual content and approved the final version to be published.
⇑Corresponding author.
E-mail address:gerda.feunekes@unilever.com(G.I.J. Feunekes).
Contents lists available atScienceDirect
Appetite
j o u r n a l h o m e p a g e : w w w . e l s e v i e r . c o m / l o c a t e / a p p e t
these circumstances, and the negative health effects of salt, a substantial reduction in salt intake at population level would play a significant role in the reduction of cardiovascular disease worldwide. Local scale interventions have successfully reduced salt intake (Kaczorowski et al., 2010; Sacks et al., 2001). However, implementing global salt reduction programmes would be more effective (Webster, Dunford, Hawkes, & Neal, 2011; Appel et al., 2011; Murray, Lauer, & Hutubessy, 2005) and contribute substantial to healthcare cost savings (Barton, Andronis, Briggs, McPherson, & Capewell, 2011).
Interventions that are targeted and based on reliable and valid scientific evidence are more likely to achieve sustained changes (Prochaska & Velicer, 1997). Motivating individuals in the general population to reduce their salt intake, and especially engaging them in sustained behaviour change, is difficult and complex. A solid understanding of behaviour in the general pop- ulation concerning the willingness to change are therefore important for developing targeted research and successful salt reduction initiatives. Unfortunately, whilst considerable evidence exists documenting the negative health impact of salt, the understanding of behaviours surrounding salt intake, and how to sustainably change these behaviours, is not as abundant. A handful of studies based either on qualitative data (Smith et al., 2006; Bentley, De Jong, Moser, & Peden, 2005), experimen- tal data (Liem, Miremadi, & Keast, 2012), or quantitative data from single countries (Grimes, Riddell, & Nowson, 2009; Kim, Lopetcharat, & Drake, 2012) highlight that attitudes, knowledge of salt intake, and health beliefs are important for changing salt intake habits, particularly as salt intake is hard to estimate and monitor. However, a better understanding is required to develop interventions, which can be implemented on a population-wide scale, that focus on the barriers and motivators to change.
Evaluating behaviour at population-level is particularly impor- tant for determining general trends and enhances the capacity to understand the population from all ages and backgrounds.
Furthermore, using quantitative data will enhance quality of cross-country comparisons, and provide more solid evidence of the current situation with respect to salt usage and readiness of the consumer to reduce salt intake. Moreover, due to wide varieties in food cultures and preferences around the world, an understanding is required of where differences between coun- tries exist, particularly between developed and developing countries.
Providing a clearer picture of population-based perceptions regarding salt and levels of intake, identifying drivers of salt intake, understanding how people use salt, and learning the best methods of communication regarding reducing salt intake is vital for improving the current situation in the general population in vari- ous countries. In light of this, an international study was conducted in seven countries to discover where the best opportunities exist to create targeted salt reduction strategies in both developed and developing countries. In some of these countries, such as Brazil, China and the USA, salt-reduction initiatives in selected regions have been instigated (Webster et al., 2011). Self-rated intake and calculated salt intake, sources of salt, interest in salt reduction, knowledge of salt intake recommendations, perceived healthiness and importance of reduction, responsibility for change and com- munication preferences were evaluated. This study is unique in that it combines salt-intake information with information on atti- tudes towards salt, a theoretical framework on behaviour change, and explores the communication preferences to provide concrete insights into where the most promising behaviour change can be made in country-specific populations. The findings from this inter- national study can be used to inform global strategies for salt reduction.
Materials and methods Design and procedure
The study consisted of an online cohort conducted in the fol- lowing countries: Germany, Austria, United States of America, Hungary, India, China, Brazil, and South Africa. Data was collected during April to May 2012 using an online questionnaire which took approximately 15 min to complete. This was completed using the participants own computer in their own setting. The questionnaire had to be completed in one sitting and prompting was provided on incomplete answers to reduce the occurrence of missing data.
Participants were recruited through an international online panel provider (GMI), who was registered with the Data Protection Act.
Informed consent was provided by all participants and they re- ceived a minor standard reimbursement for their time.
Participants
A recruitment target was set for each country cohort for a sam- ple size of approximately 1000 adults aged 18–65 (with the excep- tion of Germany and Austria where 500 participants were recruited per country, and combined into one group due to cultural and geo- graphical similarity). The online participant panels in the seven countries had population representative samples. Due to the different population structures in each country recruitment was stratified for each country across gender and within age blocks (18–24 year, 25–34 year, 35–44 year, 45–54 year, 55–65 year) to enable cross-country comparability. To ensure the ability to com- plete the online questionnaire the following inclusion criteria were applied: internet access with current email address, computer proficiency and normal vision (or corrected-to-normal). Further, people who had experienced a major health event (e.g., heart at- tack, stroke, cancer, and kidney disease), or were on a medically prescribed diet, were not allowed to participate due to their differ- ing reasons for changing their nutrition behaviour than the general population. Additionally, participants were required to be fluent in the official language of their country as this is the language in which the questionnaire was provided (in India and South Africa where there are multiple official languages the questionnaire was provided in English). In total 8833 participants from the panels met the aforementioned criteria for recruitment and were invited to participate. Of these 6987 participants participated in the study and completed the questionnaire to the end (participation rate of 78.7%). The mean age of the final sample was 39.7 years (SD = 13.5; no significant country differences on mean age, p> .05), and consisted of 50% females. Missing data in the final sample was less than 1% and only found amongst socio-demo- graphic variables. As such, missing data was excluded casewise for each analysis.
Materials
A self report questionnaire was developed with questions that were chosen to elicit information that can readily be implemented in a population wide salt reduction strategy. As such we evaluated socio-demographics, perceived and calculated levels and sources of salt intake, stages of change in regards to salt reduction, character- istics of salt usage, knowledge of recommendations, beliefs and attitudes, responsibility for salt reduction, and preferred methods of communication about salt and salt reduction. One standard framework questionnaire was designed, which was then adapted to local foods, serving sizes and culture by local nutritionists. When a language other than English was used, this was then translated
into the local language and back translated into English to check for the accuracy of translations. The order of presentation of the questions within the central food and behaviour sections were ran- domised to reduce presentation bias.
Socio-demographics
Marital status was recorded as: single/married/co-habiting/sep- arated/divorced/widowed. Smoking was defined as: never smoker/
former smoker/current smoker. Hypertension and iodine defi- ciency were documented in response to the question: ‘‘have you ever been diagnosed with one of these conditions by a doctor or other medical specialist?’’ Self rated health was assessed with the question: ‘How is your general health compared to people your own age?’ Scores were: 1 – very good to 5 – much worse. Height (m) and weight (kg) were self-reported, and Body Mass Index was calculated as kg/m2.
Self-rated and calculated level of salt intake
In order to achieve behaviour change, people need to be aware of their own behaviours. Often people will agree that a behaviour is unhealthy, but do not perceive that they themselves perform the unhealthy behaviour. Awareness of current behaviours is impor- tant for successful behaviour change interventions (Brug & Kok, 1995). Therefore, to gain an understanding of how well people understood their own level of salt intake we measured their self- rated intake and compared this to their calculated level of salt intake.
Self-rated intakewas determined by asking: how much salt do you think you currently consume in one day? Answer options in- cluded: too little/satisfactory/too much.
Calculated intakewas evaluated with a semi-quantitative food frequency questionnaire (Salt FFQ). In the absence of other suitable validated questionnaires, this was developed specifically for this multi-national study to calculate salt intake. This methodology was deemed most appropriate for a population-based sample, with data collected over an internet questionnaire. The Salt FFQ incorpo- rated salt intake derived from In Home Foods (i.e., salt derived from salt containing food groups, salt added during food prepara- tion, and salt added at the table) and Out of Home Foods (i.e. res- taurant food, take away, and street food). Discretionary salt is often not included in traditional food frequency questionnaires due to difficulty of measurement, but is an important source of salt in the daily diet. The questionnaire was designed to relatively rank people in terms of salt intake within each country, rather than to calculate the precise intake in grams, given the difficulties of quan- tifying discretionary salt intake and the different sources of salt in the diet per country.
Salt intake from In Home Foodswas calculated from the follow- ing three groups:
Salt intake from salt containing food groups was calculated based on the reported consumption of 12 food groups which are known in combination to contribute to at least 80% of salt intake from foods within each country (i.e., seasonings, condi- ments/dips/sauces, margarine/butter, savoury snacks, sweet snacks, processed meats, cheese, soups, breakfast cereals, breads, pickled vegetables (e.g., sauerkraut) and processed veg- etables (e.g., canned vegetables or mixes with sauces)). Each food group was illustrated with local examples. These foods include those that are manufactured with traditional or modern methods, and can be purchased from small or large retailers.
This does not include foods that are prepared at home, as this is captured in the following category. These food groups were selected based on local information and nutrition surveys and recommended by a nutritionist who was resident and working in each country. The frequency of consumption of each item
over a typical 7-day period was recorded; intake was quantified by using typical local serving sizes that were mentioned for each item in the FFQ. The amount of salt from salt rich foods was then calculated from the frequency of consumption multi- plied by the average salt content of the foods in a food group.
Salt content per serving size was taken from country food con- sumption tables. In South Africa and Brazil, where the tables were incomplete, this information was supplemented from local studies and/or or local product labelling. In India where no food composition tables were available the information was taken from local studies, websites and food product labelling.
Discretionary salt intake during food preparation was calcu- lated in a two-step process. First, participants reported the fre- quency by recording which meals they usually added salt to during cooking (breakfast, mid-morning snack, lunch, mid- afternoon snack, dinner, and after dinner snack), and how often they did this (every time/more than half of the time/half of the time/less than half of the time/never). Second, they indicated how much salt they added on average per time (none/1–2 pinches/a few pinches/½ teaspoon/1 teaspoon/1½ teaspoons/2 teaspoons/1 tablespoon/2 tablespoons/more than 2 tablespoons – which was converted into the related salt level in grams). The frequency was then multiplied by the ‘amount of salt added during cooking’. If participants reported that they usually cook for more people, the amount of salt added during cooking was divided by the number of people they usually cook for. For par- ticipants that did not cook for themselves, their salt intake from cooking was estimated by imputing the mean salt intake from cooking from people of the same country, age and gender. If use of a low-sodium salt was reported, calculated salt intake was adjusted based on the sodium content of local low-sodium salts.
Discretionary salt intake after preparation (e.g., at the table) was calculated in the same two-step process as above, only by asking participants about when they added salt after meal prep- aration. This was asked to all people irrespective of whether they cooked for themselves, and adjustments were made if use of low-sodium salt was reported.
Salt intake from Out of Home Foodswas calculated as the fre- quency of consumption of restaurant, take away or street food meals over a 7 day period. To illustrate this category the most common type of restaurant, take away and street foods were provided per country. The average amount of salt for these food categories was then derived from average reported salt levels for the meals in the countries based on information from lead- ing restaurants and chains. The amount of dietary salt intake from restaurant, take away and street foods was then calculated from the frequency of consumption multiplied by the average salt content of the foods.
Total salt intake was then calculated as the sum of the above sources. Within each country, according to their total calculated salt intake, participants were partitioned into tertiles to repre- sent the 33% of respondents with the lowest, medium and high- est salt intake.
Perceived and calculated sources of salt intake
To determine whether people could accurately identify what the main sources of salt in their diet were, participants were asked to select one option for what they perceived the main source of salt in their diet was from the following four sources: processed food/
restaurant, take away, street food/salt added at the table/salt added during food preparation. Per country, this was then com- pared to the actual calculated intake of salt from the same four sources, measured by the Salt FFQ, as described in the previous section.
Interest in reducing salt intake
Understanding the readiness of individuals to change is central to knowing where countries currently stand, and the potential for improvements. Therefore, based on the theoretical framework from the stages of change model (Prochaska & Velicer, 1997), we evaluated their interest in engaging in salt reduction (i.e. what behavioural stage of change they were in). Participants were asked to describe which statement best represented their current interest in salt reduction from the following options: ‘‘I am not at all inter- ested in lowering salt in my diet and I have no intention of doing so in the next 6 months’’/‘‘I am interested in lowering salt in my diet and I have the intention of doing that within the next 6 months’’/‘‘I am interested in lowering salt in my diet and I have the intention of doing that in the next month’’/‘‘I am interested in lowering salt in my diet and I have started lowering my salt intake during the last 6 months’’/‘‘I am interested in lowering salt in my diet and I have already lowered my salt intake for longer than 6 months’’.
Characteristics and behaviours surrounding salt reduction
If people do not know what the desired behaviour is it makes it difficult to change their current behaviour. As such it is important to understand the consumer’s knowledge of salt recommendations.
Consequently, participants were asked: ‘‘what is the maximum le- vel of salt per day that a healthy person is recommended to con- sume?’’ Answer options ranged from 0 to 100 g and also included the option ‘‘I don’t know’’. Discretionary salt is a significant con- tributor to salt intake, where a reduction could be useful. As such we asked participants: ‘‘do you add salt to your food before tasting it?’’ with the answer options of: usually or always/sometimes/
rarely or never. If people do not believe that changing their behav- iour is beneficial, it is unlikely that behaviour change will occur.
Accordingly it is important to determine what people believe about the effects of salt on health in different countries. Therefore, partic- ipants were asked to rate how strongly they agreed with a range of statements reflecting potential effects of salt (a mixture of true and false statements) from strongly disagree (1) to strongly agree (7).
The following beliefs were evaluated: Salt in my food. . .increases blood pressure/increases thirst/increases water retention/helps with my iodine intake/replace what is lost in sweat/improves the shelf life/increases weight/is important if you exercise/stimulates eating. A better understanding of the perceived healthiness and importance of salt reduction could provide important targets for effective interventions; as a result participants were asked to rate whether: ‘‘reducing salt is. . .’’ unhealthy (1) to healthy (7), and not at all important (1) to extremely important (7).
Responsibility for salt reduction
Salt reduction in the general population will require a combined effort between multiple players. Understanding how people per- ceive their own responsibility, and that of others, to reduce their salt intake is important for convincing them of the need to take ac- tion themselves. As such participants were asked to rate how responsible they thought specific people or organisations were for salt reduction using a scale from 1 (not at all responsible) to 7 (extremely responsible). The following people/organisations were rated: international organisations, country government, food manufacturers, business (e.g., supermarkets, local markets), res- taurants/fast food chains/caterers, friends–family, yourself.
Communication preferences
In order to deliver the most effective and useful communications about salt and salt reduction, it is important to know what people want to learn about salt and which communication channels they find the most appealing. First, participants were asked what they would like to hear more about. Participants were asked to select as many options from the following list: what foods are the main
sources of salt in the diet/the reasons why salt is bad for your health/how much salt you are currently eating/how to reduce salt in your diet/how to use less salt in cooking. Second, participants were asked from whom they would like to get information about salt and its impact on health. They were asked to select one from the following options: friends–family/companies that make food/
food packaging or label/government organisations/medical com- munity/places that sell food/restaurants; chefs. Third, participants were asked through whichsourcethey would prefer to obtain infor- mation about salt and its impact on health. They were asked to select one from the following options: television/magazines/news- papers/online-social websites/other/none of the above.
Statistical analyses
All analyses were conducted using PASW/SPSS version 18.0.
Country differences were evaluated using Chi-square or ANOVA’s as appropriate and evaluated at the level ofp< .05. When a signif- icant main effect for country was found, planned analyses were conducted between the mean or percentage from the total average for all countries to means and percentages from the individual countries to determine specifically where the significant differ- ences lay. These were also evaluated at a significance level of p< .05. Adjusting for age and gender did not change the main re- sults, thus to enhance ease of understanding non-adjusted analyses are presented.
Results
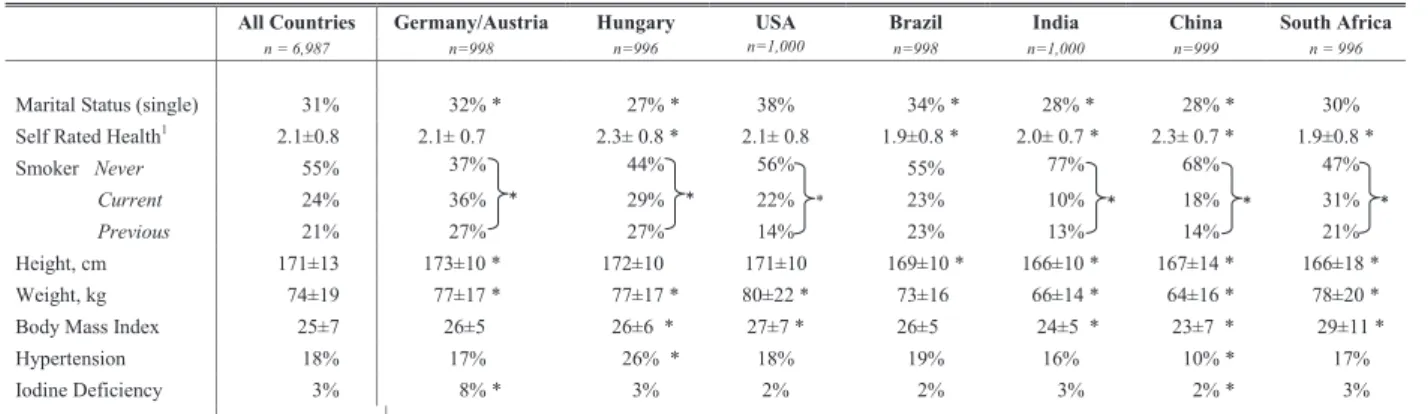
Characteristics of the samples per country are displayed in Table 1. Across all countries 30% of the population were single, which was slightly higher in Brazil (34%). Self-rated health amongst the population was high, with participants on average reporting that they were in ‘good’ health, when compared to other people their own age. Over half of the total sample reported that they had never smoked (55%). The percentage of current smokers was highest in Germany/Austria (36%) and lowest in India (10%). The average Body Mass Index (BMI) across countries was 25 kg/m2 (WHO classification of slight overweight), although in India and China the average BMI was in a normal range. Seventeen percent of the total group reported being diagnosed with hypertension, this rose from 10% in China to 26% in Hungary. Three percent of the total population reported having been diagnosed of iodine deficiency by a doctor in their lifetime, which was as high as 8% in Germany/Aus- tria, but much lower in the other countries (2–3%).
Self-rated and calculated level of salt intake
The Salt FFQ revealed that the average intake across all coun- tries was 9.5 grams per day, ranging across countries from 7 to 13 grams per day. Within each country participants were divided into tertiles based on their daily salt intake calculated from the Salt FFQ: low intake, medium intake and high intake. The average salt intake in the low intake tertile was 4 grams per day (range of 3–5 g across countries), the average in the medium tertile was 8 grams per day (range 6–12 g) and the average in the highest tertile was 17 grams per day (range 12–24 g). To gain an under- standing of how well consumers understood their own salt intake, this actual level of intake was then contrasted against what the consumers thought their intake was – too low, satisfactory or too high.Fig. 1shows this comparison. Notably, the vast majority of the sample in every country thought that their intake was ‘satisfac- tory’. In general, reports of ‘too little’ intake decreased across ascending tertiles of calculated intake, whilst reports of ‘too much’
intake increased across ascending tertiles of calculated intake.
Germany/Austria and China had a higher perception of too high in- take, whereas Brazil had a higher perception of too low an intake relative to other countries. Note that this figure does not contain a representation for ‘all countries’ as tertiles can only be calculated within, and not across, countries due to variations in food compo- sition tables and products available.
Perceived and calculated sources of salt intake
Based on the calculated salt intakes (Salt FFQ), the relative con- tribution of the four sources of total salt intake in the diet are pre- sented inTable 2. The Salt FFQ revealed that on average 83% of salt intake was derived from In Home Foods (51% of salt in the diet came from salt containing food groups, 25% was added during preparation and 7% was added at the table), whilst 17% came from Out of Home Foods. India deviated from this pattern, with salt added during preparation being the main contributing source of salt in the diet (48%). Furthermore, within Brazil it could be seen that the highest intake came from Out of Home foods, this was lar- gely due to consumption of pizza, and the high sodium levels seen in restaurant meals in Brazil. When participants were asked what
they thought the main source of salt in their diet were they re- ported that it was salt which was added during food preparation (42% across all countries). This was followed by salt from salt con- taining foods (30% across all countries), and then by salt added at the table, and salt from Out of Home foods (both sources reported by 14% across all countries). This pattern was evident in India, Chi- na, and Brazil, whereas in Germany/Austria, USA, Hungary and South Africa processed food was thought to be the main source of salt intake, and salt added during preparation was the second most rated main source of salt.
Interest in reducing salt intake
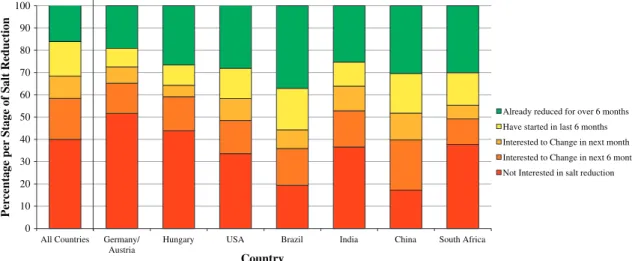
The behavioural stages of change for salt reduction is presented per country inFig. 2. There were significant country differences in terms of stages of change, with every country reporting a different profile (p< .001). Over one third of the total sample reported hav- ing no interest in changing their salt intake (34%). Whereas, 13%
had started to make changes in the last 6 months, and a further 28% indicated that they were interested and had already main- tained the changes they had made towards reducing salt intake Table 1
Population characteristics presented for all countries and per individual country.
Note:The population was age and gender stratified in the following age categories: 18–24, 25–24, 35–44, 45–54, 55–65, giving an average age of 39.7 years (SD = 13.5). All values presented are mean, ±SD, or percentage of total within country (%). All main effects for country were significantly different atp< .001. Planned comparisons were conducted to determine where the significant differences were for the main effect of country by comparing the total mean and percentages for ‘all countries’ versus each individual country using Chi-square test and ANOVA.
⁄Significant differencep< .05.
aResponse scale to items was: 1 = very good–7 = very bad.
0%
10%
20%
30%
40%
50%
60%
70%
80%
90%
100%
Low Medium High Low Medium High Low Medium High Low Medium High Low Medium High Low Medium High Low Medium High
Germany/ Austria Hungary USA Brazil India China South Africa
Too much Satisfactory Too little Self-Rated
Intake
Percentage of the Population
Calculated Intake (Salt FFQ)
Fig. 1.What people thought of their intake versus calculated salt intake per country.
for at least 6 months. Sixteen percent were interested in making a change in the next 6 months, and 8% were interested in change in the next month. Germany/Austria had the highest proportion of people with no interest in change, with over half of the participants not intending to make changes in the next 6 months (52%). China and Brazil had the most interest in change, with 83% and 81% of the Chinese and Brazilian samples respectively reporting interest in change, or an active change. In Brazil, 37% of the population had maintained salt reduction efforts for over 6 months, this was 30% in China and South Africa. There was a significant difference between countries on the stages of change and interest (Chi- square = 495.31,p< .001).
Characteristics and behaviours surrounding salt reduction
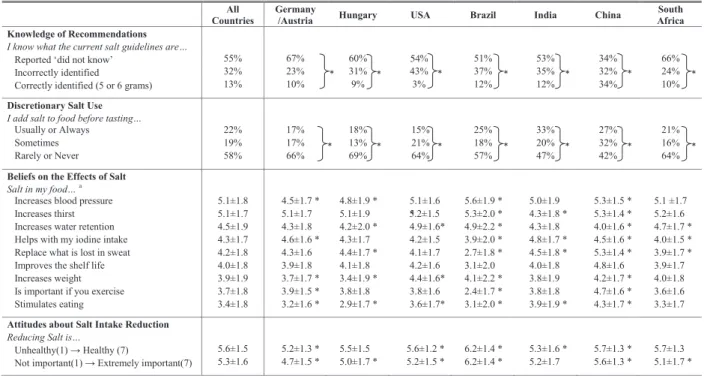
The knowledge of recommendations and discretionary salt use are shown inTable 3. In relation torecommendations more than half of the population (55%) indicated not to know what the daily salt intake recommendations are, and 32% reported that they did know, but reported incorrect recommendations. Only 13% of the total sample could correctly identify the salt intake recommenda- tions. In China, the recognition of recommendations was quite high, with 34% correctly identifying them. In the USA only 3% of the population could correctly identify the recommendations. Over two-thirds of the participants in Germany/Austria, USA and South Africa reported that they did not know the recommendations.
When looking at discretionary salt usage, 22% of the total par- ticipants reported adding salt to food ‘usually or always’ before
tasting it, whilst the majority (58%) reported that they ‘rarely’ or
‘never’ did this. This finding was consistent across countries.
Table 3displays thebeliefsabout the efficacy of salt reduction, and the perceived healthiness and importanceof salt reduction. In terms ofbeliefsregarding the effects of salt, in the total population, the most highly rated beliefs were that salt in food: increases blood pressure (mean rating of 5.1), increases thirst (5.0) and water retention (4.4), and helps with iodine intake (4.4). The countries varied greatly on their ratings for the beliefs in the effects of salt.
India, China, and Germany/Austria had a stronger focus on the ben- efits for iodine deficiency, whilst the other countries had more of a focus on blood pressure, and thirst. The belief that salt in food is important to replace what is lost in sweat was also of relative importance in countries (4.2), with the exception of Brazil and South Africa. When looking at theperceived healthiness and impor- tanceof salt reduction, the results showed that the population lar- gely thought that reducing salt intake is healthy (average rating of 5.6 on a scale from 1 – unhealthy to 7 – healthy) and of importance (average rating of 5.3 on a scale from 1 – not important to 7 – ex- tremely important). There was a strong positive association be- tween health and importance attitudes, (r= .63, p< .001). The ratings on both attitudes were significantly higher in Brazil and China compared with the average across countries. An exploratory analysis on the relation between thebeliefscales and theperceived healthiness and importance of salt reduction, was conducted to determine whether health and importance attitudes to salt reduc- tion were driven by beliefs in the efficacy of salt and salt reduction.
A linear regression analysis demonstrated that after controlling for Table 2
Calculated dietary sources of salta(average % of total salt intake).
All countries Germany/Austria Hungary USA Brazil India China South Africa
In Home Foods
Salt containing food groups 51 ± 23 63 ± 23* 56 ± 24* 70 ± 20* 36 ± 24* 32 ± 20* 48 ± 25* 72 ± 19*
Salt added at the table 7 ± 14 6 ± 12* 5 ± 11* 7 ± 13* 5 ± 11* 10 ± 18* 11 ± 19* 7 ± 12
Salt added during preparation 23 ± 23 17 ± 17* 23 ± 19* 9 ± 13* 18 ± 18* 48 ± 26* 27 ± 22* 16 ± 15* Out of Home Foods
Restaurants/take away/street foods 17 ± 15 14 ± 14* 15 ± 18* 13 ± 17* 41 ± 28* 10 ± 10* 14 ± 13* 5 ± 5* Note:All values presented are mean, ±SD, or percentage of total within country (%).
All main effects for country were significantly different atp< .001. Planned comparisons were conducted to determine where the significant differences were for the main effect of country by comparing the total mean and percentages for ‘all countries’ versus each individual country using Chi-square test and ANOVA.
a From the Salt FFQ, this is an indication of which percentages of salt intake came from which type of food or salt use.
*Significant differencep< .05.
0 10 20 30 40 50 60 70 80 90 100
All Countries Germany/
Austria
Hungary USA Brazil India China South Africa
Percentage per Stage of Salt Reduction
Country
Already reduced for over 6 months Have started in last 6 months Interested to Change in next month Interested to Change in next 6 months Not Interested in salt reduction
There was a significant difference across the 2= 495.3p < .001). Simple
planned analyses to determine where the significances lay were conducted between the overall distribution for all countries and the distribution per individual country showed significant differences between every country and the total distribution (p < .001).
Fig. 2.Stages of change: intention to reduce salt intake.
age and gender the nine beliefs together accounted for 15% and 16% of the variance in health attitudes and importance attitudes respectively (p< .001), indicating that these beliefs play an impor- tant role in attitudes towards salt reduction. Taste and Stage of Behaviour change were also important predictors of health atti- tudes (accounting for 8% of further variance) and importance atti- tudes (16% of further variance). Interestingly, age, gender, country, self-rated level of intake and calculated level of salt intake from the FFQ were not important drivers of attitude (3% and 5% combined respectively for health and importance attitudes). Interestingly the belief that salt reduction reduces blood pressure was the stron- gest predictor amongst the beliefs, accounting uniquely for 5% and 7% of the variance in health and importance attitudes respectively.
Responsibility for salt reduction
The level of responsibility that participants allocated to varying individuals and organisations for their own salt intake are pre- sented inFig. 3 (note: all countries are presented together, due to the high comparability in results across countries). This figure highlights that in the total sample, participants reported them- selves as being the most responsible for reducing salt intake (mean all country rating of 5.9). Other key players in salt reduction also acknowledged as being responsible were: food manufacturers (5.0), restaurants/fast food chains/caterers (4.7), supermarkets, local shops, markets (4.2), family and friends (4.1). This pattern was repeated in each country, with the exception of India, where Table 3
Characteristics and behaviours surrounding salt reduction.
Note:All values presented are mean, ±SD, or percentage of total within country (%).
All main effects for country were significantly different atp< .001. Planned comparisons were conducted to determine where the significant differences were for the main effect of country by comparing the total mean and percentages for ‘all countries’ versus each individual country using Chi-square test and ANOVA.
⁄Significant differencep< .05.
a Response scale to items was: 1 = strongly disagree to 7 = strongly agree.
Not at all Responsible ---Highly Responsible All responses significantly different at p < .001, with the exception of comparison of
family & friends to supermarkets, local shops, markets (p > .05)
1 2 3 4 5 6 7
Yourself Food manufacturers Restaurants/ fast food chains/ caterers Supermarkets/ local shops/ markets Family and friends Country government International organisations
Fig. 3.Mean self-reported responsibility for salt intake reduction across all countries.
industry and family/friends were equally rated in second place (individual country rating of 4.6). Overall, country governments (3.5) and international organisations (3.3) were rated the least responsible. This was consistent across all countries, with the exception of China, which rated country governments as more responsible (individual country rating of 5.1).
Communication preferences
Communication preferences regarding salt intake messages can be seen inTable 4. Participants were able to select more than one option regarding what they would like to hear about salt. Of the five options presented, half of the population rated each of the op- tions as of interest. ‘The reasons why salt is bad for your health’, and ‘what foods are the main sources of salt in the diet’ were the most popular items selected. Fourteen percent of the total sample did not find any of the options appealing. In the total sample, 35%
of participants reported that they would like to hear about salt, and its impact on health, from the medical community (e.g., dieticians, doctors), and 22% reported that they would like to hear this from food packaging or labels. The interest in these two sources in- creased significantly with age (p< .001), whilst interest in hearing from family and friends, restaurants, and places that sell food de- creased significantly with age (p< .001). This pattern was consis- tent across all countries. China additionally reported they would like to hear more from governmental organisations (20%). Televi- sion, online social websites (e.g., blogs, and discussions), and news- papers were the preferred mediums of communication across all
countries. Whilst there were no gender differences, interest in magazines and websites decreased with age, whilst interest in newspapers increased with age and interest in television peaked in the middle-age group.
Discussion
The current international study was conducted to discover the key challenges in reducing salt intake in both developing and developed countries. The insights gained can be used in targeted, evidence-based global salt reduction strategies. Specifically, per- ceptions regarding average levels of salt intake and the main sources of salt, what drives people to consume salt or reduce salt intake, how people use salt, and preferred methods of communica- tion were evaluated.
Understanding the key sources of salt in the diet, as well as lev- els of own salt intake in relation to recommendations, it is impor- tant for enabling individuals to judge their own situations and make steps towards positive changes. Markedly, there were perva- sive misperceptions surrounding the main sources of salt in the diet of the general population. Whereas on average most partici- pants thought that the majority of salt in the diet comes from salt added during cooking, based on the intake data processed food was on average the highest contributor of salt to the diet. Within indi- vidual countries China and Brazil showed particularly high levels of misperceptions in this area, although within all countries a notable proportion could not identify the main sources of salt. In relation to own levels of salt intake, there was also a strong disconnect, with
Table 4
Communication preferences regarding salt reduction per country.
Note:All main effects for country were significantly different atp< .001. Planned comparisons were conducted to determine where the significant differences were for the main effect of country by comparing the total mean and percentages for ‘all countries’ versus each individual country using Chi-square test and ANOVA.
⁄Significant differencep< .05.
a Participants were required to select as many items as they felt relevant, as such all values presented are the percentage of the total population per item that selected the item.
b Participants were required to select the item they were most interested in, thus all values presented are percentage of total within country (%).
the vast majority of people reporting that their intake was satisfac- tory, and in some cases even too low, even though international re- ports indicate that most people have a daily intake that is much higher than international recommendations (Elliott & Brown, 2007). Knowledge on salt intake recommendations was generally low, the highest levels of understanding were observed in China, where still only one third of the population (34%) knew the recom- mendations. Notably, participants in the USA were mostly unaware of recommendations. Taken together, these findings suggest that whilst reformulation of products to lower salt levels, and availabil- ity of low salt products is continually of importance, interventions should initially focus on teaching individuals what the key sources of salt are, which foods have a low salt content and to be more aware of their own level of intake in relation to recommendations.
Discretionary salt is an important source of salt intake (O’Reilly, Brinkman, Giles, English, & Nowson, 2010), so it was interesting to capture that a lot of participants added salt to food without even tasting. This provides a clear opening for interventions. By simply encouraging tasting before addition of salt, interventions could make a quick gain in salt reduction.
Over one third of the participants reported that they had no interest in salt reduction, and no intention to make any changes in salt intake within the next 6 months. This presents a clear target for salt reduction strategies and interventions. While awareness of, and interest in salt reduction is growing, there is still a need to ad- dress awareness and interest in a large group of people. This is par- ticularly the case for Germany and Austria where more than half the population had no interest in salt reduction, despite high levels of intake reported in both countries in national surveys (German Nutrition Society, 2008; Elmadfa, 2008). Somewhat more encour- agingly, 28% of the population indicated that they had already made changes and maintained these for over a 6 month period.
Although for the participants in the maintenance stage it is un- known what specifically these changes were, and whether salt in- take was actually reduced to recommended intake levels. It indicates that a good proportion of the general population are open to salt reduction and in the mindset to make positive, long-term changes. China had the highest response in this area, potentially due to recent in-country programmes on salt reduction, such as the ‘Chinese Residence Diet Guidelines’. Overall, these findings highlight that when developing a salt reduction strategy it should be first noted which stage of change countries are in so it can be determined whether people are already open to change, or whether they first need to be made aware and engaged in salt reduction. Salt reduction initiatives should be incorporated into overall dietary guidelines and be integrated into general healthy diet plans that target overall diet.
Beliefs surrounding the effects of salt in food varied between countries. Overall, it was well acknowledged that salt had an effect on raising thirst and blood pressure. Furthermore, in some coun- tries were iodine deficiency was currently or historically a relevant issue, particularly India and Germany/Austria, the effects of salt on iodine levels were seen as a valuable benefit of salt. There were some incorrect beliefs prominent across the countries (e.g., that salt promotes hunger). National interventions should take note of misperceptions in the general population and the lack of factual knowledge on effects of salt in their countries, and target these in interventions through education programmes. Encouragingly, reducing salt in food was viewed overall as being healthy and important. Moreover, health and importance attitudes were highly related. This is positive news, given the relatively low interest in changing salt intake. This could indicate that awareness of the is- sues of high salt consumption are prominent, but that given the large misperceptions regarding key sources and intake people are not aware of their own excessive salt intakes.
Participants strongly embraced the idea that they were the most responsible for their own salt intake. This is a noteworthy finding, as individuals are seen as key in the challenge of reducing their salt intake, so it is promising that the majority of people also see it as their responsibility. Interestingly, participants also acknowledged that sodium reduction involved other key players such as food manufacturers, restaurants, fast food chains, caterers, supermarkets, local shops, markets, family and friends. Interven- tions and strategies should capitalise on this mindset by acknowl- edging that people are willing to make changes, and that they understand the role that they have to play in this. Interventions and strategies should also take into account the responsibility apportioned to other key players, by looking into effective ways that these groups and people can work together to encourage members of the public to look for low-salt product options and re- duce the use of discretionary salt.
To deliver the most effective and useful communications about salt and salt reduction, it is important to know what people want to learn about salt and which communication channels (e.g., media and people) they find the most appealing. This study provides some insights into preferred means of communications that can be taken into account when developing salt reduction programmes or marketing campaigns. Eighty-nine percent of the total sample indicated that they wanted to hear something more about salt, showing an open mindset to new information. ‘The reasons why salt is bad for your health’, and ‘what foods are the main sources of salt in the diet’ were the most commonly reported items. In terms of beliefs participants generally understood that salt is asso- ciated with blood pressure. High blood pressure by itself, however, does not cause any perceivable symptoms so potentially the ad- verse effects of high blood pressure, or longer term health impacts, such as stroke and coronary heart disease, need to be made clearer.
The request to learn more about the sources of salt is consistent with the finding that people misperceived the key sources of salt.
The medical community was seen as the most preferred source of information, which increased significantly with age. Food labels and packaging was also seen as important, which could be linked to participants’ belief in the role of the food industry in achieving salt reduction. Also the proximity of the advice and information to the product at the point of purchase is seen as convenient. Tele- vision, online social websites (e.g., blogs, and discussions), and newspapers were the preferred mediums of communication.
Whilst there were no gender differences, interest in magazines and websites decreased with age, whilst interest in newspapers in- creased with age and interest in television peaked in the middle- age group. These preferences for communication mediums should be taken into account when deploying targeted campaigns.
The current novel study had several strengths, such as using large samples in multiple countries and applying combined nutri- tional science, epidemiology, and behavioural science techniques to salt reduction. However, some limitations were present in the current study, which should be taken into consideration when interpreting the findings. In the absence of a validated salt ques- tionnaire that took into account discretionary salt use, a new Salt FFQ had to be developed for the current study. This development was particularly challenging as salt had to be measured across many countries with differing products and cooking habits.
Although not the express purpose, the average salt intake derived from the Salt FFQ per country was comparable to country averages reported from national nutritional surveys. Further efforts will be made to extend the validation of this questionnaire. Furthermore, while the study sample was largely representative of the general population, India had a slight overrepresentation of highly educated people and the surveys in India and South Africa were only available to English-speaking people and all surveys were
complete only by people with internet access. This could influence the generalisability of the results.
As a first step towards a strategy for global salt reduction, coun- try specific results from this research study have been used as input for local workshops designed to develop national strategies for salt reduction in each country. These were organised by the International Union of Nutrition Sciences, in collaboration with Unilever, with stakeholders from various sectors (government, non-government organisations, food industry and retailers). It is also strongly encouraged that these findings be taken on further by national and international teams working towards salt reduction at a population level, particularly as these insights can help to increase the success of future interventions (Prochaska &
Velicer, 1997).
Conclusions
Important insights into understanding attitudes and beliefs towards salt reduction in an international setting were derived.
Similarities and significant differences were evident between countries, suggesting that whilst some strategies can be interna- tional, local tailoring is required. Notably, a large proportion of people were not interested in salt reduction, suggesting that efforts to promote interest in salt reduction are still warranted, particu- larly given the high levels of salt intake globally. This highlights that interventions need to take into account which stage of change the majority of the country’s population is in, and adapt strategies accordingly, whether to focus on increasing awareness, or motiva- tion. In all countries there was a misperception of own intake, of main sources of intake in the diet, and about what the current rec- ommendations were. This indicates that further education on salt intake recommendations, and main sources of salt intake (particu- larly those that are hidden sources), is warranted. Salt reduction was seen as important and healthy to the majority of participants.
Interestingly, participants saw themselves as responsible for their own salt intake, but food manufacturers also played a role, with a lesser focus on governments and international organisations. Par- ticipants had clear ideas on what, from whom and how they wanted to learn about the importance of salt reduction, and advan- tage should be taken of these insights to ensure that people are motivated to pay attention to the communications. The findings from this study should, and will be used to develop strategies and interventions for national, scalable salt reduction efforts.
References
Appel, L. J., Frohlich, E. D., Hall, J. E., Pearson, T. A., Sacco, R. L., Seals, D. R., et al.
(2011). The importance of population-wide sodium reduction as a means to prevent cardiovascular disease and stroke a call to action from the american heart association.Circulation, 123, 1138–1143.
Barton, P., Andronis, L., Briggs, A., McPherson, K., & Capewell, S. (2011). Effectiveness and cost effectiveness of cardiovascular disease prevention in whole populations. Modelling study.British Medical Journal, 343.
Bentley, B., De Jong, M. J., Moser, D. K., & Peden, A. R. (2005). Factors related to non- adherence to low sodium diet recommendations in heart failure patients.
European Journal of Cardiovascular Nursing, 4, 331–336.
Brug, J., & Kok, G. J. (1995). Misconceptie van consumenten over eigen vetconsumptie.Voeding, 56, 11–14.
Cook, N. R., Cutler, J. A., Obarzanek, E., Buring, J. E., Rexrode, K. M., Kumanyika, S. K., et al. (2007). Long term effects of dietary sodium reduction on cardiovascular disease outcomes. Observational follow-up of the trials of hypertension prevention (TOHP).British Medical Journal, 334, 885B–888B.
Elliott, P., & Brown, I. (2007).Sodium intakes around the world. Geneva, Switzerland:
World Health Organisation.
Elmadfa, I. et al. (2008).Austrian Nutrition Report. Vienna, Austria.
German Nutrition Society (2008). National Nutrition Report. Germany: DGE (in German).
Gregory, J. R., Lowe, S., Bates, C. J., Prentice, A., Jackson, L. V., & Smithers, G. et al.
(2000).National diet and nutrition survey. Young people aged 4–18 years. Report of the diet and nutrition survey(Vol. 1). London: TSO.
Grimes, C. A., Riddell, L. J., & Nowson, C. A. (2009). Consumer knowledge and attitudes to salt intake and labelled salt information.Appetite, 53, 189–194.
He, F. J., Li, J., & MacGregor, G. A. (2013). Effect of longer term modest salt reduction on blood pressure. Cochrane systematic review and meta-analysis of randomised trials.British Medical Journal, 346, f1325.
He, F. J., & MacGregor, G. A. (2011). Salt reduction lowers cardiovascular risk. Meta- analysis of outcome trials.Lancet, 378, 380–382.
Hypertension Prevention Trial Research Group (1990). The hypertension prevention trial. Three-year effects of dietary changes on blood pressure.Archives of Internal Medicine, 150, 153–162.
Kaczorowski, J. A., Chambers, L. W., Dolovich, L., Farrell, B., McDonough, B., Sebaldt, R., et al. (2010). Improving cardiovascular health at the population level. A 39 community cluster-randomized trial of the Cardiovascular Health Awareness Program (C-CHAP).Stroke, 41, E474.
Kim, M. K., Lopetcharat, P., & Drake, M. A. (2012). Consumer awareness of salt and sodium reduction and sodium labeling.Journal of Food Science, 77, s307–s313.
Liem, D. G., Miremadi, F., & Keast, R. S. (2012). Health labelling can influence taste perception and use of table salt for reduced-sodium products.Public Health Nutrition, 8, 1–8.
Murray, C. J., Lauer, J. A., & Hutubessy, R. C. (2005). Effectiveness and costs of interventions to lower systolic blood pressure and cholesterol. A global and regional analysis on reduction of cardiovascular-disease risk (vol. 361, pp. 717, 2003).Lancet, 366, 204.
O’Reilly, S. L., Brinkman, M., Giles, G., English, D., & Nowson, C. A. (2010). Sodium intake and use of discretionary salt in an Australian population sample.
Proceedings of the Nutrition Society, 69, E84.
Prochaska, J. O., & Velicer, W. F. (1997). The transtheoretical model of health behaviour change.American Journal of Health Promotion, 12, 38–48.
Sacks, F. M., Svetkey, L. P., Vollmer, W. M., Appel, L. J., Bray, G. A., Harsha, D., et al.
(2001). Effects on blood pressure of reduced dietary sodium and the dietary approaches to stop hypertension (DASH) diet.New England Journal of Medicine, 344, 3–10.
Smith, S. L., Quandt, S. A., Arcury, T. A., Wetmore, L. K., Bell, R. A., & Vitolins, M. Z.
(2006). Aging and eating in the rural, southern United States. Beliefs about salt and its effect on health.Social Science and Medicine, 62, 189–198.
Strazzullo, P., D’Elia, L. K. N. B., & Cappuccio, F. P. (2009). Salt intake, stroke and cardiovascular disease. A meta-analysis of prospective studies. Journal of Hypertension, 27, S180–S181.
Webster, J. L., Dunford, E. K., Hawkes, C., & Neal, B. C. (2011). Salt reduction initiatives around the world.Journal of Hypertension, 29, 1043–1050.
WHO (World Health Organization) (2012).Guideline. Sodium intake for adults and children. Geneva.