PETERBABINČÁK*
SUBJECTIVE HAPPINESS IN SLOVAKIA
Reliability and Validity of Measuring Happiness through the Subjective Happiness Scale
**(Received: 30 November 2017; accepted: 1 July 2018)
The objective of the present research was to assess the possibilities of measuring happiness in Slo- vakia and verify psychometric properties of the Slovak version of the Subjective Happiness Scale (SHS; LYUBOMIRSKY& LEPPER1999). Based on a systematic comparison of features of 16 lan- guage versions of SHS, satisfactory and interculturally comparable characteristics have been found of the scale, which still does not have a version adapted for the Slovak language environment. Data were collected from 977 respondents (three community samples and four samples of university students) aged 13–75 years. With the use of EFA and CFA, a single-factor structure of SHS was confirmed. SHS showed adequate internal consistency value (α = 0.773) and test-retest reliability (r = 0.615). Convergent validity was verified a) by comparing with another instrument to measure subjective happiness; b) by correlations with subjective well-being and quality of life; c) by cor- relations with other variables: personality traits, self-esteem, optimism, depression, religiosity, spir- ituality, family functions, compliance with and internalisation of norms. No significant differences in SHS values on the basis of gender, religion, and education were detected. It can be concluded that the short four-item scale which was used has satisfactory psychometric properties and offers opportunities for the rapid assessment of subjective happiness.
Keywords: subjective happiness, subjective well-being, reliability, validity, test-retest reliability
1. Introduction
The issue of happiness is currently the focus of attention for many researchers in social sciences. For illustration, ProQuest full-text database contains for the keyword
‘happiness’ (mentioned in the abstract of the studies) more than 170,000 entries, with
** Institute of Psychology, Faculty of Arts, University of Presov, Ul. 17. novembra 1, SK-08001 Prešov, Slovak Republic; peter.babincak@unipo.sk.
** This work was supported by the Slovak Research and Development Agency under Grant No. APVV-15- 0404.
a massive increase in publications in the 1980s of the last century. Despite the ambi- guity caused by the overlap between professional and ordinary language, the concept of happiness is often used, and some authors consider happiness to be the best indi- cator of quality of life (VEENHOVEN2000).
The overall subjective happiness is ‘a global, subjective assessment of whether one is a happy or an unhappy person’ (LYUBOMIRSKY& LEPPER1999, 139). The major- ity of authors places the concept of happiness in the context of subjective well-being.
DIENER(2000) divides it into three components, viz., satisfaction with life, positive affect, and negative affect. In this scheme, happiness is a broader and more holistic category, and can be identified with a subjective assessment of one’s own satisfac- tion. HALLERand HADLER(2006) consider it meaningful to distinguish between life satisfaction and happiness as two separate concepts. Happiness and satisfaction are seen as the result of interaction between individual characteristics and aspirations on the one hand, and between social relations and macro-structures on the other hand. Satisfaction is more the result of the evaluation process, including material and social aspirations and achievements; happiness is the result of positive experi- ences, especially with close personal relationships. Happiness cannot be equated with the affective component of subjective well-being. A person may feel happy or unhappy regardless of whether s/he recently experienced positive or negative emo- tions (LYUBOMIRSKY& LEPPER1999).
In terms of measuring happiness and subjective well-being, an oft-discussed issue is the choice of global or multidimensional instruments. According to VEEN-
HOVEN(2000), multidimensional measures struggle to tackle all relevant domains of a person’s life. An appropriate starting point is the construction of measures of a global nature where a person evaluates his/her life as a whole, and not on the basis of selected specific areas. Among the most commonly used global scales belong, for example, BRADBURN’s (1969) Affect Balance Scale and The Positive and Negative Affect Schedule (WATSONet al., 1988); these cover, however, only affective compon - ents of subjective well-being. Other frequently used scales, such as Satisfaction with Life Scale (SWLS; DIENER et al. 1985), in turn, query satisfaction with life as a whole, and a person’s happiness as such. According to LYUBOMIRSKYand LEPPER (1999), a simple sum of recent levels of affect or their satisfaction with life is not identical with a person’s happiness. There is a difference between when a person is assessed as very happy and the assessment that s/he lives a happy life (p.140).
Another group of methodologies consists of single-issue scales such as Single-Item Measurement of Happiness (ABDEL-KHALEK& LESTER2006), or the Global Happi- ness Item (BRADBURN1969); they are, however, too simple, and do not permit an evaluation of certain psychometric properties.
The most widely used global multi-item measure of subjective happiness is the Subjective Happiness Scale (LYUBOMIRSKY& LEPPER1999). It contains four items and a 7-point Likert response scale. The authors of the methodology claim excellent psy- chometric properties for SHS. It has been translated into several languages, and cur- rently exists in English, Russian, German, Spanish, Chinese, Portuguese, Italian,
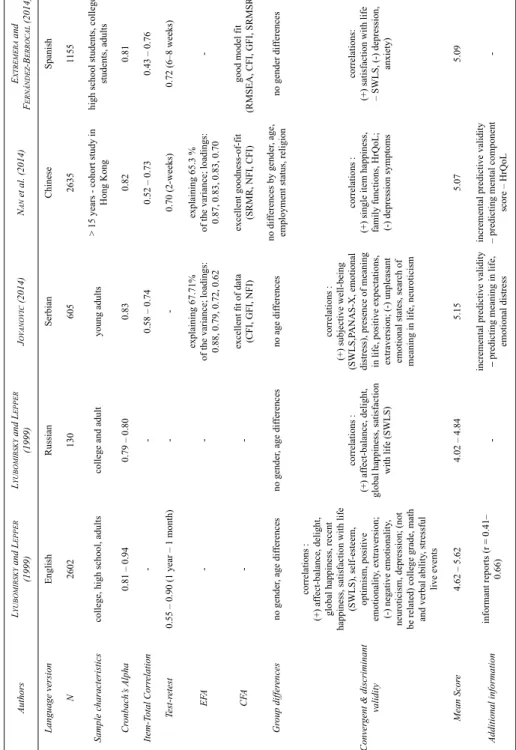
Japanese, Arabic, Greek, Serbian, Turkish, Malay, and Tagalog versions. An overview of SHS language versions is present in Table 1, together with psychometric properties and a summary of information regarding their validation. In comparison with another multi-item scale of subjective happiness, viz., the Oxford Happiness Questionnaire (HILLS& ARGYLE2001), SHS ‘is theory-driven, has a clear unidimensional structure, and does not overlap with similar mental health constructs’ (JOVANOVIC2014, 1096).
We offer an overview of 14 studies assessing the psychometric properties of 16 different language versions of SHS. Most commonly the authors, apart from calcu- lations of internal consistency, verified SHS unidimensionality with the use of EFA, and less often with the help of CFA. As a rule, group differences were checked on the basis of gender (and other characteristics such as ethnicity, age, education, confes- sion, etc.). The construct validity was assessed on the basis of correlations with the measures of subjective well-being (life satisfaction, positive and negative affect, the global happiness question) and other rates such as self-esteem, optimism, personality traits, depression, anxiety, meaning in life, family perception, health status, stress, etc. In only two cases was the incremental predictive validity evaluated. According to the criteria of the European Federation of Psychologists Associations – Review model for the description and evaluation of psychological and educational tests (EFPA 2013), the psychometric properties of the available language versions of SHS can be evaluated as follows:
Sample sizes: with the exception of two samples (Russian, Tagalog), sample sizes were adequate (≥ 200) or good (≥ 300); excellent sample sizes (≥ 1000) were used in five studies.
Internal consistency: with the exception of one study (Turkish), Cronbach’s Alpha values were adequate (≥ 0.70) and mostly good (≥ 0.80), in one study they were excellent (≥ 0.90).
Test-retest reliability: it was tested in five studies with a time interval of between two weeks and one year; all values were good (≥ 0.70) or excellent (≥ 0.80).
Item-total correlations were reported in five studies, all values exceeded 0.20 (0.22–
0.74), which represents an acceptable level.
Construct validity: 11 studies reported evidence of unidimensionality of the scale with help of EFA, eight studies reported an acceptable to excellent fit of the data with the help of CFA. Item-total correlations are listed by their authors in five studies.
Systematically lowest correlations were demonstrated in item 4, in one of the studies (Spanish), it reached the value of 0.24; in others the correlations were > 0.40. In terms of group differences, 12 studies reported the absence of gender differences, several studies have verified and confirmed the absence of age, religious, ethnic and marital status differences. To detect convergent validity, the most commonly used were the methodologies measuring satisfaction with life (SWLS), self-esteem (RSES), positive and negative affectivity, and single-item scales of happiness or sat- isfaction. One study (Turkish), compared the scores of SHS with another multi-item measure of subjective happiness (OHQ), yielding a correlation 0.71. The SHS and SWLS correlations in nine samples ranged between 0.50 and 0.72 (according to
AuthorsLYUBOMIRSKYand LEPPER (1999)LYUBOMIRSKYand LEPPER (1999)JOVANOVIC(2014)NANet al. (2014)EXTREMERAand FERNÁNDEZ-BERROCAL(2014) Language versionEnglishRussianSerbianChineseSpanish N260213060526351155 Sample characteristicscollege, high school, adultscollege and adultyoung adults> 15 years - cohort study in Hong Konghigh school students, college students, adults Cronbach’s Alpha0.81 – 0.940.79 – 0.800.830.820.81 Item-Total Correlation--0.58 – 0.740.52 – 0.730.43 – 0.76 Test-retest0.55 – 0.90 (1 year – 1 month)--0.70 (2-weeks)0.72 (6–8 weeks) EFA--explaining 67.71% of the variance; loadings: 0.88, 0.79, 0.72, 0.62
explaining 65.3 % of the variance; loadings: 0.87, 0.83, 0.83, 0.70- CFA--excellent fit of data (CFI, GFI, NFI)excellent goodness-of-fit (SRMR, NFI, CFI)good model fit (RMSEA, CFI, GFI, SRMSR) Group differencesno gender, age differencesno gender, age differencesno age differencesno differences by gender, age, employment status, religionno gender differences Convergent & discriminant validity
correlations : (+) affect-balance, delight, global happiness, recent happiness, satisfaction with life (SWLS), self-esteem, optimism, positive emotionality, extraversion; (-) negative emotionality, neuroticism, depression; (not be related) college grade, math and verbal ability, stressful live events correlations : (+) affect-balance, delight, global happiness, satisfaction with life (SWLS) correlations : (+) subjective well-being (SWLS,PANAS-X, emotional distress), presence of meaning in life, positive expectations, extraversion; (-) unpleasant emotional states, search of meaning in life, neuroticism
correlations : (+) single item happiness, family functions, HrQoL; (-) depression symptoms
correlations: (+) satisfaction with life – SWLS, (-) depression, anxiety) Mean Score4.62 – 5.624.02 – 4.845.155.075.09 Additional informationinformant reports (r = 0.41– 0.66)-incremental predictive validity – predicting meaning in life, emotional distress
incremental predictive validity – predicting mental component score – HrQoL-
Table 1 Comparison of the psychometric properties of different language versions of SHS
AuthorsIANIet al. (2014)SWAMIet al. (2009)SWAMIet al. (2009)SWAMI(2008)MOGHNIEand KAZARIAN(2012) Language versionItalianGermanTagalogMalayArabic N9931960182559273 Sample characteristics18 – 85 years--Chinese and Malay community sampleLebanese college students Cronbach’s Alpha0.790.820.780.930.74 Item-Total Correlation Test-retest---0.95 (30 days)- EFAexplaining 65.7% of the variance; loadings: 0.83, 0.83, 0.81, 0.77 explaining 53.2% of the variance; loadings: 0.90, 0.82, 0.79, 0.78
explaining 83.0% of the variance; loadings: 0.93, 0.90, 0.90, 0.90- CFAacceptable fit (NNFI, CFI, RMSEA)---- Group differencesno gender, no geographic differencesno gender differencesno gender differencesno gender, ethnic differenceno gender, age, marital status and birth order differences Convergent & discriminant validity
correlations : (+) satisfaction with various domains of life; (-) psychological distress, anxiety, depression, health problems correlations : (+) delight, global happiness, satisfaction with life (SWLS), positive affect; (-) negative affect
correlations: (+) delight, global happiness, satisfaction with life (SWLS), self-esteem
correlations: (+) delight, global happinesscorrelations : (-) parental rejection Mean Score4.775.184.854.424.73 Additional information-cross-cultural comparison---
AuthorsDAMÁSIOet al. (2013)SPAGNOLIet al. (2012)ORTIZet al. (2013)DOĞANand TOTAN(2013)SHIMAIet al. (2004)LYRAKOSet al. (2013) Language versionPortuguese (Brasilian)PortugueseSpanishTurkishJapaneseGreek N6001017403 + 324696364856 Sample characteristicsBrasilian adultsworking adult population – 5 age groupsstudents and adults from Argentina
community sample and undergraduate studentsundergraduate studentsadults Cronbach’s Alpha0.840.770.72 / 0.680.65 / 0.700.80 – 0.840.756 Item-Total Correlation--0.39 – 0.60 / 0.24 – 0.59--0.22–0.74 Test-retest----.86 (5 weeks)- EFAexplaining 64.21% of the variance; loadings: 0.82, 0.74, 0.65, (–)0.69
explaining 63% of the variance explaining 57.38% of the variance; loadings: 0.81, 0.71, 0.64, 0.47 explaining 53.94-57.20% of the variance; loadings: from 0.30 to 0.91
was calculatedexplaining 59.4% of the total variance CFAexcellent fit (CFI, TLI, RMSEA, SRMR, chi square/df)
excellent fit (CFI, GFI, RMSEA) excellent fit (AGFI, CFI, TLI, RMSEA)
sufficient goodness of fit (NFI, CFI, IFI, GFI, RMSEA, RMR)-- Group differences-no significant gender and age differencesno gender differencesno gender, age, marital status, education level differences-- Convergent & discriminant validity
correlations : (+) life satisfaction (SWLS), self-esteem, hope correlations : (+) life satisfaction (SWLS) correlations : (+) positive affection; (-) negative affection correlations : (+) happiness (OHQ), optimism, positive affect, life satisfaction (SWLS); (-) negative affect
correlations : (+) positive health, self-esteem, (-) depression
correlations : (+) life satisfaction (SWLS), optimism; (-) stress, anxiety, depression Mean Scorethe authors point 20.1; the equivalent of 5.34.775.19 (calculated from averages items)4.73 / 4.63-- Additional information----
*information drawn from the abstract of the study (Article in Japanese)
*information drawn from the abstract of the study (Abstract of the 21th European Congress of Psychiatry)
EFPA, the adequate correlation value is ≥ 0.55); the value was only lower in one sam- ple (Tagalog). With the single-item question on happiness, SHS correlated on the level from 0.49 to 0.63. SHS correlation coefficients and positive/negative affectivity were lower, ranging from 0.33 to 0.56, or from –0.33 to –0.56 (5 studies). Self- esteem correlated with SHS in two samples at the 0.53 or 0.57 levels, in one study the correlation coefficient was lower (0.20; Tagalog).
Incremental predictive validity was verified on two samples (Serbian, Chinese).
The predicted variables were emotional distress and presence of meaning in life in one study; among the predictors were included personality traits and two components of subjective well-being. In the other sample, the mental component score of HRQoL was predicted and the predictors were family functions. The standardised beta for SHS was > 0.20 in all cases.
Average values: the values varied between 4.02 and 5.62, with the lowest values in the Russian and the highest in the US sample.
In summary, it can be stated that individual language versions of SHS exhibit comparable and favorable psychometric properties. The objective of our study was to verify the reliability and validity of the Slovak version of SHS. A similar method- ology has not yet been validated in Slovakia, nor in other Central European countries.
At the same time, it also offers a possibility to compare descriptive data of the Slovak version of SHS with the data from the Russian version of the tool, or validation data from other countries. The realised overview of validation studies offers a reference framework for assessing the psychometric properties of the Slovak version of SHS.
2. Methods 2.1. Participants
To verify the psychometric properties of the Slovak SHS version, the data were obtained from seven different samples. In each sample, the testing battery was com- prised of SHS and other methods (varying in each data collection). The data were collected from 977 respondents, under different circumstances in terms of time (date) and environment. Four samples consisted of college students, one sample consisted of young adults up to 30 years of age, and three were community samples in Prešov (a medium-sized city in the eastern part of Slovakia). 226 respondents from the fourth sample (N = 270) participated in the retest measurements within an interval of one month. The descriptive data about the samples are given in Table 2.
2.2. Materials 2.2.1. Study 1
When choosing methods for the first research study, we were inspired by the initial validation study of the authors of the methodology (LYUBOMIRSKY& LEPPER1999).
In this study, the authors found that ‘individuals who perceive themselves as being happy also think well of themselves, are optimistic about their futures, experience a predominance of positive emotions, and are extraverted. In addition, happy indi- viduals did not appear to be inclined towards depression or neuroticism’ (p.145). In accordance with LYUBOMIRSKYand LEPPER, we selected two tools to detect subjective well-being, and four disposition scales for the assessment of self-esteem, optimism, neuroticism, extraversion and depression:
Satisfaction With Life Scale(SWLS; DIENERet al. 1985) ranks among the most widely used tools to identify satisfaction with life (WoS database contains more than 7,400 citations of the source). SWLS consists of five items with a 7-point response scale (strongly disagree – strongly agree), the authors of the methodology give excel- lent indicators of reliability and validity (in our study α = 0.779).
Emotional habitual subjective well-being scale(SEHP; DŽUKA& DALBERT2002) focuses on the affective component of subjective well-being. Its 10 items represent positive and negative emotions and bodily sensations; respondents assess the fre- quency of how often they experience the given emotions. (The 6-point response scale:
almost always – almost never; the scale of the negative affect; 6 items, α = 0.768; the scale of positive affect; 4 items, α = 0.841).
Rosenberg self-esteem scale(RSES; ROSENBERG1965; translation by HALAMA
& BIEŠČAD2006) is currently the gold standard for determining global self-esteem (ROSENBERG1965; MRUK2006). The 10-item methodology with a 4-point response scale (strongly agree – strongly disagree) allows one-, two- and three-factor evalu - ation; we applied the most frequently used one-factor rating (α = 0.805).
Revised Life Orientation Test – Revised (LOT-R; SCHEIERet al. 1994) is an 8-item scale of dispositional optimism and represents the tendency of an individual to see the world and the future in a positive way (4-point scale: strongly disagree – strongly agree; α = 0.635).
Table 2
Description of samples; total N = 977
Sample No. N Description Age (mean/range) Men/Women
1 100 university students 21.58 / 18–24 50/50
2 60 university students 21.78 / 20–26 28/32
3 75 university students 20.96 / 18–25 21/54
4 270 community sample 28.54 / 13–72 102/168
4 retest 226 community sample 28.99 / 13–72 84/142
5 103 young adults 23.77 / 20–30 48/55
6 194 university students 22.80 / 18–26 96/98
7 175 community sample 37.86 / 19–75 81/94
Scales of neuroticism and extraversion in Eysenck’s personality questionnaires for adults EPQ-R(SENKAet al. 1992) contain 12 items (answers yes / no; neuroticism α = 0.784, extraversion α = 0.833).
Beck Depression Inventory(BDI; BECKet al. 1961) detects a person’s degree of depression and includes 21 items (4-point response scale; α = 0.840).
2.2.2. Study 2
The second study was aimed at verifying the relationship between subjective happi- ness and two aspects of moral reasoning. The expected relationship is based on the findings regarding the relationship between happiness and ethical preferences and proclivities (JAMES& CHYMIS2004) and DIENER’s assumption of normative founda- tions of a good life (DIENER& SUH1997).
The scale of moral norms(HOSPODÁROVÁ& BABINČÁK2012). The question- naire contains two sets of 34 items, the first of which detects compliance with, and the second internalisation of moral standards in, the areas of lying, stealing, prosocial behavior, respect for elders, aggressive behavior, respect for nature, alcohol and drugs. (7-point response scale focusing on item acceptance and the occurrence of behaviour; Compliance: α = 0.76, E.g.: How often do you cheat at exams?; Internal- isation: α = 0.85; E.g.: Do you have at least in some cases the right to cheat on tests?)
2.2.3. Study 3
In the third study, we compared SHS with another measure assessing happiness, which is grounded in a different conceptual basis (the measure was selected in accordance with DOĞANand TOTAN, 2013, which confirmed the strong relationship with the SHS). We also verified the correlation of happiness and personality char- acteristics.
The Oxford Happiness Questionnaire(OHQ; HILLS& ARGYLE2001) is a 29- item methodology to measure happiness as a multidimensional construct, and includes frequent experiencing of positive emotions or joy, a high average level of satisfaction and absence of negative feelings such as depression and anxiety (6-point Likert scale; α = 0.876, e.g.: I laugh a lot; I think I do not look appealing).
Rosenberg self-esteem scale(see above)
Big Five Aspect Scales(BFAS; DEYOUNG et al. 2007) is a 100-item scale to measure the five personality factors (α = 0.722 – 0.855) with each factor representing two mutually correlating aspects (10 aspects: α = 0.590 – 0.834; 5-point response scale: strongly disagree – strongly agree).
2.2.4. Study 4
In another study, we verified the retest reliability of SHS and its relationship with the quality of life as defined under the QOL discrepancy model (CALMAN 1984;
MICHALOS1985) and the model of life satisfaction. These models represent two con- ceptually different approaches to quality of life assessment.
GAP-QoL measure. The methodology contains 13 questions formulated accord- ing to WU(2008) for detecting the quality of life as the difference between what a per- son wants, has, and what s/he wants to have (Gap concept; CALMAN1984). The 12 items correspond to the dimensions of quality of life using the concept of WHOQOL (standard of living, health, family, work, friends, housing, partner, relaxation, spiritu- ality, transportation, education, appearance), one item assesses the global quality of life. Participants rated their have-want discrepancy on a 7-point Likert scale ranging from 1 (the same as the want status) to 7 (large discrepancy from the want status).
2.2.4.1. Study 4 - retest measurement GAP-QoL measure(see above)
Satisfaction-QoL measure. The methodology is analogous to the scale detecting satisfaction with 12 areas of life formulated by WU(2008).
2.2.5. Study 5
The fifth study verified the context of happiness and family environment.
Family Environment Scale(FES; MOOS& MOOS1974; translation HARGAŠOVÁ
& KOLLÁRIK1986) is a 90-item (responses true / false) instrument detecting the per- ception of family, and consists of 10 subscales and three dimensions: interpersonal relationship dimension (cohesion, expressiveness, conflict), the Personal Growth (independence, achievement orientation, intellectual-cultural orientation, active- recreational orientation, moral-religious emphasis), and the System Maintenance (organisation, control). Reliability of the scales ranged from α = 0.608 to 0.798, with the exception of independence (α = 0.296), achievement orientation (α = 0.340), moral-religious emphasis (α = 0.312), and organisation (α = 0.534), which have not been evaluated.
2.2.6. Study 6
The sixth study was aimed at the verification of the relationship between happiness and selected dimensions of spirituality and religiosity. Our assumptions were based on researches that confirm the relationship between happiness and religiousness (COHEN2002) and overall spirituality (FRANCISet al. 2000).
The Oxford Happiness Questionnaire(see above).
The Expressions of Spirituality Inventory-Revised(ESI; MACDONALD2000) – the methodology for determining experiences, attitudes, convictions, and lifestyle concerning spirituality. Religiosity and spirituality are perceived as a multi-dimen- sional construct consisting of five areas: a) Cognitive Orientation Towards Spiritu- ality (COS), b) Experiential / Phenomenological Dimension (EPD), c) Existential
Well-Being (EWB), d) Paranormal Beliefs (PAR) and e) Religiousness (REL). The ESI-R’s α coefficients range from 0.788 for PAR to 0.933 for COS. The ESI-R ques- tionnaire has 32 items with a 5-point Likert response scale.
The Salience in Religious Commitment Scale(SRC; ROOF& PERKINS1975) - three-item scale measures ‘the importance an individual attaches to being religious’
(p.111). It is used to determine the extent to which adults consider their religious beliefs to be important. The construct measured is very similar to Allport’s concept of internalised religiosity (HALAMAet al. 2006). The SRC’s α coefficient is 0.913, a 7-point Likert response scale was used.
2.2.7. Study 7
This study verified the relationship between SHS and the methodology measuring the quality of life not as satisfaction or difference, but as quality.
Scale of subjective assessment of quality of life(SAQL; DŽUKA2013) is a 29- item methodology for measuring the quality of life as ‘a subjective evaluation of important domains of life of internal/external and personal/impersonal nature on the
‘good – bad’ 5-point scale’ (DŽUKA2013, p.477). It includes these subscales: psy- chosocial domain SAQL (α = 0.818), environmental SAQL domain (α = 0.725), cog- nitive SAQL domain (α = 0.773), and physical SAQL domain (α = 0.858).
2.3. Procedure and Data Analyses
The translation of the SHS methodology into the Slovak language was implemented in a parallel fashion by the author of the study and a linguist. The differences in trans- lations were discussed by the two translators jointly. The final version was adminis- tered to university students during lessons and to the members of the community sample by trained interviewers. When analysing the data, we proceeded by analogy with the above-mentioned validation studies of individual SHS language versions.
The unidimensional structure was verified with the help of exploratory factor analysis (EFA), and confirmatory factor analysis (CFA). EFA was used to identify the factor structure of SHS. Data requirements for factor analysis were verified with the help of the Kaiser-Meyer-Olkin (KMO) measure of sampling adequacy and the Bartlett’s test of sphericity. The calculation was carried out both on the whole group of res - pond ents and on individual samples with a frequency > 100. For factor identification, the eigenvalue > 1 criterion was used. Afterwards, CFA was done; the suitability model was tested with the help of these indicators: the normed fit index (NFI), the comparative fit index (CFI), and goodness of fit index (GFI). Other indicators, the chi-squared test and the root mean square error of approximation (RMSEA), were calculated. In the interpretation of the results, it was taken into consideration that they are unsuitable for large files and a small number of degrees of freedom. SHS internal consistency was estimated using Cronbach’s alpha coefficient. On one of the samples we verified retest test-reliability of the SHS after one month. To verify convergent
validity, we used correlation coefficients and the linear regression model. Between- groups comparisons were used to obtain the evidence of discriminatory validity. For statistical analysis, software SPSS v.21 and LISREL 8.80 were used.
2.4. Compliance with Ethical Standards
This research fully corresponds with the ethical standards of the institutional and national research committee, and with the 1964 Helsinki declaration and its later amendments or comparable ethical standards.
3. Results
3.1. Descriptive Statistics
Means, standard deviations, and skewnesses SHS for all samples are shown in Table 4. Means of the SHS varied between 4.629 and 5.242. There were no significant dif- ferences between samples with the exception of sample No. 2, which was signifi- cantly different from sample No. 7 (Scheffe post-hoc test: sig. = 0.017).
3.2. Exploratory Factor Analysis
To verify whether SHS shows unidimensional structure, we performed an exploratory factor analysis (Principal components method; Varimax rotation) for samples with N > 100. Conditions for the calculation were met: KMO > 0.60, significant Bartlett’s test of sphericity (TABACHNICK& FIDELL2001), skewness of the data ranged between –0.156 to –0.894. One-dimensional factor solution, on the basis of eigenvalue > 1.0, was possible for all samples. Eigenvalues ranged between 2.28 and 2.54 and explained 56.91%–63.60% of variance. All items were included in a single factor (factor loadings – item 1: 0.800–0.895; item 2: 0.838–0.876, item 3: 0.742–0.787, item 4: 0.514–0.768). The summary of the data is given in Table 3.
3.3. Confirmatory Factor Analysis
CFA was calculated using covariance matrix, and parameter estimates were obtained using the maximum likelihood method. The model output is shown in Figure 1. For a single-factor model, the following variables were calculated: χ2 (2) = 44.495, p <
0.000; χ2 / df = 22.25; NFI = 0.965; GFI = 0.978; CFI = 0.967; RMSEA = 0.148.
Chi-square value indicates insufficient degree of fit, but for large samples (we used N = 977) it is too strict and, as a rule, always significant (KENNYet al. 2015). The Root Mean Square Error of Approximation (RMSEA) indicates a poor fitting model; KENNYand colleagues (2015), however, do not recommend using this indi- cator for low df models. Other calculated indicators point to a good fit of the data (NFI, CFI, GFI > 0.95).
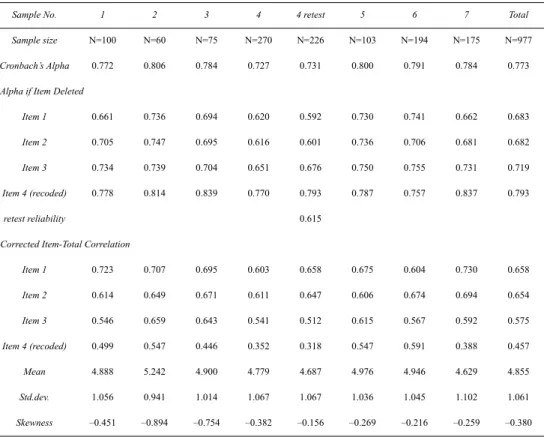
3.4. Scale Reliability
Internal Consistency of SHS was α = 0.773 for the whole dataset, which represents an adequate value (EFPA 2013); in individual subgroups, Cronbach’s α values ranged from 0.727 to 0.806 (see Table 4). The table below presents the values Alpha if item is deleted; a slight increase in the Alpha coefficient would occur in case of item 4 removal, although the increase would be not a significant one (the largest increase in Sample 4-retest of .062). Corrected Item-Total Correlation for all items and all data collections were > 0.30, which is a satisfactory level.
Figure 1
Confirmatory factor analysis’ model output Table 3
Results of exploratory factor analysis
Sample No. 1 4 4 retest 5 6 7 Total
Sample size 100 270 226 103 194 175 977
KMO 0.721 0.690 0.725 0.691 0.715 0.718 0.726
Bartlett’s Test - Sig. 0.000 0.000 0.000 0.000 0.000 0.000 0.000
Eigenvalue 2.510 2.280 2.304 2.544 2.503 2.506 2.450
% of Variance 62.81 56.91 57.60 63.60 62.57 62.66 61.25
Factor loadings
Item 1 0.895 0.834 0.862 0.847 0.800 0.895 0.848
Item 2 0.875 0.843 0.855 0.838 0.850 0.876 0.850
Item 3 0.787 0.755 0.753 0.776 0.742 0.782 0.765
Item 4 0.572 0.548 0.514 0.722 0.768 0.571 0.651
SHS1
SHS2
SHS3
SHS4rek e4
.44
.45
1.27
1.93 1
1
1
1 e3
e2
e1
Subjective_Happiness 1.49
1.18 1.00
1.44 .53
3.5. Test–Retest Reliability
Data on test-retest reliability were obtained from 226 respondents after a month’s time interval. Cronbach’s α was 0.720 for the first measurement, and 0.731 for the second measurement. The correlation between the two measurements was 0.615 (p < 0.001) which represents an adequate value (EFPA 2013).
3.6. Convergent Validity
Table 5shows the correlation with 45 variables. They are a) other measure of subject - ive happiness; b) indicators of subjective well-being or QoL; c) personality variables and self-esteem; d) other variables with which positive/negative relationship to SHS can be assumed.
a) Correlation of SHS and another tool measuring subjective happiness (OHQ) was 0.642 and 0.746, which represents a strong relationship.
Sample No. 1 2 3 4 4 retest 5 6 7 Total
Sample size N=100 N=60 N=75 N=270 N=226 N=103 N=194 N=175 N=977
Cronbach’s Alpha 0.772 0.806 0.784 0.727 0.731 0.800 0.791 0.784 0.773
Alpha if Item Deleted
Item 1 0.661 0.736 0.694 0.620 0.592 0.730 0.741 0.662 0.683
Item 2 0.705 0.747 0.695 0.616 0.601 0.736 0.706 0.681 0.682
Item 3 0.734 0.739 0.704 0.651 0.676 0.750 0.755 0.731 0.719
Item 4 (recoded) 0.778 0.814 0.839 0.770 0.793 0.787 0.757 0.837 0.793
retest reliability 0.615
Corrected Item-Total Correlation
Item 1 0.723 0.707 0.695 0.603 0.658 0.675 0.604 0.730 0.658
Item 2 0.614 0.649 0.671 0.611 0.647 0.606 0.674 0.694 0.654
Item 3 0.546 0.659 0.643 0.541 0.512 0.615 0.567 0.592 0.575
Item 4 (recoded) 0.499 0.547 0.446 0.352 0.318 0.547 0.591 0.388 0.457
Mean 4.888 5.242 4.900 4.779 4.687 4.976 4.946 4.629 4.855
Std.dev. 1.056 0.941 1.014 1.067 1.067 1.036 1.045 1.102 1.061
Skewness –0.451 –0.894 –0.754 –0.382 –0.156 –0.269 –0.216 –0.259 –0.380
Table 4
SHS internal consistency, averages, standard deviations and skewness
b) Correlation coefficients of SHS and indicators of global life satisfaction were high (for SWLS r = 0.579***) and medium (GAP QoL – general question r = –0.310***/–0.346***). Correlations of SHS and satisfaction with specific domains of life were lower (from 0.140*to 0.298***). SHS highly correlated with positive affect (r = 0.732***), correlation with negative affect was medium (r = –0.390***). Relation- ships between SHS and values of quality of life were evaluated in four domains, SHS had the strongest correlation with psychosocial domain of QOL (r = 0.645***), other correlations were medium or low (physical domain QOL, r = 0.479***; cognitive domain QOL, r = 0.466***; environmental domain QOL, r = 0.243**). Correlations of SHS and specific domains of quality of life detected through a differential model of QOL were medium to low (the highest value was r = –0.325***).
c) From the personality variables, the tightest relationship was detected between SHS and extraversion (r = 0.443***), and between SHS and neuroticism (r = –0.306***), these correlations were medium. The extraversion and happiness relationship were backed primarily by the feature of enthusiasm (r = 0.462***); in the case of neuroticism, happiness was connected especially with the aspect of withdrawal (r = –0.405***). Self-esteem correlated high with SHS in sample 1 (r = 0.527***), and medium in sample 2 (r = 0.469***).
d) We detected a medium positive correlation of subjective happiness and dis- positional optimism (r = 0.414***), and a strong negative relationship with depres- sion (r = –.552***). From among the family functions, it was cohesion (r = 0.517***), active-recreational orientation (r = 0.458***), intellectual-cultural orientation (r = 0.390***), and expressiveness (r = 0.328**), that had the largest positive corre- lations with SHS. Negative correlation with SHS was detected with conflicting atti- tude (r = –0.352***) and control (r = –0.227*); of the variables of spirituality and religiosity, it was only existential well-being (r = 0.694***) that was strongly asso- ciated with happiness. Happiness was related to compliance and internalisation of norms only slightly.
Next, we compared SWLS and SHS on the basis of how they correlate with positive (PA) and negative of affect (NA). Closer relations of SHS were with the PA and NA (r(PA) = 0.732***; r(NA) = –0.390***), in contrast with SWLS (there are cor- relations only r(NA) = –0.168 or r(PA) = 0.502***). When SHS and SWLS were entered into the regression equation as predictors, together with self-esteem, age, and gender, while the criterion was positive and negative affect, in the linear regression model only SHS with 54% of the explained variance of positive affect, and 15% of explained variance for negative affect were documented.
3.7. Between-Group Comparisons
We verified gender differences in SHS in all samples as well as in the whole group of respondents. a significant difference was not detected in any sample, nor in the whole group (F = 0.682, sig. = 0.409). We also examined group differences in the degree of happiness on the basis of religiosity, education, and marital and employment status.
Table 5
Correlation of SHS with other variables
Study No. 1 2 3 4 4* 5 6 7
SWLS 0.579***
SEHP-PA 0.732***
SEHP-NA –0.390***
RSES 0.527*** 0.469***
Lot-R 0.414***
EPQ-R Ext. 0.373***
EPQ-R Neur. –0.462***
BDI –0.552***
Adherence to norms –0.228 Internalisation of norms –0.247
OHQ 0.642*** 0.746***
Neuroticism –0.306**
N-Volatility –0.167
N-Withdrawal –0.405***
Agreeableness 0.142
A-Compassion 0.303**
A-Politeness –0.064
Conscientiousness 0.243*
C-Industriousness 0.296*
C-Orderliness 0.049
Extraversion 0.443***
E-Enthusiasm 0.462***
E-Assertiveness 0.324**
Openness/Intellect 0.240*
O-Intellect 0.220
O-Openness 0.144
GAP-QoL-general question –0.346*** –0.310***
GAP-QoL-domains from –0.166**to –0.325*** from 0.005 to –0.271***
Satisfaction-domains from 0.140*to 0.298***
Cohesion 0.517***
Expressiveness 0.328**
Conflict –0.352***
Intellectual-cultural orientation 0.390***
Active-recreational orientation 0.458***
Control –0.227*
ESI Cognitive Orientation towards Spirituality –0.043
Experiential/ Phenomenological Dimension 0.062
Existential Well-Being 0.694**
Paranormal Beliefs –0.055
Religiousness 0.096
The Salience in Religious Commitment Scale 0.053
SAQL - Psychosocial domain 0.645***
SAQL - Environmental domain 0.243**
SAQL - Cognitive domain 0.466***
SAQL - Physical domain 0.479***
Note: *: p < 0.05; **: p < 0.01; ***: p < 0.001
We verified differences on the basis of religiosity in six samples; in five cases, we detected no significant difference, with the exception of sample 5 where a differ- ence was detected (strong believer = 5.402, believer = 4.879, non-believer = 4.519). No differences were identified regarding education or marital status (sam- ple 4, 4-retest, 7). Table 6presents the summarised results of the verification of intergroup differences.
4. Discussion
The objective of the study was to verify the psychometric properties of the Slovak version of the Subjective Happiness Scale. It is an instrument which offers a wealth of possibilities for research applications, and is currently available in several lan- guage versions (so far, no extensive validation study of the Slovak or Czech version of SHS has been published). In the systematic overview, we provided the basic psy- chometric properties of SHS in 16 language versions. It can be stated that positive and mutually comparable psychometric parameters of the instrument adapted to dif- ferent language environments can be confirmed; since we recorded similar results, our findings do not depart from this overall pattern.
a) The 4-item SHS methodology is unidimensional; a similar structure was con- firmed by the exploratory and confirmatory factor analysis. Due to a small number
Mean Religion/religiosity differences
F Sig. Men Women F Sig. Means/differences in other variables
Sample 1 1.136 0.289 5.000 4.775 0.374 0.542 believers = 4.921; non-believers = 4.762
Sample 2 2.789 0.100 5.455 5.055 1.466 0.231 church-going believers = 5.069; non-church going believers
= 5.375
Sample 3 2.277 0.136 4.619 5.009 0.726 0.487 church-going believers = 4.831; non-church going believers
= 5.208; non-believers = 5.036
Sample 4 0.001 0.970 4.782 4.778 - - education (F=.971;Sig.=.380), marital/partner status (F=2.526;Sig.=.058)
Sample 4 retest 0.466 0.496 4.750 4.649 - - education (F=1.311;Sig.=.272), marital/partner status (F=1.986;Sig.=.098)
Sample 5 1.711 0.194 4.833 5.100 4.142 0.019 strong believer = 5.402; believer = 4.879; non-believer
= 4.519
Sample 6 3.381 0.068 4.807 5.082 0.604 0.438 believer = 4.982; non-believer = 4.852
Sample 7 0.038 0.846 4.611 4.645 - - education (F=2.02, Sig. =.094), marital status (F=1.832, Sig.=.163), type of religiosity (F=2.796; Sig. =.064) Note: *p < 0.05.
Table 6
Group differences in subjective happiness on the basis of gender and other variables
of items and a large group of respondents, only some of the CFA coefficients were applicable. About half of the authors of other validation studies used CFA with suf- ficient to excellent results.
b) Reliability was verified as an internal consistency using Cronbach’s alpha and test-retest reliability coefficient. We obtained positive values for the entire set of respondents and for its subgroups (alpha of 0.727 to 0.806), and also an adequate value for test-retest reliability (0.615).
c) As it is difficult to find a reliable criterion of happiness, in order to verify the characteristics of the methodology, we chose evidence for construct validity. The the- ory has demonstrated the relationship between happiness and subjective well-being indicators (e.g. VÁZQUEZet al. 2013); for the purposes of the present study, we tested the relationship between SHS and another methodology for measuring happiness, relationships with life satisfaction, and positive and negative affect. In addition to measuring subjective well-being, we also focused our attention on the indicators of subjective quality of life measured in several ways.
In accordance with our expectations, we observed the strongest correlation between SHS and The Oxford Happiness Questionnaire, which is a multi-item meas- ure of happiness, covering several aspects of happiness and subjective well-being.
56% / 41% of the explained common variance suggests that both methodologies pro- vide values for similar – yet not identical – constructs. High values of correlation coefficients were detected for the relationship of happiness with life satisfaction, posi tive affect, and psychosocial quality of life. Lower correlation for negative affect and other areas of quality of life were expected – other authors detected them as well (JOVANOVIC2014).
Of the personality variables, the ones most closely correlating with SHS were extraversion, neuroticism, and self-esteem on the level of moderately strong correl - ation coefficients. This triad of personality traits represents the traditional predic- tors/correlates of various indicators of subjective well-being. In accordance with our expectations, we noticed a close relationship among several other correlated vari- ables between happiness and depression (negative relationship), cohesion in the family, and existential well-being (positive relationship) (correlation of ± 0.50). Per- haps the most frequently tested correlate of happiness in validation studies was sat- isfaction with life measured by the SWLS methodology. We compared the predict - ive power of SHS and SWLS in the case when either a positive or negative affect was used as a criterion in the regression model. Happiness proved to be a better pre- dictor/correlate.
This finding is consistent with GUNDELACHand KREINER’s (2004) claim: they found satisfaction with life as more cognitively oriented than happiness is. Satisfaction is more specific; happiness is a more diffuse feeling. CAMPBELLand colleagues (1976) argue that happiness points to an experience or to experiencing an affect. When some- one says s/he is happy, it is an expression of the overall feeling; satisfaction is more specific and cognitively regulated. a person may say that s/he is happy, but that s/he is not satisfied with some aspects of her/his life. The link with the positive affect is also
confirmed by SELIGMAN(2002) who states that happy people remember a higher number of positive experiences and are generally able to perceive a number of ex - peri ences positively. The results of our study confirm the characteristics of the meas- ured construct of happiness in comparison with the related variables falling within the concept of subjective well-being, as well as within the indicators of quality of life, personality and other variables.
d) In verifying the discriminatory validity, similarly to the majority of authors of other SHS language versions, we did not record gender differences, differences on the basis of religiosity, education or marital status.
A specific feature of the present research is the fact that we have an opportunity to compare features of a validated methodology with other language versions of the instrument, and that the reported results have a potential to go beyond the local lin- guistic context. Through the fact that the results are similar for the different versions and language versions of the instrument, our results support the features of the instru- ment as such as well as a relative sociocultural independence of subjective happiness measured with SHS.
Among the limitations of research belongs the fact that 977 participants in the research were collected from seven samples, some of which were small in size; also, selection was not representative. This restriction is compensated for partly by the fact that in several samples/subgroups, similar properties of the measured construct were detected. To prove the validity, more information about the content and the criterion validity of SHS should be obtained.
To summarise: it can be stated that the Slovak version1of the measure reveals satisfactory values of reliability and validity, and as such it is usable for the assess- ment of subjective happiness in research. It is brief, time-saving, understandable to respondents and well-interpretable. It offers a wide range of practical applications in the field of subjective quality of life assessment. For its further use, it is advisable to verify the Slovak version of SHS on specific populations (children, seniors, minor - ities) and to examine the equivalence of different forms of administration (paper-and- pencil vs. tablet, smartphone, web applications).
1 With a permission from prof. Lyubomirsky, the Slovak adaptation of the SHS is available at:
https://osf.io/9nrek.
References
ABDEL-KHALEK, A. & D. LESTER(2006) ‘Optimism and Pessimism in Kuwaiti and American Col- lege Students’, International Journal of Social Psychiatry 52:2, 110–26(10.1177/0020764 006062092).
BECK, A.T., C.H. WARD, M. MENDELSONet al. (1961) ‘An Inventory for Measuring Depression’, Archives of General Psychiatry 4, 561–71.
BRADBURN, N.M. (1969) The Structure of Psychological Well-Being(Chicago: Aldine).
CALMAN, K.C. (1984) ‘Quality of Life in Cancer Patients: a Hypothesis’, Journal of Medical Ethics 10, 124–27.
CAMPBELL, A., P.E. CONVERSE& W.L. RODGERS(1976) The Quality of American Life (New York:
Russell Sage).
COHEN, A.B. (2002) ‘The Importance of Spirituality in Well-Being for Jews and Christians’, Jour- nal of Happiness Studies3, 287–310 (https://doi.org/10.1023/A:1020656823365).
DAMÁSIO, F., CH. ZANON& S.H. KOLLER(2013) ‘Validation and Psychometric Properties of the Brazilian Version of the Subjective Happiness Scale’, Universitas Psychologica 13:1, 17–24.
DEYOUNG, C.G., L.C. QUILTY& J.B. PETERSON(2007) ‘Between Facets and Domains: 10 Aspects of the Big Five’, Journal of Personality and Social Psychology 93, 880–96 (http://dx.doi.org/10.1037/0022-3514.93.5.880).
DIENER, E. (2000) ‘Subjective Well-Being: The Science of Happiness and a Proposal for a National Index’, American Psychologist 55, 34–43.
DIENER, E., R.A. EMMONS, R.J. LARSEN& S. GRIFFIN(1985) ‘The Satisfaction With Life Scale’, Journal of Personality Assessment 49, 71–75.
DIENER, E. & E. SUH(1997) ‘Measuring Quality of Life: Economic, Social, and Subjective Indi- cators’, Social Indicators Research 40, 189–216 (https://doi.org/10.1023/A:1006859 511756).
DOĞAN, T. & T. TOTAN(2013) ‘Psychometric Properties of Turkish Version of the Subjective Hap- piness Scale’, The Journal of Happiness & Well-Being 1:1, 20–27.
DŽUKA, J. (2013) ‘Multidimenzionálny model významných oblastí subjektívne hodnotenej kvality života a jeho empirické overenie – výsledky predvýskumu’ [A Multidimensional Model of Subjectively Assessed Quality Of Life: Results of a Pre-Research], Ceskoslovenska psy- chologie 57, 474–87.
DŽUKA, J. & C. DALBERT(2002) ‘Vývoj a overenie validity škál emocionálnej habituálnej subjek- tívnej pohody (SEHP)’ [Elaboration and Verification of Emotional Habitual Subjective Well- Being Scales (SEHP)], Ceskoslovenska psychologie 46, 234–50.
EFPA (2013) EFPA Review Model for the Description and Evaluation of Psychological and Edu- cational Tests, Test Review Form and Notes for Reviewers – Version 4.2.6., retrieved 2 Sep- tember 2015 from http://www.efpa.eu/professional-development.
EXTREMERA, N.P. & P. FERNÁNDEZ-BERROCAL(2014) ‘The Subjective Happiness Scale: Translation and Preliminary Psychometric Evaluation of a Spanish Version’, Social Indicators Research 119, 473–81 (http://dx.doi.org/10.1007/s11205-013-0497-2).
FRANCIS, L.J., S.H. JONES& C. WILCOX(2000) ‘Religiosity and Happiness: During Adolescence, Young Adulthood, and Later Life’, Journal of Psychology & Christianity19, 245–57.
GUNDELACH, P. & S. KREINER(2004) ‘Happiness and Life Satisfaction in Advanced European Coun- tries’, Cross-Cultural Research 38, 359–86 (https://doi.org/10.1177/1069397104267483).
HALAMA, P., L. ADAMOVOVÁ, M. HATOKOVÁ& M. STŘÍŽENEC(2006) Religiozita, spiritualita a osobnosť. Vybrané kapitoly z psychológie náboženstva [Religiosity, Spirituality and Per- sonality] (Bratislava: Úep SAV).