EMPLOYMENT AND HAPPINESS OF THE OLDER PEOPLE IN ROMANIA AND THE VISEGRÁD COUNTRIES: ANALYSIS OF
THE EUROPEAN QUALITY OF LIFE SURVEYS
Éva Berde*
Corvinus University of Budapest E-mail: eva.berde@uni-corvinus.hu
László Tőkés
Corvinus University of Budapest E-mail: laszlo.tokes@uni-corvinus.hu
(Received: January 2021; Accepted: March 2021; Published: May 2021)
Abstract: We used the last three waves of the European Quality of Life Surveys to analyze the happiness of older workers in Romania and the Visegrád countries. Applying ordinary least squares and ordered logit models we showed that being employed makes people happier ceteris paribus than being unemployed. This effect is the same for younger and older persons in the V4 countries, but there is an extra positive effect for older workers in Romania.
Keywords: European Quality of Life Surveys, older workers, happiness
JEL Classification: I31, J14
1. Introduction
It could be felt before the turn of the millennium, but afterward even more so that due to the aging of the European countries the governments were forced to tighten their pay-as-you-go pension systems. On the one hand, the tightening means a gradual increase in the retirement age, on the other hand, the nearly complete abolition of early retirement, and a shift from a "defined benefit" to a "defined contribution" system (König et al., 2016). Owing to the increased average life expectancy (Martin, 2018), and, in some cases, also financial needs, many people themselves choose to stay in the labor market for a longer period of time. The
*Corresponding author: Éva Berde. E-mail: eva.berde@uni-corvinus.hu
Copyright © 2021 The Author(s). Published by VGWU Press
This is an Open Access article distributed under the terms of the Creative Commons BY 4.0 license (Creative Commons — Attribution 4.0 International — CC BY 4.0) which permits unrestricted use, distribution, and reproduction in any medium, provided the original author and source are credited.
Quality of Life Surveys
legally guaranteed longer-term work and the increase of retirement age are beneficial for them. However, the tightening of pension rules has a negative impact on many European citizens. Berde & Rigó (2020) showed using the Hungarian and German European Working Condition Survey‘s data that as long as the retirement age in Hungary was low and it was easy to start retirement earlier, Hungarians workers beyond the retirement age were significantly more satisfied with their working conditions compared to their German peers. (The German retirement age was 65 at the beginning of the survey). After 2011, when not only the earlier increase of retirement age in Hungary reached a new level, but also all early retirement opportunities were eliminated almost without exception, older German workers proved to be more satisfied.
In general, the labor market participation of older people is increasingly needed in aging societies. With the help of the so-called Golden Age Index, the value of extra GDP due to the efficient use of the labor force of older people can be measured (Kratt & Kirnos 2020). Hawksworth et al. (2018) showed that, based on data from 2018 in OECD countries, GDP could be increased by a total of $ 3.5 trillion if the employment rate of older people in New Zealand† were reached. The case is similar in non-OECD countries.
However, the increase in the retirement age is more likely to have a negative effect on many people's satisfaction with working conditions and thus with life in general.
This is an aspect that needs to be taken into consideration. Employment of older workers can only be achieved effectively if the special needs of older workers are considered by employers and governments. As Blekesaune & Solem (2005) concluded, the deprivation of working autonomy of older workers, the many monotonously repetitive operational steps, and excessive physical tasks greatly reduce the efficiency of older workers. It is not about making exceptions for older people, but a more conscious consideration of their physiological needs, and also about the steps taken in the common interest of society. Siegrist et al. (2007) showed with the data analysis of SHARE (Survey of Health, Ageing and Retirement in Europe) that controlling for the psychosocial characteristics of work, almost all survey participants would have chosen to retire later. Based on these, they conclude that investing in better working conditions can greatly help workers to quit their jobs at a later age, and so such investments can bring significant benefits to society as a whole.
The aim of our study is to examine, in a very special circle, for the Visegrád-4 countries (Hungary, the Czech Republic, Poland, and Slovakia) and Romania, how
† In 2018 New Zealand was ranked second behind Iceland in the measure of how far different economies are harnessing the power of their older workers.
the satisfaction of older workers developed after the turn of the millennium. The chosen group of countries is different from most European Union countries in terms of pension reforms and employment of older people. In all five countries, the restriction of pension rules started later than in most European Union countries. In all five countries, the employment rate of older people was still much lower than in most European Union countries immediately after the turn of the millennium. In terms of employment rates, Hungary decreased its disadvantage the most, but the other three V4 countries have also caught up. In Romania, this catchup can only be said for the less old. The aim of our article is to examine how the work of those at the age of 55 and over has affected their happiness, based on data from the European Quality of Life Survey (EQLS). Using the 2008, 2012, and 2016 waves of the survey (these are the last three of the four waves published so far), we are analyzing data from the years when pension cuts had less of an impact. We compare our results with the calculations of Berde & Tőkés (2020) for the whole European Union and draw our conclusions based on them.
The structure of our article is the following: after the introduction, in Section 2 we present some important literature references on employment of senior citizens of Romania and the Visegrad-4 countries, in Section 3, we show how rapidly the employment of older people in Visegrád-4 countries and in Romania has increased since the turn of the millennium. Section 4 describes the characteristics of the EQLS, and the variables used in the estimation. In Section 5 we present the data used, and then, in Section 6 we describe the methodology. The results of the model are presented in Section 7. In Section 8, we focus on Romania and Hungary and compare the results with the ones presented in Berde & Tőkés (2020) about the whole European Union and we also conclude.
2. Literature review
Meleckỳ & Skokan (2011) showed a decade ago that although there are significant differences in the economic development of the Visegrád-4 countries, the employment of the grey-haired has increased in all the four countries – and this is a positive phenomenon in the light of population aging. Considering individual satisfaction, persons, of course, enjoy free time, if they have no financial problems.
Although, as Wright & Hamilton (1978) show, work satisfaction increases general life satisfaction, and this is also true in older ages. But within-country income inequalities (see for example the paper of Neagu et al., 2016 about the eastern European countries) make old-age working a must for many persons, and so it decreases their satisfaction.
Fuchs (1982) analyzes the employment of older persons in the United States. The author shows that older and highly qualified, white Americans become self-
Quality of Life Surveys
employed very often. If self-employment is voluntary and not because of external pressure, they can avoid wage decrease later and they earn more than their non- self-employed peers. Although this phenomenon is a bit different in the Visegrád-4 countries. Dvouletỳ et al. (2019) show that apart from the star entrepreneurs, individual entrepreneurs, in particular solo entrepreneurs, who are not job creators, earn less than their employed peers, and it is even truer for the older ones.
Today, older persons should face age discrimination both at their workplace and during their search for a job. There are two kinds of age discrimination. On one hand, statistical discrimination is based on previous experiences – that can be real or suspected – that older employees are less able and willing to learn new technologies and are less likely to accept their younger bosses and colleagues (Arrow, 1973). On the other hand, taste-based discrimination is classical ageism (Becker, 1957).
Both the USA and European countries could be characterized by low retirement age and early retirement schemes in the 1950-1980s. Although, there were many early warnings – see for example Gafafer (1957) – that the system is unsustainable.
Despite the concerned voices, the decrease of the retirement age and the expansion of early retirement schemes were continued in the European countries. And so, years spent in retirement were also increasing, see for example Walker (1999).
Decision-makers started to tighten the systems in the 2000s, and this is also the point when nations started to move from the defined benefit system to the defined contribution system.
Romania started to implement the above-mentioned measurements a bit later, although the transition was a kind of from austerity to austerity, as Adascalitei (2017) explains since the problems of the Romanian pension system were different from the ones of the other European systems. Balteș et al. (2018) state that in order to make the Romanian system sustainable, further reforms are needed. Jimon et al.
(2020) also highlight that due to the consecutive change of the population structure, it is not enough to analyze the current problems, but future changes should be also considered, and the policy measurements should be forward-looking.
Unavoidable and forced tightening of the pension systems all around Europe should be implemented with caution to avoid the decrease of older employees' satisfaction. Steptoe & Fancourt (2019) show that well-organized working progress can be beneficial for older employees and so increase social utility.
3. Employment trends in Romania and the Visegrád-4 countries
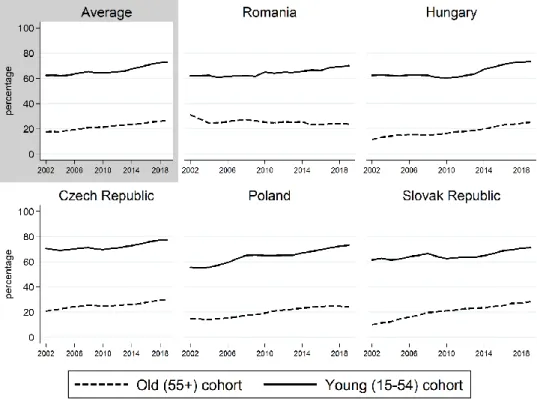
Figure 1 below shows the development of the employment ratios in time for Romania and the Visegrád-4 countries (further V4 countries), as well as the average of the five countries between 2002 and 2018. We distinguish between two cohorts: the old cohort (55 or older) and the young cohort (15-54). The National Institute of Statistics of Romania (i.e. the statistical office of Romania) adopted the definitions and methodologies of the European National System of Accounts in 2002, so the figure shows data from that year.
Figure 1 Employment ratios for the old and young cohorts in Romania and the V4 countries
Source: Authors‘ own calculations based on Eurostat data
Focusing on the employment ratio of the grey-haired, it is clear that the Romanian trend differs from the ones of the V4 countries. Considering the first plot, the average employment ratio of the five analyzed countries shows an increasing trend, although, comparing the data of the individual countries, it is also clear that the Romania data do not show this positive trend. Table 1 presents the trend growth
Quality of Life Surveys
rates for both cohorts. As the calculations show, the yearly trend growth in the five examined countries was 0.542 percentage points. All the Visegrád-4 countries show positive growth rates (although with a great variability), only Romania presents a negative trend in the age group 55+. It should be noted – as can also be recognized observing Figure 1 – that there was a big drop in 2003 and 2004, then the employment ratio seems to be rather constant, showing only a smaller fluctuation.
Table 1 Yearly trend growth rates of the employment ratios of the older cohort between 2002 and 2019
Country Old (55+) cohort Young (15-54) cohort
Romania -0.254 0.495
Hungary 0.744 0.693
Czech Republic 0.453 0.452
Poland 0.742 1.040
Slovak Republic 1.024 0.483
Average 0.542 0.633
Source: Authors‘ own calculations based on Eurostat data
Trend growth rate means the slope of the linear regression line fitted using ordinary least squares methodology on the actual data. All rates are significant on the 1%
level.
The results are more homogenous in the case of the younger cohort, where there is a positive trend on average, and all the individual countries present positive trends, as well. Detailed information can be seen in Table 1.
So, summing up, the old-age employment ratio is growing in the Visegrád-4 countries, while after a significant drop at the beginning of the 2000s, it stagnates in Romania.
4. The European Quality of Life Surveys (EQLS), 2003-2016
The European Quality of Life Surveys (EQLSffi in the followings) is a survey conducted every four years, examining the life quality of European citizens in many dimensions. The survey is carried out for private households, and conducted via personal interviews (in some countries via phone). The size of the surveyed sample varies by the waves, see the details later. There are a lot of questions in the survey, and the results are collected in hundreds of variables that can be categorized into three main groups: objective life circumstances, the surveyed
‡ Detailed description:
https://www.eurofound.europa.eu/hu/surveys/european-quality-of-life-surveys
person‘s feelings about his/her own circumstances, and subjective life circumstances. Questions are focusing on several aspects of life: labor market activity, household income, education, housing circumstances, family details, health and education, work-life balance, subjective welfare and happiness, life satisfaction, etc. Using the data of the survey economic, demographic, and social issues can be analyzed both in time and space.
Four waves of the survey have been carried out so far:
Wave 1: In the year 2003, for the member countries of the European Union (in 2012) and Turkey. About 26,000 persons were interviewed.
Wave 2: In the year 2007, for the member countries of the European Union (in 2020) and Turkey, Croatia, FYR Macedonia, and Norway. About 35,000 persons were interviewed.
Wave 3: In the year 2011, for the member countries of the European Union (in 2020) and Turkey, Croatia, FYR Macedonia, Iceland, Montenegro, Serbia, and Kosovo. About 43,500 persons were interviewed.
Wave 4: In the year 2016, for the member countries of the European Union (in 2020) and Turkey, FYR Macedonia, Montenegro, Serbia, and Albania.
About 37,000 persons were interviewed.
In this analysis, we use the data of Romania, and the Visegrád-4 countries, i.e.
Hungary, the Czech Republic, Poland, and the Slovak Republic.
5. Data used in the analysis
In this chapter, we describe in detail the variables used in the analysis, and we also present the most important descriptive statistics. We also define the way we create our final sample.
5.1. Creating the final sample
We made some restrictions that made the full sample shrunk, and the final sample that was used in the analysis is smaller than the original dataset. The following changes were made:
We dropped the first wave (year 2003) since some regression variables were not defined.
We dropped persons who are irrelevant according to the analysis: students and persons younger than 16 were removed.
We dropped persons with unknown labor market status and persons where other variables were missing.
Table 2 shows the country distribution of the original sample and the final sample that was used in the regression models for analysis.
Quality of Life Surveys
Table 2 Number of surveyed persons in the original and final samples Country Original sample Regression sample
Romania 4,576 2,876
Hungary 4,067 2,591
Czech Republic 4,248 2,835
Poland 5,771 3,854
Slovak Republic 4,218 2,672
Total 22,880 14,828
Source: Authors‘ own calculations
So, the final regression sample contains 14,828 persons. In the following we present the definitions and the most important descriptive statistics of the variables we used in the regression models.
5.2. The dependent variable
We focus on Question 5 (Question 41 in the earlier waves) from the survey, which tries to measure the general happiness of the surveyed person. The question is the following§:
―Taking all things together on a scale of 1 to 10, how happy would you say you are?
Here 1 means you are very unhappy and 10 means you are very happy.‖
So, the dependent variable is measured on a Likert-type scale with 10 values: 1 to 10. Table 3 shows its distribution in the analyzed countries.
Table 3 The distribution of the dependent variable Likert
value Romania Hungary Czech
Republic Poland Slovak
Republic Total
1 91 48 12 31 30 212
2 75 56 17 51 22 221
3 105 100 68 105 64 442
4 149 109 111 126 112 607
5 359 362 362 468 393 1,944
6 320 311 325 397 326 1,679
7 545 454 609 632 525 2,765
8 624 622 723 972 585 3,526
9 348 276 376 496 363 1,859
10 260 253 232 576 252 1,573
Source: Authors‘ own calculations
§ The questionnaire can be download from the following hyperlink:
https://www.eurofound.europa.eu/sites/default/files/ef_survey/field_ef_documents/4th_eqls_final_ma ster_source_questionnaire_12_june_2017_-_updated_07_september_2017.pdf
5.3. The independent variables
We use several independent variables to make the estimation more precise – see the details later, when we define the estimation equation. In this subsection, we give the definition and also present the descriptive statistics of the independent variables we use. The main independent variables are the following: wave, country, sex, education, social exclusion, deprivation, health status, labor market status, living alone, and age.
Wave
As we have mentioned before, the first wave of the survey is not used due to missing variables. We include wave dummy variables, which can be interpreted as time fixed effects. The distribution of the observations by the wave is the following:
Wave 1: 4,968 persons (33.5% of the regression sample).
Wave 2: 5,403 persons (36.4% of the regression sample).
Wave 3: 4,457 persons (30.1% of the regression sample).
Country of the observed person
In the regressions, we control for the country where the surveyed person lives. This piece of information is also included in the form of dummy variables, so can be interpreted as country fixed effects. The distribution of the sample by country is presented in Table 2.
Sex of the observed person
The regression sample contains 6,149 males and 8,679 females.
Education of the observed person
The education variable shows the highest education of the surveyed person and has three disjunct values: primary (1,035 persons), secondary (11,432 persons), and tertiary (2,361 persons). Education is included in the regression models in the form of dummy variables.
Social exclusion of the observed person
An index is constructed based on four questions measuring the social exclusion of the observed person:
I feel left out of society.
Life has become so complicated today that I almost can‘t find my way.
I feel that the value of what I do is not recognized by others.
Some people look down on me because of my job situation or income.
All four questions are measured on a Likert-scale with five values (from 1 to 5), where higher scores mean smaller exclusion. The Social Exclusion Index (SEI) is the simple average of the scores given for the four questions, so it is also measured on a 5-value scale. Figure 2 shows its distribution.
Quality of Life Surveys
Figure 2 Distribution of the Social Exclusion Index Source: Authors‘ own calculations
Deprivation of the observed person
The Deprivation Index (DI) shows the number of things that the surveyed person‘s household cannot afford. Six items were listed, so the index can take values between 0 and 6. The six items are the following:
Keeping your home adequately warm.
Paying for a week‘s annual holiday away from home (not staying with relatives).
Replacing any worn-out furniture.
A meal with meat, chicken, fish every second day if you wanted it.
Buying new, rather than second-hand, clothes.
Having friends or family for a drink or meal at least once a month.
0 5 10 15 20
percent
1 1.5 2 2.5 3 3.5 4 4.5 5
Figure 3 Distribution of the Deprivation Index Source: Authors‘ own calculations.
The Deprivation Index is an indirect indicator of the household‘s income status.
The higher the value of the index, the more deprived is the household.
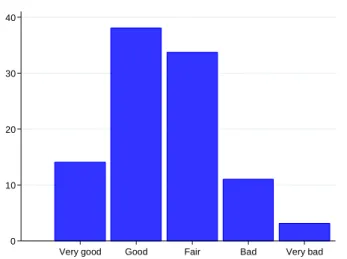
Health status of the observed person
Health status is measured on a five-point Likert scale and is defined by the interviewed person himself/herself. The question the surveyed person should answer is the following: In general, how is your health? Figure 4 shows the distribution of the answers to this question.
Figure 4 Distribution of the subjective health status Source: Authors‘ own calculations
0 10 20 30 40
percent
0 1 2 3 4 5 6
0 10 20 30 40
percent
Very good Good Fair Bad Very bad
Quality of Life Surveys
Labor market variables
According to the labor market status, four disjunct categories were created:
unemployed, employed, retired, homemaker. We included these categories in the regression models as dummy variables. Table 4 shows the distribution.
Table 4 Distribution of the labor status dummy variables Variable Unemployed Retired Employed Homemaker Equals to 0 13,992
(94.36%)
9,302 (62.73%)
7,089 (47.81%)
14,101 (95.10%) Equals to 1 836
(5.64 %)
5,526 (37.27%)
7,739 (52.19%)
727 (4.90%) Source: Authors‘ own calculations
In the regression models, we measure the heterogeneity in the effect of employment on happiness by age, so we compare the effects of employment between older and younger cohorts. The details are presented in the methodological section.
Two more independent variables
We also control for age and household size using the following two dummy variables:
Living alone: It is a dummy variable which equals 1 if the surveyed person lives alone (i.e. number of persons in the household is 1), and 0 otherwise.
Old: It is a dummy variable which equals to 1 if the surveyed person is 55 years old, or older, and 0 otherwise.
Table 5 shows the distribution of the two above-mentioned dummy variables.
Table 5 Distribution of the living alone and old dummy variables
Variable Living alone Old
Equals to 0 11,855
(79.95%)
8,319 (56.10%)
Equals to 1 2,973
(20.05%)
6,509 (43.90%) Source: Authors‘ own calculations
Weights
We use weights published by the dataset and recommended for analysis.
6. Research methodology
The dependent variable in our analysis is a variable that is measured on a Likert scale with ten different values, so it is measured on an ordinal scale: higher values
mean higher happiness. Although the method of ordinary least squares (OLS) is not an absolutely adequate method for such independent variables, it is a common practice to use it despite, in particular when the ordinal variable has more values – like in our case. However, a more adequate methodology is the ordered logit model. In this paper we present the results of both models: on one hand, the interpretation of OLS results is more straightforward, on the other hand, the results of ordered logit are more robust.
In the ordered logit model an observed y, measured on an ordinal scale, is the dependent variable, which is a function of an unobserved, latent variable, y*. For person i, we specify:
(1)
Considering an m-alternative ordered logit model, we define:
if , and where and Then:
( ) ( ( )=
( ) ( ) ( ) (2) where F is the cumulative distribution function of , and we obtain the regression parameters β, and the (m-1) threshold parameters, ,…, by maximizing the
( ) likelihood function defined above. The interpretation of the estimated coefficients is different from the interpretation of the OLS-coefficients, although the meaning of the signs is straightforward: positive sign means that as the particular variable increases, the probability of the independent variable takes a higher value also increases.
The following model, denoted by Equation (3) is estimated in this paper:
∑
∑
(3) Where: and are the dummy variables indicating the 3rd and 4th waves (reference category is Wave 2), is a vector of country dummy variables (reference category is the Czech Republic), is a dummy variable indicating the sex of person i, and are dummy variables indicating secondary and tertiary education (reference category is primary education), is the Social Exclusion Index, is the Deprivation Index, is a vector of dummy variables characterizing the health status (reference category is Very good), is a dummy variable for living alone, is a dummy variable indicating that the person is 55 years old or older, , , and are the dummy variables indicating the labor market status (reference
Quality of Life Surveys
category is the unemployed). Subsection 3.3 shows the detailed description of the variables.
The key variables of our analysis are the last items in equation (3), the vector of the interaction terms aimed to measure the heterogeneity of the effects. They are defined as the product of the following three variables: country, old, and employed.
So, the coefficients show how the effect of employment differs in the older cohort in the analyzed countries. In the next subsection, we present the results, focusing on these key coefficients.
7. Results
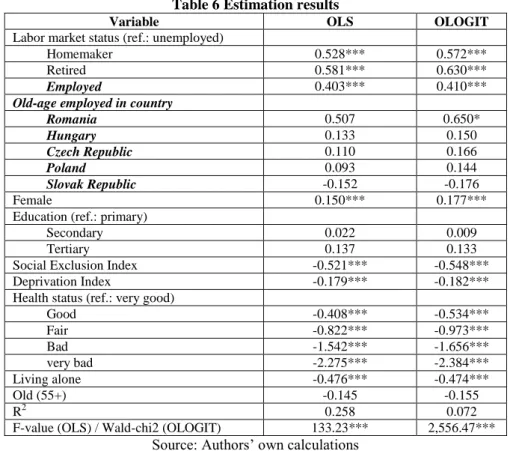
Table 6 shows the results based on equation (3) described in Section 6 using both the OLS and ordered logit models.
Table 6 Estimation results
Variable OLS OLOGIT
Labor market status (ref.: unemployed)
Homemaker 0.528*** 0.572***
Retired 0.581*** 0.630***
Employed 0.403*** 0.410***
Old-age employed in country
Romania 0.507 0.650*
Hungary 0.133 0.150
Czech Republic 0.110 0.166
Poland 0.093 0.144
Slovak Republic -0.152 -0.176
Female 0.150*** 0.177***
Education (ref.: primary)
Secondary 0.022 0.009
Tertiary 0.137 0.133
Social Exclusion Index -0.521*** -0.548***
Deprivation Index -0.179*** -0.182***
Health status (ref.: very good)
Good -0.408*** -0.534***
Fair -0.822*** -0.973***
Bad -1.542*** -1.656***
very bad -2.275*** -2.384***
Living alone -0.476*** -0.474***
Old (55+) -0.145 -0.155
R2 0.258 0.072
F-value (OLS) / Wald-chi2 (OLOGIT) 133.23*** 2,556.47***
Source: Authors‘ own calculations
N =14,828. *** = significant on 1%, ** = significant on 5%, * = significant on 10%. Estimations are based on equation (3). Estimations contain wave and country dummy variables as well. R2 in the case of the ordered logit model is McFadden‘s pseudo-R2.
The sign of the control variables is fairly intuitive, now we focus only on the key variables of interest that are also highlighted in Table 5. The coefficient of the employed dummy variable is positive and significant in both estimations that means that a ceteris paribus employed person is happier in general than an unemployed one. For the V4 countries, there is no extra old-age effect: as the coefficients of the interaction terms are statistically insignificant, it means that being employed does not make the grey-haired more or less happy than it makes the younger cohort, i.e. the effect of being employed is the same in the case of both the young and older cohorts. On the other hand, the Romanian case is different. As we can see, there is a positive and significant** coefficient for the Romanian interaction term that means that being employed makes the older generations happier than the younger ones in Romania.
8. Conclusions and discussions
In the case of Romania and Hungary, the aging of society is a serious issue. Cristea et al. (2016) note that the increase of deaths exceeds the number of births, leading to a decrease in the population in Romania. This process goes hand in hand with an increase in the number of older people in the whole population, who are less and less likeably to be covered by the Romanian pay-as-you-go social security component of the pension pillars. Regarding population decline, Spéder &
Kamarás, 2008) reach a similar conclusion for Hungary. The pay-as-you-go system is becoming less and less able to provide for retirees (Lakner & Tausz, 2016).
Adascalitei (2017) considers the Romanian pension system to be a moderately generous system, and for now, even the Hungarian pension system is able to provide some kind of livelihood for most pensioners (Szabó, 2017). In the case of Romania this is presented by Profiroiu et al. (2019), and in the case of Hungary by Ádám & Simonovits (2019).
In response to problems related to the budget deficit of the pension system, certain tightening of pension rules was introduced earlier in Hungary and relatively later in Romania. However, in the founder countries of the European Union, increasing the retirement age and eliminating the possibility of early retirement began a decade earlier than in Hungary. Older workers, although their needs differ in some respects from those of their younger colleagues, are not considered to be less efficient in work in most areas, and often more effective than the younger ones (Warr, 1995).
However, if employers do not pay enough attention to the slightly modified needs of their older employees, it will negatively affect the satisfaction of their employees.
**The coefficient is almost significant on the 10% level in the OLS estimation.
Quality of Life Surveys
Berde & Tőkés (2020) analyzed the life satisfaction of older workers in the European Union using the European Quality of Life Surveys. They concluded that being employed increased life satisfaction compared with being unemployed ceteris paribus. Although, this positive effect is smaller for the 55+ cohort.
The results of this paper kind of contradict the results of the paper mentioned above. Although, it should be noted that the dependent variables of the two papers are different: in this paper, we analyze happiness, while Berde & Tőkés (2020) analyze life satisfaction. From one aspect, the message of the two papers is the same: being employed makes a person more satisfied/happy than being unemployed. Although, for the EU as a whole, the positive satisfaction effect is smaller for the 55+ aged cohort, while in this paper we got that there is an extra positive effect on happiness for older persons in Romania, and no significant extra effect (neither positive nor negative) in the V4 countries.
Making these results more robust, further analysis is needed. Although, if we accept that across-the-board compulsory employment in older ages decreases life satisfaction, then the following should be considered. Since late-life labor market activity is unavoidable due to population aging and the increase of healthy life years, the last years in work should be organized to be as efficient as can be. The special needs of older workers should be considered, and their working conditions should be restructured in a reasonable way.
Acknowledgments
The authors thank the anonymous reviewers and editor for their valuable contribution.
Funding
This publication / research has been supported by the European Union and Hungary and co-financed by the European Social Fund through the project EFOP- 3.6.2-16-2017-00017, titled "Sustainable, intelligent and inclusive regional and city models".
Author Contributions
The authors have contributed equally to this article.
Disclosure Statement
The authors have not any competing financial, professional, or personal interests from other parties.
References
1. Ádám, Z., András S., (2019), From Democratic to Authoritarian Populism:
Comparing Pre-and Post-2010 Hungarian Pension Policies, Acta Oeconomica 69(3): 333–55
2. Adascalitei, D., (2017), From Austerity to Austerity: The Political Economy of Public Pension Reforms in Romania and Bulgaria, Social Policy & Administration 51(3): 464–87
3. Arrow, K., (1973), The Theory of Discrimination, Discrimination in labor markets 3(10): 3–33
4. Balteș, N., Dumiter, F., David, D., Jimon, Ș., (2018), Trends Regarding the Evolution of the Romanian Pension System, Studia Universitatis „Vasile Goldis‖
Arad–Economics Series 28(1): 1–16
5. Becker, G.S., (1957), The Economics of Discrimination. University of Chicago Press
6. Berde, É., Mariann, R., (2020), Job Satisfaction at Older Ages, Zeitschrift für Gerontologie und Geriatrie 53(1): 44–50
7. Berde, É., Tőkés, L., (2020), Employment and life satisfaction of the elderly:
Analysis of the European Quality of Life Surveys‘ data, Corvinus University of Budapest
8. Blekesaune, M., Per Erik, S., (2005), Working Conditions and Early Retirement:
A Prospective Study of Retirement Behavior, Research on Aging 27(1): 3–30 9. Cristea, M., Marcu, N., Cercelaru, O.V., (2016), Longer Life with Worsening Pension System? Aging Population Impact on the Pension System in Two Countries: Romania and Croatia, Economic and Social Development: Book of Proceedings: 28
10. Dvouletỳ, O., Procházka D.A., Starnawska, M., (2019), Who Earns More: Job Creators, Solo-Entrepreneurs or Employees? Empirical Evidence from Visegrad Countries, International Journal of Entrepreneurship and Small Business 1(1): 1–14 11. Fuchs, V.R., (1982), Self-Employment and Labor Force Participation of Older Males, Journal of Human Resources: 339–57
12. Gafafer, W.M., (1957), Employment and Retirement of Elderly Workers, Public Health Reports 72(12): 1060
13. Hawksworth, J., Stubbings, C., Cheung, C., Utkarshini, S., Goel, S., (2018),
―PwC Golden Age Index: Unlocking a Potential $3.5 Trillion Prize from Longer Working Lives.
14. Jimon, Ș., Balteș, N., Dumiter, F., (2020), Empirical Approaches Upon Pension Systems in Central and Eastern European Countries. Triangle Assessment: Free Movement of People, Labor Market and Population Health Features, Studia Universitatis „Vasile Goldis‖ Arad, Economics Series 30(1): 1–21
15. König, S., Moritz, H., Hofäcker, D., (2016), Trends and Determinants of Retirement Transition in Europe, the USA and Japan: A Comparative Overview, In
Quality of Life Surveys
Delaying Retirement, Springer, 23–51
16. Kratt, O., Kirnos, I., (2020), Cross-National Analysis of the Older Workers‘
Employment Rate, In SHS Web of Conferences, EDP Sciences, 01014
17. Lakner, Z., Tausz, K., (2016), From a Welfare to a Workfare State: Hungary, In Challenges to European Welfare Systems, Springer, 325–50
18. Martin, J.P., (2018), Live Longer, Work Longer: The Changing Nature of the Labour Market for Older Workers in OECD Countries, IZA, 11510 Discussion Paper Series
19. Meleckỳ, L., Skokan, K., (2011), EU Cohesion and Its Evaluation in the Case of Visegrad Four Countries, In Liberec Economic Forum 2011. Proceedings of the 10th International Conference, 314–26
20. Neagu, O., Dumiter, F., Braica, A., (2016), Inequality, Economic Growth and Trade Openness: A Case Study for Central and Eastern European Countries (ECE).‖ Amfiteatru Economic Journal 18(43): 557–74
21. Profiroiu, A., Burlacu, S., Sabie, O., (2019), Reform of the Pension System in Romania, Calitatea 20(S2): 521–24
22. Siegrist, J. et al., (2007), Quality of Work, Well-Being, and Intended Early Retirement of Older Employees—Baseline Results from the SHARE Study, The European Journal of Public Health 17(1): 62–68
23. Spéder, Z., Kamarás, F., (2008), Hungary: Secular Fertility Decline with Distinct Period Fluctuations, Demographic research 19: 599–664
24. Steptoe, A., Fancourt, D., (2019), Leading a Meaningful Life at Older Ages and Its Relationship with Social Engagement, Prosperity, Health, Biology, and Time Use, Proceedings of the National Academy of Sciences 116(4): 1207–12
25. Szabó, Z., (2017), The Modelling and Simulation of the Pension System, In 2017 IEEE 30th Neumann Colloquium (NC), IEEE, 000025–000028
26. Walker, A., (1999), Attitudes to Population Ageing in Europe, A Comparison of the 1992 and 1999, Eurobarometer Surveys
27. Warr, P., (1995), Age and Job Performance, in Snel, J., Cremer, R. (Hg.) (1995): Work and aging. An European perspective, S: 309–22
28. Wright, J.D., Hamilton, R.F., (1978), Work Satisfaction and Age: Some Evidence for the ‗Job Change‘ Hypothesis, Social Forces 56(4): 1140–58