Ethology practical
Vilmos Altbäcker Márta Gácsi András Kosztolányi
Ákos Pogány Gabriella Lakatos
Péter Pongrácz
Ethology practical
by Vilmos Altbäcker, Márta Gácsi, András Kosztolányi, Ákos Pogány, Gabriella Lakatos, and Péter Pongrácz Copyright © 2013 Eötvös Loránd University
This book is freely available for research and educational purposes. Reproduction in any form is prohibited without written permission of the owner.
Made in the project entitled "E-learning scientific content development in ELTE TTK" with number TÁMOP-4.1.2.A/1-11/1-2011-0073.
Consortium leader: Eötvös Loránd University, Consortium Members: ELTE Faculties of Science Student Foundation, ITStudy Hungary Ltd.
Table of Contents
I. Field ethology – Conducting behavioral observations in the Budapest Zoo ... 1
1. OBJECTIVES ... 1
2.INTRODUCTION ... 1
2.1 The design of a scientific research study ... 1
2.2 Components of behaviour ... 1
2.3 The subjects of an ethological study ... 3
2.4 How can we collect behavioural data? ... 3
3. MATERIALS ... 4
3.1 Location ... 4
3.2 Subjects ... 4
3.3 Materials ... 4
4. CONDUCTING THE FIELD OBSERVATION AT THE ZOO ... 5
4.1 Goals ... 5
4.2 Time range of the observations ... 5
4.3 Field report and data sheets ... 5
4.4 Written report ... 5
4.5 The evaluation of the report ... 6
5. LITERATURE CITED ... 8
II. The ontogeny of antipredator behavior in fish fry ... 9
1. OBJECTIVES ... 9
2. INTRODUCTION ... 9
2.1 Antipredator behaviour ... 9
2.2 Predator recognition ... 9
2.3 Inherited recognition of predators ... 10
2.4 Predator avoidance and the ontogeny ... 10
3. MATERIALS ... 12
3.1 Test subjects ... 12
3.2 Experimental device ... 12
4. PROCEDURE ... 12
4.1 Goal of the practical ... 12
4.2 Experimental process ... 13
4.3 Experimental groups ... 13
4.4 Data analysis and the presentation of the results ... 13
4.5 Preparing a report ... 14
4.6 Evaluation of the report ... 14
5. LITERATURE CITED ... 14
III. Search image formation in domestic chicken ... 16
1. OBJECTIVES ... 16
2. INTRODUCTION ... 16
5. LITERATURE CITED ... 20
IV. Operant conditioning in the practice ... 22
1. OBJECTIVES ... 22
2. INTRODUCTION ... 22
2.1 Theoretical Overview ... 22
2.2 General forms of learning ... 22
2.3 Operant conditioning as a training method: clicker training ... 24
3. MATERIALS AND METHODS ... 24
3.1. Experimental animals and equipment ... 25
3.2. Procedure ... 25
4. DATA COLLECTION ... 25
4.1. Practicing the method on mates – shaping the behaviour ... 25
4.2 Operant conditioning with dogs ... 25
4.3. Preparation of a report ... 27
4.4. General evaluation – Considerations for the discussion ... 28
REFERENCES CITED ... 30
V. The effect of imprinting on the behaviour of domestic chicken ... 32
1. OBJECTIVES ... 32
2. INTRODUCTION ... 32
2.1 Filial imprinting ... 32
2.2 Sexual imprinting ... 32
3. METHODS ... 32
3.1 Tests ... 33
LITERATURE CITED ... 36
VI. The effect of early human contact on the timidity of rabbits ... 37
1. OBJECTIVES ... 37
2. INTRODUCTION ... 37
2.1 Conspecific recognition of hand raised rabbits ... 37
2.2 Conspecific recognition is based on smell in rabbits ... 38
3. METHODS ... 38
3.1 Experimental animals ... 38
4. STEPS OF THE PRACTICAL ... 39
LITERATURE CITED ... 40
VII. Study of chin marking behaviour in the european rabbit ... 42
1. OBJECTIVES ... 42
2. INTRODUCTION ... 42
2.1 Chemical communication in mammals ... 42
2.2 Sexual communication in the European rabbit ... 43
2.3 Chin marking in the rabbit ... 43
LITERATURE CITED ... 48
VIII. The effect of warning coloration on zebra finch (Taeniopygia guttata) boldness ... 50
1. OBJECTIVES ... 50
2. INTRODUCTION ... 50
2.1. Theoretical background of warning colorations ... 50
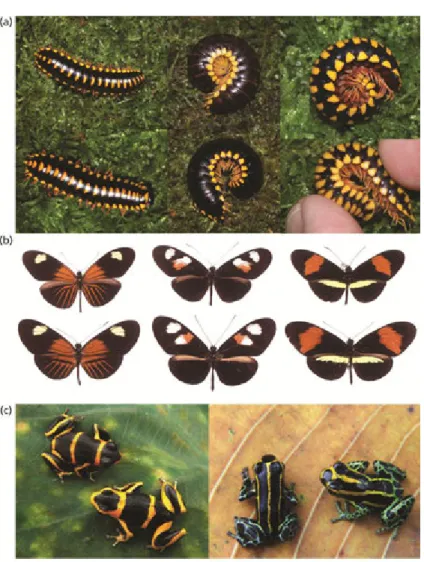
2.2 Aposematic coloration ... 51
2.3 Aposematism and mimicry ... 51
2.4 Animal personality and boldness ... 53
3. MATERIALS ... 53
4. PROCEDURE ... 54
4.1 Aims ... 54
4.2 Experimental steps ... 54
LITERATURE CITED ... 55
IX. Human sexual dimorphism ... 57
1. OBJECTIVES ... 57
2. INTRODUCTION ... 57
2.1 Background ... 57
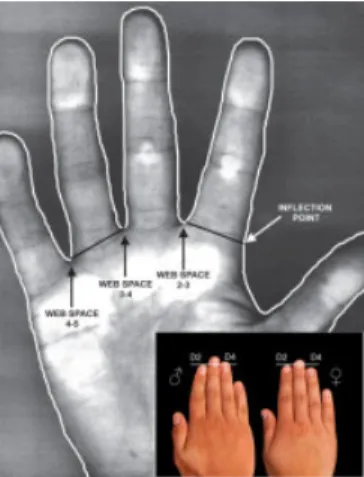
2.2 Sexual dimorphism in humans ... 59
3. MATERIALS ... 61
3.1 Subjects and equipment ... 61
4. PROCEDURE ... 61
4.1 Aim of the study ... 61
4.2 Steps of the study ... 61
4.3 Preparation of the study notes ... 62
REFERENCES CITED ... 63
X. Human sexual selection: female and male preferences ... 65
1. OBJECTIVES ... 65
2. INTRODUCTION ... 65
2.1 Background ... 65
2.2 Body size ... 66
2.2 Preferred body ratios ... 66
2.3 Voice as sexual character ... 67
2.4 Preference for acoustical parameters ... 67
3. MATERIALS... 68
3.1 Subjects and equipment ... 68 Ethology practical
4. PROCEDURE... 68
4.1 Aim of the study: ... 68
REFERENCES ... 70
XI. How intrauterine development affects later rank and anogenital distance in rabbits ... 72
1. OBJECTIVES ... 72
2. INTRODUCTION ... 72
2.1 Hormones and behaviour ... 72
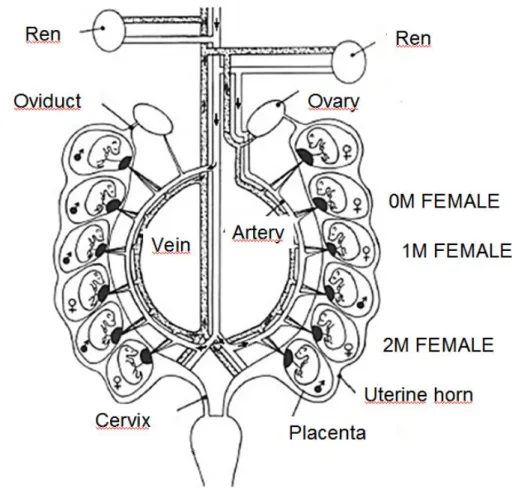
2.2 Prenatal hormonal effects ... 72
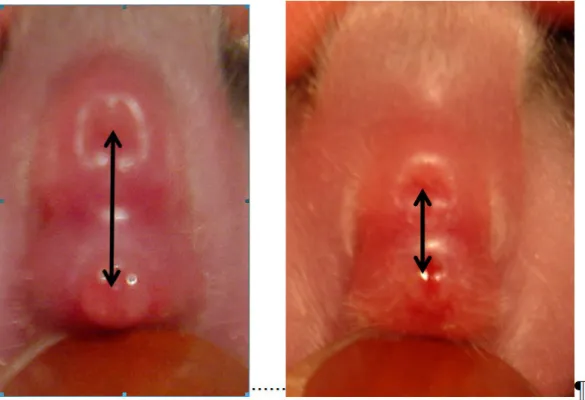
AGD as a biomarker ... 74
Sexual differentiation in rabbits ... 75
Social system of rabbits ... 76
3. MATERIALS ... 76
3.1 Experimental animals and methods ... 76
4. Procedure ... 76
4.1 Goal of the practical ... 76
4.2 Steps to be followed: ... 77
LITERATURE CITED ... 77
XII. Risk taking in animals and humans: gender effects ... 79
1. OBJECTIVES ... 79
2. INTRODUCTION ... 79
3. MATERIALS AND METHODS ... 80
LITERATURE CITED ... 82
XIII. Huddling behaviour in mice ... 84
1. OBJECTIVES ... 84
2. INTRODUCTION ... 84
2.1 Animal groups ... 84
2.2 Types of groups ... 84
2.3 The cooperative mound- building mice ... 86
2.4 Conspecific and kin recognition in mice ... 87
2.5 Huddling ... 88
3. MATERIALS AND METHODS ... 88
4. PROCEDURE ... 88
4.1 The goal of the practical: ... 88
4.2 Steps to be done during the practical ... 89
LITERATURE CITED ... 90
XIV. Factors affecting the shoal formation in the zebrafish (Brachydaniorerio) ... 93
1. OBJECTIVES ... 93
2. INTRODUCTION ... 93
2.1 Costs and benefits of living in a group ... 93
2.2 Shoal formation in fish ... 94
2.3 Investigating shoal formation in the zebrafish ... 95
3. MATERIALS ... 98
3.1 Subjects ... 98
3.2 Testing aquarium ... 98
3.3 Experimental groups ... 98
4. PROCEDURE ... 98
4.1 Experiment 1: testing social attraction to conspecifics ... 98
4.2 Experiment 2: testing phenotypic features that may affect social attraction in the zebrafish ... 99
4. 3 Data analysis ... 99
LITERATURE CITED ... 100
XV. Aggression and dominance in the house mouse ... 101
1.OBJECTIVES ... 101
2. INTRODUCTION ... 101
2.1 Group formation ... 101
2.2 Aggression ... 101
2.3 Social rank ... 102 Ethology practical
2.5 The Social system of the house mouse ... 103
3. MATERIALS AND METHODS ... 103
3.1 ANIMALS ... 103
3.2 METHODS ... 103
4. PROCEDURE ... 104
LITERATURE CITED ... 106
XVI. Group effect on human vigilance during feeding ... 108
1. OBJECTIVES ... 108
2. INTRODUCTION ... 108
2.1 Group formation as a means to reduce predation risk ... 108
2.2 Grouping and vigilance in animals ... 108
2.3 Group size and level of vigilance in apes ... 109
3. MATERIALS ... 109
3.1 Studied subjects and necessary tools ... 109
4. PROCEDURE ... 109
4.1 Steps to be followed ... 110
4.2 Statistical analyses ... 110
4.3 Questions for discussion ... 110
LITERATURE CITED ... 113
XVII. Ethological study of the dog’s attachment behaviour ... 114
1. OBJECTIVES ... 114
2. INTRODUCTION ... 114
2.1 Theoretical Overview ... 114
3. MATERIALS ... 117
3.1 Subjects and tools ... 117
4 PROCEDURE ... 118
4.1 Practicing the method – coding behaviour variables (Video) ... 118
4.2 Strange Situation Test ... 118
4.2.1 Hypotheses and predictions ... 118
4.3 Preparation of the Report ... 119
4.4 General evaluation – Considerations for the discussion ... 119
LITERATURE ... 123
XVIII. Assessing the inner state of dogs based on their barks; is there difference between the nuisance level of the barks? ... 125
1. OBJECTIVES ... 125
2. INTRODUCTION ... 125
2.1 Dog-human communication ... 125
2.2 The acoustic communication of dogs, with emphasis on barking ... 126
2.3 Do humans understand dog barks? ... 127
2.4 Nuisance barking ... 128
3. MATERIALS AND METHODS ... 129
3.1 Location ... 129
3.2 Subjects ... 129
3.3 Materials ... 129
4. PROCEDURE ... 129
4.1 Recognition of the context ... 129
4.2 Scoring of the inner states and the nuisance level ... 129
4. 3 Data analysis and presentation of the results ... 129
4.4. Evaluation of the practical report ... 131
LITERATURE CITED ... 131
XIX. Localisation of animals by radiotelemetry ... 137
1. OBJECTIVES ... 137
2. INTRODUCTION ... 137
2.1 Transmitter attachment ... 139
2.2 Receivers ... 141
2.3 Recieving antenna ... 141
2.4 Localization of the collared animals - Accuracy of locations ... 141
2.5 Direct localization versus triangulation ... 142 Ethology practical
3. METHODS ... 143
XX. Methods to collect and analyse animal behaviour data ... 146
1. OBJECTIVES ... 146
2. INTRODUCTION ... 146
2.1 The way of investigating animal behaviour ... 146
2.2 Types of behavioural variables ... 146
2.3 Methods to record data ... 147
2.4 Tools for data recoding ... 147
2.5 Reliability and validity of measurements ... 148
2.6 Agreement between and within observers ... 149
2.7 Methods to test the agreement between observers ... 149
2.8 Descriptive statistics ... 151
2.9 Statistical hypothesis testing ... 151
2.10 Normal distribution, testing normality ... 152
2.11 Parametric and non-parametric statistical tests ... 152
2. 12 One-sample, two-sample, paired-sample and multiple sample statistical tests ... 153
2.13 Investigating the association between variables ... 153
2.14 Reporting the results of statistical analysis ... 153
3. MATERIALS ... 153
4. PROCEDURE ... 153
4.1 Task to be carried out during the practical ... 153
LITERATURE CITED ... 155
XXI. Practical statistics: how to use the program instat to analyse your data ... 157
1. OBJECTIVES ... 157
2. INTRODUCTION ... 157
2.1 Installing GraphPad InStat ... 157
2.2 The InStat Guide ... 158
2.3. Entering your data ... 159
2.4. Working with the data table ... 160
2.5. Compare groups ... 161
2.6. Print or export the results ... 161
2.7. View a the results as a graph in InStat ... 161
2.8. Record notes or append the results to the notes window ... 161
2.9. Analyze the same data with a different test ... 161
2.10. Perform the same analysis on new data ... 161
2.11. InStat files and formats ... 162
LITERATURE CITED ... 162 Ethology practical
Chapter I. Field ethology – Conducting behavioral observations in the
Budapest Zoo
Péter Pongrácz
1. OBJECTIVES
This practical is about how to conduct basic observational studies on free moving animals. Students have to use their knowledge about the theory of ethological description of behaviour, the concept of ethogram and the most widely used methods of behavioural research. In the Budapest Zoo the students participate on a brief theoretical introduction, and then they can choose their subjects freely from among the numerous species available in the Zoo.
The practical offers a wide array of possible methods and research questions, as each species shows more or less different behaviour and activity patterns.
The main goal of this practical is to provide a model of a full ethological study, beginning with the pilot observations and asking the proper research question, following with the data collection and analysis, and ending with writing a report and drawing conclusions from the results.
2.INTRODUCTION
2.1 The design of a scientific research study
Data collection is not the first step of the scientific research. Ideally, each study (which can either be observational or experimental) starts with establishing a proper research paradigm, or more simply, a research question. A new study’s question can be derived from a previous research work, but it can also originate from an accidental or planned observation or pilot study as well.
The first ‘official’ step of an investigation is forming the research question. The next step is to choose or develop suitable methods, which will enable us to collect the necessary data to answer the question. For choosing the ap- propriate method one will need to know well enough the circumstances and the subjects of the study, and it is also very useful if we know some of the related researches, which were published earlier on the similar topic. In other words, the methodological planning of a study requires a throughout practical and theoretical knowledge from the scientists.
Knowing our question and the outline of the methods we will use for answering it, it is worth to enumerate those hypotheses, which are basically the possible outcomes (answers) of the research. Depending on the planned research, there are minimum two, but sometimes three or more theoretical answers that can exist. A preliminary analysis of these hypotheses can provide considerable help for the future, when we already have the results of our investigation.
This practical differs from the others along the course, where the students join to the experimental workafterthe previously mentioned three steps of research planning. Our main goal here is to provide the students a chance to conduct a full research right from the first step. They have to discover an interesting phenomenon, form a suitable research question, plan the proper data collecting methodology, and execute the observation. In the next paragraphs we provide a brief theoretical background about how to describe animal behaviour scientifically, and what kind of basic ethological procedures are available for conducting an observational research.
2.2 Components of behaviour
According to one of the main principles of ethology, behavior is a process that is dividable to discretebehavioural elements. These can be non-overlapping, for example a hen cannot sit and stand at the same time. Other behavi-
oural elements can overlap, for example the hen can peck while it is standing. The fact that a continuous string of behaviour can be divided to elements had a very important part in forming modern ethological thinking. Natural sciences require exact measuring methods, and this in turn would be impossible without unambiguous definitions and repeatable experiments. Knowing a few basic definitions are also necessary for the successful participation on this practical.
Behavioural elements are the smallest building blocks of behaviour, which are usually uniform among the members of a species. It is important to note however that behavioural elements can change along the life of an animal, for example because of ontogenetic reasons, environmental effects or learning. Still, it remains true that a particular behavioural element remains the same if we compare many individuals of a species, which are of the same age (and sometimes same sex).Behavioural unitsare such well-outlined sequences of behaviour, which consist of two or more behavioural elements, which usually belong together on the basis of functional reasons.
The preening of birds is a good example for behavioural units. Preening can involve several behavioural elements, like fluffing up the feathers, manipulating them with the beak of the bird, pushing out the secretion of the coccygeal gland, smearing it on the feathers etc.The ultimate and full collection of all behavioural units of a species is the ethogram. Ethograms contain usually independent (non-overlapping) behavioural units, which are described with as few functional terms as possible. Favoring formal descriptions over the functional ones is preferred because subjectivity can plague the functional evaluations, leading with this to misinterpretations of the behaviour.
The term ‘measurement’ is quite easy to understand in such fields of biology, like genetics, physiology or biochem- istry. However, at first glance behaviour is very hard to turn something that is ‘measurable’. Introducing behavi- oural elements provided considerable help to decide “what to measure”. From this point behaviour became a quantitative phenomenon, providing numerical data, which is possible to be analyzed with statistical methods.
Right at the beginning we should decide what kind of behavioural elements we will collect and from which purpose.
Obviously it depends on many factors, for example the available knowledge about the subjects. If the research is about some kind of original, descriptive study of a species or phenomenon, a finely detailed, throughout collection of behavioral elements may be necessary. At the other hand, if our subjects are members of a well-studied species, and we are seeking the answer for a specific, narrowly defined question, a few, or maybe one behavioural element may be sufficient to be observed during the investigation.
When studying behaviour, it makes a big difference when usingformal or functional description. Formal descrip- tion is the most objective way of ethological observations, because it does not involve any of the observer’s per- sonal opinions, assumptions, which for example could be influenced by his/her previous experiences. Formal de- scription consists of usually very simple elements, like the animal stands, sits, looks to the right/left, reaches with its neck etc. Collecting data about the space usage of animals belongs also to the formal description – like when the observer makes notes about where is the animal (or group of animals), or is the animal near or far from something.
Formal descriptions are time consuming and labour intensive, therefore if we have enough knowledge about the subjects and their behaviour (based on the literature or on our preceding results), we can opt for thefunctional descriptionof behaviour. In this case we observe and collect such units of the behaviour, which can be characterized with a well defined function. Such units can be for example when an animal eats, drinks, plays, fights, collects nest material etc. Functional behavioural units can consist of several formal elements, for example ‘fight’ may involve many distinct movements – each of these can be defined, collected and counted. Functional description can be re- garded as a compression, or simplification of the observation, which, in turn, makes the job of the ethologist much easier. Obviously, such a simplification does not come without drawbacks. It can happen that during a functional labeling some important details will be lost from the behavioural description. For example when we use a functional category “eats the meat” for describing the behaviour of wolves, this will not show the difference between the behavior of a dominant and a subordinate animal. The dominant wolf may approach the quarry in an upright posture, meanwhile the subordinate wolf sneaks there almost flattened on the ground. Another mistake is when somebody includes a not well grounded opinion to the functional description. For example if the observer does not know that flamingos feed only in the water, can label as “feeding” a behavior when the birds move their beaks in the grass on the shore. This labeling will be obviously false.
Researchers on the Department of Ethology of Eötvös Loránd University developed a combination of the formal and functional behavior coding, using the paradise fish (Macropodus opercularis) as a model (Csányi, 1985; Csányi et al., 1985). Each behavioral element was described with the help of the following three parameters:
Field ethology – Conducting behavioral observations in the Budapest Zoo
Location – where is the animal?
Orientation – which part of the environment (living or not) the behaviour is directed at?
This kind of coding can provide such further details about the behaviour, which would not be possible with the traditional formal description. At the same time it retains the objectivity through the formal elements it uses, therefore we can avoid such false assumptions that can be the consequence of a purely functional description (for example interpreting the fish’ behavior as “asking for food” when they are approaching that part of the aquarium where a human appeared).
2.3 The subjects of an ethological study
In the simplest case the researcher has only one subject at a time that he/she has to follow. However, it often happens that there is a smaller or larger group of animals on the scene. In this case we have to decide how many of them will be observed, and which ones will we observe. We have to be able to give a reason for our choice, why did we choose particular subjects and why did we exclude the others. Another, often difficult task is the identification of particular subjects from a larger group, many times with considerable delay after the initial observations.
Choosing the subjects is a matter of the planned study. In other words, our research question usually determines which subjects we will need. If we are interested in the behaviour on the group level, obviously more than one in- dividual should be observed simultaneously. In other times a larger group represents rather only a disturbing factor, because our question is aimed to the behaviour of a particular individual, or some kind of well defined sub-groups of the many available subjects. As a basic rule we should always remember to identify reliably the individuals, when our research is about the behaviour of non-randomly chosen subjects.
In general, we can conduct focal or group-level observations. During afocal observationwe always concentrate on one specific individual (or a specific pair of subjects etc.). After identifying our focal subject, we basically ignore the others’ behaviour. When conducting agroup-level observation, we have to collect data about each subject that is present at a time.
2.4 How can we collect behavioural data?
We have already figured it out, which kind of behavioral elements will we collect, and we have also chosen our subjects for observation – but we still have to decide upon a very important detail: what exactly will wedo? When talking about behavioural coding, the method of sampling basically means what kind of details of the behaviour and how often will we collect. A good start is if we base our choice of sampling method on the initial research question – as this method should be suitable for collecting the data that can be used to formulate the answer.
As any animal’s behaviour is an unbroken string of simpler elements, a logical choice for behavioural research is thecontinuous observation. The observer should not loose from his/her scope the subject (subjects) during the observational period, and each behavioural element should be recorded in that order as they follow each other.
Along with this usually a time dimension is also recorded, showing the duration of the behavioral elements. Con- tinuous observation can be very useful during initial exploratory studies, when the subjects are less known, or when the behaviour is very complex (for example courtship, ritualized fight, nest building etc.). At the same time continuous observation has its drawbacks, too. It would be near impossible to follow and record simultaneously the behaviour of all members of a larger group. In other cases the researchers are interested in the occurrence of one or only a few specific behavioural elements (for example, alarm calls when predators appear). It would be unnecessary and very time consuming to record everything else what the subjects are doing in this case. When the continuous observation is not an option or when it is unnecessarily work-needy, it is better to use some form of sampling of the behaviour.
When opting for asampling method, we should decide the time and space boundaries of the data collecting.Space can be an important parameter, when we record the spatial distribution or movement of the subjects. We can use natural categories of space (like the animals can be on the tree, or down at the ground level), or we can divide the space artificially to (usually equal) sections. Using space as a sampling aid, we can count for example, how many subjects are using a particular area, or what are the subjects doing at a particular place, or when did a particular subject enter a specific part of the observational area.Timeis another important factor of sampling. Usually we employ equal periods for recording the behaviour. For example one can record in every 20 s the actual behaviour
Field ethology – Conducting behavioral observations in the Budapest Zoo
of the subjects, or count how many subjects are doing a particular behaviour. A special variant of sampling is the behaviour-based coding. When opting for this, we are interested in the occurrence of only one (or two, etc.) specific behavioural element or unit, and independently of its spatial or temporal distribution, we record it (for example, the number of mountings among the baboons). This kind of sampling method is used when we are interested in a behaviour that is occurring only seldom, or very irregularly. When a behaviour is fairly common, is better to opt for the time-interval based sampling.
Another method for recording a small, limited number of behaviors is the‘yes-no’ sampling. It is usually connected to time-interval based data collection. In this case we record for example the number of animals showing or not showing a particular behaviour in a repeated time schedule. A related method is when we record the spatial distri- bution of the subjects repeatedly, for example on different places of the area.
3. MATERIALS
3.1 Location
Students can access the full area of the Budapest Zoo, including the indoor locations, too. As this practice can happen as a courtesy of the Zoo and the students and their demonstrator are the guests of the Zoo during the prac- tical, it is very important that the students should adhere themselves to the current regulations of our host. Obser- vations can be conducted to the closing time of the Zoo from the beginning of the practical (at least 3-4 hours, depending on the actual timetable of the semester that sets the start of the practical). Especially when the practical is afternoon, it is worth to keep in mind that the indoor facilities of the Zoo usually close 30 min earlier than the Zoo itself.
3.2 Subjects
Students can choose freely the subjects from among the Zoo’s inhabitants. Beside the animals, there is an option for human ethological observations, too. With proper research question (and keeping in mind that the observation must not disturb the visitors), the behaviour of the Zoo’s visitors can also be recorded.
For choosing of subjects, a basic note should be remembered: in general only active subjects will provide relevant and well-collectable data. Animals that do not or barely move for longer periods of time are not really suitable for the purposes of the ethology practical. At the same time the very vigorous activity can cause difficulties, too. Es- pecially when we observe several subjects, or try to follow a focal animal among many others, the behaviour of the fast moving subjects are not the easiest to describe. (The same is true for identifying particular animals in a highly active group.)
Before we decide, which animals will we observe, it is recommended to do a throughout walk around in the Zoo.
During this we should look for interestingly behaving, active animals, because this helps to formulate a good research question. Obviously, another possibility if somebody arrives with an a priori prepared research plan and target species. However, we emphasize that it is absolutely suitable and recommended, if the students decide and choose their research subjects after their arrival to the Zoo.
3.3 Materials
For this field observation students will need data sheets, pen and a stopwatch (contemporary cell phones usually provide a stopwatch function). It is also recommended that students bring a workbook, where they can record notes and other details that will help them to write the research report later. The official data collecting sheets can be printed out from the website of the Ethology Department, however if somebody forgets to do so, the demonstrator will provide these to the students before the practice.
Field ethology – Conducting behavioral observations in the Budapest Zoo
4. CONDUCTING THE FIELD OBSERVATION AT THE ZOO
4.1 Goals
Each student should conduct individual observations, which means that everybody has his or her own research question, fills in his or her own data sheet and performs the data analysis individually. If the students work in pairs (which is allowed), this should involve reciprocal technical help only, but still, both students in the pair should have an own study. The technical help can be still very useful, as for example while one student watches the animals and handles the stopwatch, the other writes down the data to the sheet. Each student should performTWOindi- vidual observations, by completing two sets of data sheets, obviously. A mandatory element of the practical is the submission of the (1)field report sheetand the (2)practical reportfor both observations.
4.2 Time range of the observations
The observations should last as long as the required amount of data is collected. The amount of data should be enough for reliable data analysis. As a general rule, 30 data points are usually sufficient for drawing conclusions from the results. Depending on the time interval chosen for the sampling, an observation can be as short as 15 min (30 s sampling), or as long as an hour.
4.3 Field report and data sheets
Students should complete the field report and data sheet while they are at the site of the observation. This, supported by a sketch of the observational area, provides the ‘field’ part of the report. In each case, the field report sheet must contain the following important data, without these the practical report cannot be evaluated.
• Name of the student
• Date and time (interval) of the observation
• Weather conditions (temperature, sunny/cloudy, rain yes/no, etc.)
• Subject(s) (scientific and common name of the species)
• General description of the group or individual animals (number, age, sex, other relevant features)
• Description of the observational area and circumstances (sketch is highly recommended)
• Research question (this must be a question that can be answered with yes or no)
• Selection criteria of the subjects, sampling method
• Features of the subject(s), how to identify them
• Results of the preliminary observation: this part contains the description of the behavioural elements that were used for the observation (do not forget the three parameters: posture, location, orientation)
The other part of the field report is the data sheet (see in the Appendix). This simple sheet provides rows and columns – the rows are usually serve for separating the time intervals step by step, while the columns can be used for various purposes, depending on how many subjects, behaviours, spatial divisions etc. we observe separately.
According to the chosen method, we can put numbers (e. g. number of animals in a given area), abbreviations (e.g.
of behavioural elements), or hash marks (e.g. frequency of behavioural element) to the individual cells of the sheet.
4.4 Written report
In this most important part of the student’s work a short description should be written about the background of the observation, giving a reason for the research question (what kind of preliminary observation, or knowledge encour- aged the student to choose that particular subject and question). It should be also mentioned, why and what kind of subjects were chosen, as well as why the given behavioural sampling method was selected. In the practical report the student should describe the special circumstances of the observation and the collected behavioural elements/
variables, too.
Field ethology – Conducting behavioral observations in the Budapest Zoo
The main part of the practice report is the presentation of the results. Answering the research question is only possible if the results originate from the calculations, based on the collected data. A mandatory part of this section is the graphical illustration of the results, which is done by computer-generated graphs.
As the topic and the method of the observation can be highly variable during this practical, it would be hard to decide ahead, which type of statistical analysis will be suitable for processing the data. Therefore the students should ask the demonstrator after the observations were done, who will advise a proper way how to analyse the data.
After the results were presented, it should not be forgotten that one must discuss the results. In this closing chapter of the report the student should compare the results to the hypotheses, which were raised along the research question.
It is useful if the student gives also an evaluation of the appropriateness of the chosen method retrospectively.
4.5 The evaluation of the report
The demonstrator will evaluate the students’ work based on the following criteria:
• Field report sheet (original or scan) and written practical report (both are mandatory)
• Completed data collecting sheet
• Sketch of the observational area (whether it is in suitable size and including the important details)
• Research question (must be answerable with yes or no)
• Appropriateness of the chosen method of observation, list of the observed parameters or behavioral elements
• Were there enough data collected?
• Does the practical report cover the introduction, methods and hypotheses of the observation?
• Were the results calculated and analyzed correctly?
• Presence and quality of the illustrations for the results.
• How detailed and imaginative is the discussion? Did the student discuss the appropriateness of the chosen method, did he/she propose further investigation plans?
• Aesthetic appearance of the report.
Figure I.1 Field report sheet
Field ethology – Conducting behavioral observations in the Budapest Zoo
Figure I.2. Field data collection sheet
Field ethology – Conducting behavioral observations in the Budapest Zoo
5. LITERATURE CITED
Csányi Vilmos 1994. Etológia, Nemzeti Tankönyvkiadó, Magatartásvizsgáló módszerek pp.78-117.
Chapter 20 and 21 (this volume)
Field ethology – Conducting behavioral observations in the Budapest Zoo
Chapter II. The ontogeny of antipredator behavior in fish fry
Péter Pongrácz
1. OBJECTIVES
In this chapter we discuss the various types of predator avoidance, including how experience modifies the inherited mechanisms of antipredator behaviour. We introduce some of the basic concepts of ethology, like the key stimulus and ontogeny, as well as the interactive model of learning. The practical includes experimental work on living fish fry. Students can test the effect of some factors that modify the inherited antipredator reaction elicited by the most important key stimuli. By modifying the location and number of eyespots painted on a model of a predatory fish, we will investigate whether the natural configuration (two, horizontally placed eyespots) has stronger effect eliciting predator avoidance than other alignments of the key stimulus.
2. INTRODUCTION
2.1 Antipredator behaviour
It would be hard to find an animal species, which is not facing the danger of being eaten by predators (at least at particular times of its ontogeny). Even the mighty African elephants are vulnerable when they are young and their size does not protect them from the largest of the carnivores yet. However, most animals are prone to threats of some kind of predator throughout their entire lifetime. It is not surprising therefore that there is a wide array of antipredator behaviours that were described in a multitude of species.
Antipredatory behaviours can be sorted in two main clusters. The so-calledprimary defense mechanismsaid in escaping the detection by a predator. These behaviours and the anatomical features that serve the primary defense can be called ascrypsis. A few examples for the cryptic mechanisms are thetransparency,mimicryandchanging of the colouration. Once the animal was detected however by a predator, and the actual capture seems to be im- minent, the only hope for to escape is the employment of one of the so-calledsecondary defense mechanisms.
Among these we find various forms of discouraging, attention distracting tactics, as well as more direct threatening or combating of the predator. Just a few examples are theself mutilating,feigning death,fighting back,threat- eningand themobbing.
2.2 Predator recognition
Avoiding the attack of a predator can be enhanced if an animal is capable of recognizing its enemy on the basis of some of the typical features of the predator. Among these auditory, chemical, visual, vibration cues can equally be found. Just like the other main behavioural categories of an animal,predator avoidance is based on genetic and learned componentsas well. How these two are interconnected can be understood with the help of theinter- active model of learning, described by Csányi (1985, 1986). One of the main lessons of this model is that an an- imal does not necessarily escape/avoid immediately when it detected a predator (as one could expect it knowing how the key stimuli elicit unconditioned evasive reactions). Contrary, when an animaldetected a predator(or more precisely: some of the key stimuli of a predator), without an imminent attack the animal will show rather curiosityandexplorationinstead of fleeing. Exploration serves a very important role: animals learn how todif- ferentiate a truly dangerous predator from a somewhat similar, but harmless creature; or even how to recognize the telltale signs of a satiated (non-dangerous) or ahungry, therefore dangerous predator. As Csányi’s model explains, learning additional information connected to particular key stimuli has an adaptive advantage for the animal, which will be able to decide to escape only when it is truly necessary.
2.3 Inherited recognition of predators
It was found in many species that they react automatically withavoidance/ escape to particular key stimuli without learning (in other words, without any previous unpleasant experience). In Scandinavia, where grazing deer present a danger for young pine plantations, odours of different carnivores were tested as deer-repellents (Sullivan et al., 1985). Interestingly, the results showed that not the sympatric (local) predators had the strongest repellent effect, but the extract of lion faeces deterred most effectively the deer from grazing on pine seedlings. As these deer were surely not exposed to lion attacks previously in Sweden, theirevasive reactionto the smell of lion was most likely aninheritedone.
There are many ethological studies that investigated the role of thevisible key stimuliof predator avoidance.
Maybe the most important of these is the horizontally positioned pair of eyespots that often elicit cautiousness or even fleeing from the potential prey animals. The adaptive value of this reaction is easy to understand: predators that hunt mainly based on their vision, usually have two large, ahead-looking eyes (these provide the proper 3D vision in front of the predator). If an animal is under the imminent threat of predatory attack, probably the most important sign of it is the sight oftwo large, ahead-looking eyesat the same time. This usually means that the predator has spotted its prey and by staring at it motionlessly, the final charge will follow soon. Interestingly, the proof of this mechanism comes not only from the investigations of the behavior of typical prey species (in mice:
Topál et al., 1994; in paradise fish: Altbäcker & Csányi, 1990). The sight of two large eyes can surprise a predator itself – and this effect was favoured by evolution in many potential prey species, like some of the moths for example.
When such an eyespot-bearing moth notices danger, suddenly exposes the eyespots hidden under its first pair of wings. Birds, like a blue jay show hesitation or with a startling response for such a display (Schlenoff, 1985), thus the moth is provided with vital seconds to escape.
The sight of the eyespots is regarded as an inherited key stimulus for predator avoidance. Its effect was extensively investigated with the help of a tropical fish species, the paradise fish (Macropodus opercularis) by the researchers of the Department of Ethology at the Eötvös Loránd University. It was found that not only the presence of the eyespots, but their number and their configuration are equally important for eliciting the proper evasive reaction.
For example, one, three or four eyespots painted on a predator model were much less effective than two; and if two eyespots were painted in a vertical configuration they were not as effective astwo horizontally placed eyespots (Csányi, 1986). Other features of a predator (colour, contour, size) had smaller importance compared to the role of the eyespots. When paradise fish were receiving painful stimuli (electric shocks) parallel with their exposure to a predator model, only when the model was equipped with the proper eyespots has the conditioning of the avoidance behaviour (model + pain → escape) happened effectively in the paradise fish.
2.4 Predator avoidance and the ontogeny
In most of the studies predator avoidance elicited by key stimuli was investigated in adult animals. It is logical from the aspect that the full-blown behavioural repertoire is usually present when an individual has reached its maturation. At the same time one can expect that behavioural forms that have not been modified by learning yet can be observed mostly in the young (or very young) animals. Predator avoidance is also very important even for the youngest of many species, because the risk of being eaten is especially high while the animal is young, weak and inexperienced. For example in wild rabbits it was found that before the rabbits would reach the 350 g body weight, the young generation loses 2-3 % of animals daily due to predator attacks in Australia (Richardson &
Wood, 1982). Vitale (1989) conducted field experiments with simulated predator attacks on wild rabbits, and it was found that the young animals show less sophisticated avoidance behaviour and emerge sooner from the burrows after fled there from a predator, than the adult rabbits. Thus we can conclude that in rabbits the juvenile animals are not only easier to catch because they are weaker than the adults, but their survival is also hampered by their less-developed predator avoidance behaviour.
Fish in general offer useful experimental material for the investigation of the ontogeny of antipredator behaviour.
Fish fry are small, develop quickly and in most species they are independent from their earliest age. All in all they are excellent subjects for comparing different age classes and examining how the antipredator behavior reaches step by step its mature form, or to investigate the specific ways of juvenile predator avoidance. In fish the trans- itional period between the larva and fry state is especially important, because when the fries start to swim (leaving behind the mostly bottom-laying larva state) they face an immediate and serious threat from predators. Working with the fries of the paradise fish, Hungarian ethologists discovered the formation of more and more sophisticated
The ontogeny of antipredator behavior in fish fry
antipredator behaviour as a result of the interaction ofontogeny (gene-based development) and the environmental factors (learning). This complex process is often called asepigenesis. These experiments helped the scientists to identify many of the inherited key stimuli of predator recognition, as well as discovering some new learning phe- nomena.
Paradise fish fry start swim around in a greater extent when they reach the 10-15 day age. After hatching they are taken care of by their father, which collects and returns the accidentally scattered, hapless larvae to the so-called foam-nest, built by him on the water surface. We present here the results of a few experiments that were conducted on independently swimming and feeding fries of 15, 20 and 25 day of age. In each case the tests were done in small, elongated (20x5x5 cm) tanks. In one end of the tank the predator model was inserted, while the subjects were released one by one to the opposite end of the tank. From the several behavioural elements that were recorded, the ‘retreat’ and ‘jumping’ were especially important. Both served as moving away from the vicinity of the model.
Additionally, the initial advancing of the fish to the model was characterized by the latencies of the individual entries to the compartments which were 1 cm wide sections of the tank, divided by lines painted on the bottom of the tank. Standard transparent laboratory ultracentrifuge tubes served as predator models. The tubes were filled with sand, and black eyespots were painted on their rounded ends (see Fig 1). Each subject was tested only once, and each test lasted for 3 min.
In our first experiment (Miklósi et al., 1995) we investigated the onset of the aversive effect of the horizontally placed two eyespots in different age groups of fries. We tested 15 and 20 day old fish with two-eyed and eyeless models. The results showed that paradise fish fries show avoidance behaviour only, when they were facing with the two-eyed model, while the eyeless model did not elicit antipredator response. However, the eyespots did not have any specific effect on the 15 day old fry. This experiment proved that the sight of eyespots becomes a key stimulus of predator avoidance between the age of 15 and 20 days in paradise fish fry.
In the second experiment we used only the 20 day old age group, and the role of the number and configuration of eyespots was tested. There were one-, two- and three-eyed predator models, and the two eyespots were presented either in a horizontal, or a vertical configuration. The fish showed significantly more intense predator avoidance in the presence of the model with the two, horizontally positioned eyespots than any of the other model variants.
These results proved that the eyespots serve as key stimuli for predator recognition only if they are present on a predator-like object in their natural configuration (horizontal) and number (two).
Another study (Miklósi et al., 1997) was about to find out the answer for an interesting phenomenon: the reason why does the strong predator avoidance reaction of the 20 day old fish disappear if we test 25 day old fry with the most effective model type (equipped with the two, horizontally placed eyespots). It was found earlier that the 25 day old fish does not show antipredator behavior when they were tested with the above mentioned model. The role of ontogeny seemed to be unlikely as (1) the adult paradise fish react with avoidance to the sight of the eyespots as well, and (2) the 25 day old fry are just as threatened by predators as the 20 day old age class. Therefore we tried to modify the environmental effects that may have affected the development of predator avoidance between 20 and 25 day of age. Half of the subjects were raised in the usual way, where they were kept in groups of 30-40 fish in small, 6 l aquaria. The other half of the subjects received 1, 3 or 7 days long isolation before they reached the 25 day old age. These fish were separated from their shoalmates, and they were housed individually in 6 l aquaria for the given length of time. The tests were conducted in each case when the fish were 25 day old. Two- eyed and eyeless models were used as predator stimuli. The results showed that while one day of isolation was not long enough to affect the behaviour of the fry, they showed similar predator avoidance after three of seven days of isolation, than the 20 day old fry. Importantly, only the two-eyed model elicited antipredator responses. This experiment showed that the effect of key stimuli can be overwritten by learning (habituation1), if the fries live in high density. In such an environment they are constantly exposed to the sight of their shoalmates’ eyes. However, the effect of habituation is reversible, and it disappears after a few days of isolation (or low-density living environ- ment). In the nature, 20-25 days old fries have already been scattered among the water plants, therefore they do not have opportunity for being habituated to the sight of the eyespots of other fish.
The ontogeny of antipredator behavior in fish fry
3. MATERIALS
3.1 Test subjects
During the practice 5-10 days old fries of the guppy (Poecilia reticulate) are used as test subjects. Each fish is tested only once. Guppies are bred and raised at the Department of Ethology. Fries are kept isolated from each other for three days preceding the tests.
3.2 Experimental device
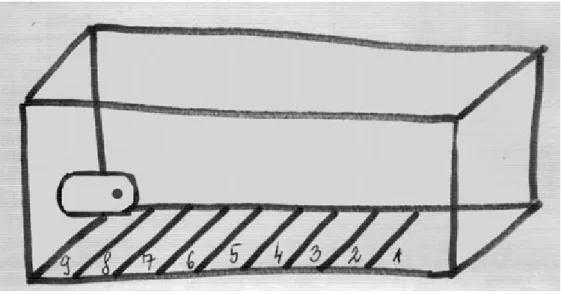
The testing tanks are small, elongated aquaria, with dimensions of 20x5x5 cm. The walls of the tank are painted mid-green from the inside. The floor of each tank is divided to 1 cm wide cross-sections, which are marked with black lines. One end of the tank serves as the starting compartment for the subject, while the predator model can be inserted to the opposite end of the tank. Before the next subject is released to the start compartment, the tank is re-filled each time with fresh water of 26 Celsius degrees of temperature. The water should be 3 cm deep in the tank. A small net is used for lifting the subjects from their keeping tank to the test tank, and after the test the fries are returned to their own tank again with the same net. As the walls of the test tank are painted opaque, the subjects can be observed during the test from above, with the help of a mirror, which is positioned at 45 degrees of angle over the tank.
Figure II.1: Test tank for fish fry. The small tank is 20 cm long, 5 cm tall and 5 cm wide. On its left end a predator model is attached to its wall. Each subject is released at the opposite end, in the start compartment (‘Compartment 1’). The lines drawn on the floor of the tank separate the cross-sections that are used for describing the subject’s advancing against the model.
4. PROCEDURE
4.1 Goal of the practical
The question of the experiment is whether fish fry react differently to models of predators depending on the amount and configuration of the eyespots painted on the predator. We follow the methodology used by Miklósi and col- leagues (1995), but here we use guppies instead of paradise fish as subjects. According to our hypothesis, just like the paradise fish, guppies will show the strongest predator avoidance in the case of the two-eyed predator model, on which the eyespots are painted in a horizontal configuration.
The ontogeny of antipredator behavior in fish fry
4.2 Experimental process
Each fish is tested for three minutes. The test starts when the fish crosses the line between compartments 1 and 2.
Before the release of the next subject, the corresponding predator model should be inserted and fresh water should be poured 3 cm deep to the tank. When the tank is positioned properly under the mirror, using the small net carefully and gently, a fish is released to the start compartment. It is important that fries should not be dropped to the tank from the air, but be released by submerging the net to the water. We should let the fry slip from the net right to the water. When the subject entered the starting compartment, we remove the net slowly and carefully, and wait for the fish starting to move. When the fry crosses over the line between the 1stand 2ndcompartment, we start meas- uring the three min long trial. If the fish does not leave the start compartment for three min, we make a note of it and exclude the subject from the test. After returning it to its keeping tank, we switch the water in the test tank, and continue the procedure with a new subject.
Students work in pairs during the behavioral observation. A recommended sharing of the tasks may be that one of the students watches the fish in the tank and tells what happens, while the other member of the team writes the behavioural elements to the data collecting sheet and handles the stopwatch. The following parameters should be collected:
• number of compartment switches (how many times did the fish swim over the lines that separate the compartments)
• latency(s) of entering compartment 8 (this is the time elapsed until the fish swims over first time the line between compartments 7 and 8. If the subject does not enter compartment 8 at all, this latency is 180 s)
• number of retreats (the fish stops, then slowly moves backward, while its body typically forms a slightly curved hook shape)
• number of jumps (this is a sudden, fast leap against the preceding direction of the locomotion. Fish may jump after it stopped, or was just retreating, but jumps can occur right in the middle of a swimming forward, too. Fish jump almost always to the opposite direction than they were facing at before)
When the three minutes were elapsed, the test is over, and the subject is returned to its own tank. Each pair of students tests one subject with each predator model.
4.3 Experimental groups
The following predator models will be used (each of them is 1 cm of diameter):
• eyeless model
• model with two, horizontally positioned eyespots
• model with two, vertically positioned eyespots
• model with three, horizontally positioned eyespots
4.4 Data analysis and the presentation of the results
At the end of the practical the pairs of students prepare such summarized data sheets, which contain the columns of all the data collected in the same test conditions. For example, the number of compartment switches, latency, number of retreats and jumps of each fish tested with the eyeless model will be sorted to separate columns. During the data analysis we will compare the parameters of the different experimental groups. We expect Gaussian distri- bution for most of the parameters, however, this should be tested at first with Kolmogorov-Smirnoff test. In the case of Gaussian distribution we will perform one-way ANOVA with Bonferroni post hoc test. In a case of non- Gaussian data distribution we will use non-parametric Kruskal-Wallis test with Dunn’s post hoc test.
Each member of the student-pairs performs the data analysis and writes the practice report individually – in other words the co-operation is restricted to the data collection phase only. The practical report should present the results according to the following guidelines:
• The raw data of the four fish that the pair tested should be presented in a table format.
• In the case of each parameter a graph should be created that shows the results of the four experimental groups.
Do not miss to indicate the significantly differing groups (if the statistical analysis found significant effect)1.
1See Chapter 20 (Statistical analysis)
The ontogeny of antipredator behavior in fish fry
• Results of the statistical analyses should be presented in a table format (even if the difference was not significant).
4.5 Preparing a report
The report is a mandatory part of the experimental work. Each report should contain the following parts beside the above mentioned presentation of the raw data, statistical analyses and results:
• Introduction – where the author reviews the theoretical background, aims, research question and hypotheses of the experiment.
• Materials and methods – the author provides a clear description of the subjects, equipment and procedure of the experiment.
• Results – statistical analyses, graphs, and the table of the raw data collected by the author and his/her team partner.
• Discussion – the author compares his/her results to the findings of similar researches. The author discusses the results in the light of the experimental hypotheses. It is useful if the author tries to find broader conclusions of the actual experiment.
4.6 Evaluation of the report
While evaluating a student’s work, the following details are examined:
• Did the student write a detailed introduction, including the scientific background of the research, the experimental question and hypotheses?
• Did the student explain the methods and materials of the experiment?
• Were the necessary statistical analyses performed and presented in the report?
• Were the results illustrated with acceptable graphs/ figures?
• Did the student explain and discuss the details of the results?
• Were the mathematical formulas and statistical analyses correct?
• Does the report include a general discussion, where the student draws the broader conclusions of the study, and connects the new results to the former knowledge based on the literature?
• Does the report fit to the formal and aesthetical requirements?
5. LITERATURE CITED
Altbäcker, V. & Csányi, V. 1990. The role of eyespots in predator recognition and antipredatory behaviour of the paradise fish (Macropodus opercularis). Ethology, 85: 51-57.
Csányi, V. 1985. Ethological analysis of predator avoidance by the paradise fish (Macropodus opercularis). I.
Recognition and learning of predators. Behaviour, 92: 227-240.
Csányi, V. 1986. Ethological analysis of predator avoidance by the paradise fish (Macropodus opercularis). II.
Key stimuli in avoidance learning. Anim Learn Behav, 14: 101-109.
Miklósi, Á., Berzsenyi, G., Pongrácz, P. & Csányi, V. 1995. The ontogeny of antipredator behaviour in the paradise fish larvae: The recognition of eyespots. Ethology, 100: 284-294.
Miklósi, Á., Pongrácz, P. & Csányi, V. 1997. The ontogeny of antipredator behaviour in the paradise fish larvae (Macropodus opercularis): The effect of exposure to siblings. Devel Psychobiol, 30: 283-291.
Richardson, B. J. & Wood, D. H. 1982. Experimental ecological studies on a subalpine rabbit population. I. Mor- tality factors acting on emergent kittens. Austr Wildl Res, 9: 443-450.
Schlenoff, D. H. 1985. The startle response of blue jays toCatocala(Lepidoptera: Noctuidae) prey models. Anim Behav, 33: 1057-1067.
Sullivan, T. P., Nordström, L. O. & Sullivan, D. S. 1985. The use of predator odors as repellents to reduce feeding damage by herbivores. II. Black tailed deer (Odocoileus hemionus columbianus). J Chem Ecol, 11: 921-935.
The ontogeny of antipredator behavior in fish fry
Topál, J. & Csányi, V. 1994. The effect of eye-like schema on shuttling activity of wild house mice (Mus musculus domesticus): Context-dependent threatening aspects of the eyespot patterns. Anim Learn Behav, 22: 96-102.
Vitale, A. F. 1989. Changes in the anti-predator responses of wild rabbits,Oryctolagus cuniculus(L.), with age and experience. Behaviour, 110: 47–61.
The ontogeny of antipredator behavior in fish fry
Chapter III. Search image formation in domestic chicken
Gabriella Lakatos
1. OBJECTIVES
The goal of the present practical is to exercise the rules of experimental work with live subjects, and to observe the behaviour of free-moving animals and describe their behaviour (e.g. developing and using an ethogram). Further goal of this lesson is to examine the search image formation in chicks according to a predefined experimental protocol and to get experienced in statistical data analysis.
2. INTRODUCTION
The search image hypothesis was originally proposed to account for the observation that animals selecting among different kinds of food often consume an excess of the more common type. The hypothesis states that animals searching for a particular cryptic food item focus on visual features that are characteristic of that item, thereby fa- cilitating its discrimination from the background (Tinbergen, 1960; see also Bond and Riley, 1991). Hereby, they form a search image for the certain grain type.
Alexandra Pietrewicz and Alan Kamil (1979) investigated the search image formation on blue jays (Cyanocitta cristata). Birds trained to detect Catocala moths in slides were exposed to two types of slide series containing images of these moths: series of showing only one of the two species and a series showing the two species intermixed. In one species series, detection ability increased with successive encounters with one grain type. No similar effect occurred in two species series. These results are a direct demonstration of a specific search image.
Bond and Kamil also examined the question of search image formation in blue jays. Their results showed also that detection performance was strongly facilitated in the course of a sequential priming but was relatively unaffected by sequences of mixed target types. Detection accuracy in subsequent probe trials was enhanced by priming with targets of the same type, whereas accuracy on cryptic probes following a priming with a more conspicuous target was significantly degraded. Their results hereby support the ‘enhanced attention’ hypothesis instead of the searching image hypothesis for the high predation ratio on the more abundant prey.
In a further experimental study, conducted by Plaisted and Mackintosh (1995), the detection of cryptic ‘prey’ was examined in pigeons (Columba livia) using an operant discrimination procedure and complex computer-generated stimuli. In their experiments they manipulated the frequency with which each of two target types appeared, and they found further evidence for Tinbergen’s claims that a high-frequency target is better detected than a low fre- quency target. Their results also suggested that an uninterrupted ‘run’ of encounters with one cryptic target facilitates performance and that this facilitation does not appear when two targets appear intermixed.. Since the two targets in the study were equally cryptic, results of these experiments provide evidence consistent with the search image hypothesis.
Studies with blackbird (Lawrence, 1985) provided similar results, supporting the hypothesis that the formation of search image for a given grain type enhances the efficiency of prey detection.
Similar studies were also carried out on chicks (Dawkins, 1971) using different coloured grains, which were presented on a different coloured background for the birds. These studies demonstrated that, although the chicks were initially unable to detect the coloured grains of rice dyed the same colour as the background was, subsequently a significant improvement in performance was observed in the chicks’ food detection. This change is most plausibly seen as a central change of perception. Ability to see cryptic rice was not fully retained from one day to the next.
On the other hand, feeding chicks on conspicuous grains had an adverse effect on their ability to detect cryptic grains. These results are in line with L. Tinbergen's hypothesis that birds may use 'searching images'.
Further research (Dawkins, 1971b) have also shown that the chicks are able to shift their attention quickly between the conspicuously coloured and the cryptic food, depending on what kind of food they are eating at the time.
3. PROCEDURE
1. Group discussion of theoretical background (see the Introduction) of the tests, the presentation of the experi- mental equipment, explanation of the protocols.
2. Explanation of the Data Collection Sheets.
3. Conducting the experiments. The chicken should be given 20 minutes rest between each test. We will share the experimental data in the group and perform the statistical analysis on the complete data set.
4. Discussion of the results.
3.1. TEST 1: DETECTION OF CRYPTIC PREY
3.1.1.Hypotheses and predictions
Prior to the test, over seven days the chicks were fed on a certain colour food. The aim of this specific test was to study whether the chicks form search image for this type of food and whether they are able to detect it on a same coloured background.
The two main questions of this test are:
1. Whether the chickens’ cryptic food detection performance is getting better with the time?
2. Whether the detection performance of chicken is better if the grain type is conspicuous against the background compared to when it is cryptic on the background?
Based on the literature described above, we have the following predictions:
1. We assume that the chicks will find the cryptic coloured food with a growing rate in time, which suggests that each chick forms a search image for this particular type of food on the basis of its’ visual characteristics.
2. We assume that the chicks will find in a higher proportion the conspicuous food than the cryptic food.
3.1.2 Behavioural analysis – Data collection
Experimental protocol
Half of the chicks were fed by original coloured (yellow) grains for seven days prior to the experiment, while the other half of the chicks were fed by green coloured grains.
In the first test, we examine the chicks’ food detection performance if they meet the previously trained grain type on a same coloured background. We also examine whether their performance increases by time.
To study these questions we will present the food to the chicks on two different coloured background, same colour background (the food will be cryptic), white background (the food will be conspicuous). Half of the chicks will be tested with the same colour background for the first time, while the other half of the chicks will be tested with the white background. We have to have at least 10 minutes break between the two subtests.
The performance of the chicks will be measured by analysing the chicks’ pecking behaviour (frequency of pecking).
We will measure fifty pecking in both subtests and in each case we will record the latency of the pecking behaviour (that is the time elapsed from the start of observation until the pecking was detected) and the total length of the subtests. At the end of the test we will calculate the sum of the duration for the first five and the last five pecking.
3.1.3. Coding sheet:
We will record the chicks’ behaviour on the following coding sheet.
Search image formation in domestic chicken
3.1.4. Data analysis
For the statistical analysis we merge the data of all the chicks.
For analyzing the chicks’ performance in case of the differently coloured backgrounds we use Wilcoxon match paired test. We will compare the pecking latencies in case of the two different kinds of background, as well as the durations of the first five and the last five pecking.
For the statistical analysis we use the software „INSTAT”, following the recommendations of Chapter 20-21.
3.2. TEST 2: Formation of search image when multiple grain types are available 3.2.1 Hypotheses and predictions
Questions for the second test:
1. Will the chicks consume the previously trained grain type in a higher proportion when there are two different grain types available in parallel at equal abundance, and the two grain types are equally conspicuous on the background?
2. Do any changes occur in the chicks’ performance of finding the previously trained cryptic food (on a same colour background) following a session when the two different food types were presented simultaneously?
Based on the literature described above we have the following predictions:
Search image formation in domestic chicken
1. We assume that if the chicks form a search image for the previously trained grain type, they will consume more from this kind of food. It is also possible that in case of the presence of two, equally abundant grain type they do not use search image, in this case there will be no difference in the pecking frequency on the two grain types.
2. We assume that the chicks’ performance of finding the cryptic food will decrease after a session when the two grain types were presented for them at the same time.
3.2.2 Behaviour analysis – Data collection
Experimental protocol
The experiment is carried out exactly as the first test was, with the difference that in this case two different types of food were presented for the chicks first, on a white background (paper sheet), scattered in equal abundance.
Subsequently, as in the previous experiment, we will present the previously trained food type on a same colour background (the food will be cryptic).The pecking behaviour will be coded. For both subtests fifty pecking will be measured. In case of the first subtest, pecking frequency of the two food types will be recorded. In addition, we will record the latency of the pecking behaviour (that is the time elapsed from the start of observation) and the total length of the subtests. At the end of the test we will calculate the sum of the duration for the first five and the last five pecking.
3.2.3. Coding sheet
Please, mark with an X on the sheet in case of each pecking whether the chick pecked the previously trained or the other type of food.
Search image formation in domestic chicken