Quarterly Report on Inflation
March 2014
Quarterly Report on Inflation
March 2014
Published by the Magyar Nemzeti Bank Publisher in charge: Eszter Hergár 8−9 Szabadság tér, H-1850 Budapest www.mnb.hu
ISSN 1418-8716 (online)
Act CXXXIX of 2013 on the Magyar Nemzeti Bank, defines the primary objective of Hungary’s central bank as the achievement and maintenance of price stability. Low inflation ensures higher long-term economic growth and a more predictable economic environment, and moderates the cyclical fluctuations which impact both households and companies.
In the inflation targeting system in use since August 2005, the Bank has sought to attain price stability by ensuring an inflation rate near the 3 per cent medium-term objective. The Monetary Council, the supreme decision-making body of the Magyar Nemzeti Bank, performs a comprehensive review of the expected development of inflation every three months, in order to establish the monetary conditions consistent with achieving the inflation target. The Council’s decision is the result of careful consideration of a wide range of factors, including an assessment of prospective economic developments, the inflation outlook, financial and capital market trends and risks to stability.
In order to provide the public with clear insight into the operation of monetary policy and to enhance transparency, the Bank publishes the information available at the time of making its monetary policy decisions. The Report presents the inflation forecasts prepared by the Directorate Economic Forecast and Analysis, the Directorate Monetary Policy and Financial Market Analysis, the Directorate Financial System Analysis and the Directorate Financial Analysis, as well as the macroeconomic developments underlying these forecasts. The forecast is based on assumption of endogenous monetary policy. In respect of economic variables exogenous to monetary policy, the forecasting rules used in previous issues of the Report are applied.
The analyses in this Report were prepared under the direction of Dániel Palotai, Executive Director of the Directorate Monetary Policy, with the participation of staff from the Directorate Economic Forecast and Analysis, the Directorate Monetary Policy and Financial Market Analysis, the Directorate Fiscal Analysis, and the Directorate Financial System Analysis.
The Report was approved for publication by Dr. Ádám Balog, Deputy Governor.
The Report incorporates valuable input from the Monetary Council’s comments. The projections and policy considerations, however, reflect the views of staff in the Directorate Economic Forecast and Analysis, the Directorate Monetary Policy and Financial Market Analysis, the Directorate Fiscal Analysis, the Directorate Financial System Analysis and do not necessarily reflect those of the Monetary Council or the MNB.
The projections are based on information available for the period ending 18 March 2014.
CONTENTS
1. Inflation and real economy outlook ... 6
1.1. Inflation forecast ... 7
1.2. Real economy forecast ... 11
1.3. Labour market forecast ... 16
2. Effects of alternative scenarios on our forecast ... 19
3. Macroeconomic overview ... 22
3.1. International environment... 22
3.2. Aggregate demand ... 30
3.3. Production and potential output ... 37
3.4. Employment and labour market ... 40
3.5. The cyclical position of the economy ... 41
3.6. Cost and inflation ... 42
4. Financial markets and interest rates ... 50
4.1. Domestic financial market developments ... 50
4.2. Credit conditions of the financial intermediary system ... 55
5. The balance position of the economy ... 58
5.1. External balance and financing ... 58
5.2. Forecast for Hungary's external balance position... 61
5.3. Fiscal developments ... 63
6. Special topics ... 68
6.1. Global factors in the domestic disinflation ... 68
6.2. Evaluation of central bank's forecasts for 2013 ... 72
7. Breakdown of the average consumer price index for 2014 ... 76
LIST OF BOXES Box 1–1 Underlying inflation in our forecast ... 9
Box 1–2 Tax effects shaping current inflationary trends ... 10
Box 1–3 One-off effects in domestic exports and industrial production ... 14
Box 3–1 Deceleration in the emerging markets – a permanent or temporary development? ... 27
Box 3–2 The exposure of Hungary and the Central and Eastern European region to Ukraine and Russia ... 35
Box 3–3 The effect of disinflation on the distribution of price changes: Are there deflationary risks? ... 47
THE MONETARY COUNCIL’S STATEMENT ON MACROECONOMIC DEVELOPMENTS AND ITS MONETARY POLICY ASSESSMENT
Since August 2012, the Monetary Council has reduced the central bank base rate significantly
These reductions in the base rate were justified by the low inflation environment, subdued inflationary pressures over the medium term and a degree of spare capacity in the economy. Perceptions of the risks associated with the economy were also generally supportive. In the Council’s judgement, the significant reduction in the base rate implemented so far has helped the Bank achieve the inflation target over the medium term and has contributed to the strengthening of domestic economic growth. The Council’s aim remains to maintain a balanced and conservative approach to monetary policy. In addition to the priority of meeting the inflation target, the Council also takes into account the condition of the real economy and incorporates financial stability considerations into its decisions. A marked and sustained shift in perceptions of the risks associated with the Hungarian economy may influence the room for manoeuvre in monetary policy.
Looking ahead, inflation is likely to move in line with price stability; disinflation is expected to slow gradually
In the Council’s judgement, inflation is likely to remain below the 3 per cent target in 2014, before moving into line with the medium-term inflation target from 2015. The inflation rate has been at historically low levels in recent months. Subdued inflation in external markets, the degree of unused capacity in the economy, the fall in inflation expectations and the reductions in regulated prices, implemented in a series of steps, have contributed to the development of a low inflation environment. However, the weaker exchange rate of recent months has passed through gradually to the prices of core inflation items, which in turn points to higher underlying inflation. Capacity utilisation is likely to rise gradually as economic activity continues to recover. Household consumption, however, which is relevant in terms of inflation pressures from the domestic real economy, is likely to grow only slowly, and therefore the real economic environment is expected to continue to have a disinflationary impact, although to a declining extent. In addition, the loose labour market and the adjustment of inflation expectations also suggest that moderate wage growth is likely to continue, which in turn will contribute to inflation moving in line with the Bank’s inflation target looking forward. The low inflation environment may help the Bank’s inflation target to better anchor the nominal path of the economy.
The Council judges that the Hungarian economy returned to a growth path in 2013. Looking ahead, economic growth is likely to continue
Economic activity picked up gradually in the past quarters, with output rising across a wide range of sectors. Looking ahead, Hungarian economic growth may continue in a more balanced pattern than previously. Rising exports are likely to play an important role as a source of growth in the coming years, supported by new production capacity in the automobile industry brought into production and the improvement in competitiveness, in addition to the recovery in economic activity abroad.
Domestic demand is expected to strengthen in the coming years. Investments are likely to pick up further, reflecting the improvement in the outlook for activity, the easing in credit constraints due to the Bank’s Funding for Growth Scheme and the increasing use of EU funding. However, household consumption is likely to grow only gradually, even as disposable income increases. Propensity to save is expected to remain high, reflecting the ongoing reduction in debts accumulated during the years prior to the crisis and the slow improvement in credit conditions.
Hungary’s external debt is expected to fall further
The external financing capacity of the Hungarian economy continued to rise towards the end of 2013 and the external debt ratios fell significantly. The external surplus is likely to remain high in the coming years as the trade surplus stabilises at a high level, despite accelerating growth in consumption and investment. The improvement in the terms of trade and the pick-up in export growth as external demand recovers are likely to play a dominant role in this. The transfer balance is expected to fall slightly, due to the new budget cycle of the EU, but is likely to remain above levels recorded in previous years. With the
external financing capacity remaining high, the external debt ratio is likely to fall further, which in turn will reduce the country’s vulnerability.
The Hungarian risk premium did not change significantly in the past quarter, but volatility increased in financial markets
Due to the Fed’s decision to further reduce the pace of its asset purchases, the increased focus on the vulnerability of some emerging economies and the escalation of the conflict between Ukraine and Russia, global investor sentiment has been volatile in the past quarter. Domestic risk premia have been little changed since publication of the December issue of the Bank’s Quarterly Report on Inflation. The CDS spread and the spreads on foreign currency bonds fell slightly, long-term yields rose modestly and the exchange rate depreciated, accompanied by significant volatility. The volatility of the major risk indicators increased relative to previous quarters. Nevertheless, Hungary’s position is fundamentally strong compared to other emerging market economies. The country’s persistently high external financing capacity and the resulting decline in external debt are reducing its vulnerability. In the Council’s judgement, a cautious approach to policy is warranted by uncertainty related to the global financial environment.
The macroeconomic outlook is surrounded by both upside and downside risks
The Monetary Council identified three alternative scenarios around the baseline projection of the March Report on Inflation, which might significantly influence the future conduct of monetary policy. In the alternative scenario assuming a persistently low external inflation environment and a slower-than-expected recovery in external demand, the inflation target may be achieved with looser monetary conditions than assumed in the baseline scenario. In the risk scenario assuming an unfavourable external environment and higher investor risk aversion, inflation moves in line with price stability in the medium term under tighter monetary conditions than implied by the baseline projection. A third scenario, assuming a pick- up in domestic employment and consumption, resulting in weaker domestic disinflationary pressures, also implies a tighter monetary policy stance.
After reviewing the projection in the March Report on Inflation, the Council judges that there remains a degree of unused capacity in the economy and inflation is likely to move in line with the target in the medium term. The negative output gap is expected to close gradually at the monetary policy horizon, and therefore the disinflationary impact of the real economy is likely to decrease looking forward. In the Council’s judgement, there remained some scope for a cautious reduction in interest rates in the context of heightened uncertainty in global financial markets; however, a smaller reduction in interest rates than previously was warranted by the increase in uncertainty. Considering the substantial reduction in interest rates so far, changes in perceptions of the risks associated with the economy and based on currently available information, the central bank base rate has significantly approached a level which ensures the medium-term achievement of price stability and a corresponding degree of support for the economy. In case of a significant deterioration in global financial market environment, the Council will see no scope for continuing the easing cycle.
SUMMARY TABLE OF THE BASELINE SCENARIO
(FORECASTBASEDONENDOGENOUSMONETARYPOLICY)
2013 2014 2015
Actual Projection
Inflation (annual average)
Core inflation 3.3 3.0 3.5
Core inflation without indirect tax effects 1.5 2.1 3.3
Inflation 1.7 0.7 3.0
Economic growth
External demand (GDP based) 0.6 1.7 2.2
Household consumption expenditure 0.2 1.3 1.7
Government final consumption expenditure 1.3 0.7 1.6
Gross fixed capital formation 5.9 7.3 3.6
Domestic absorption 0.8 2.3 2.1
Export 5.3 5.8 6.5
Import 5.3 6.2 6.4
GDP* 1.2 2.1 2.5
External balance
1(2013 data is forecast)
Current account balance 3.2 3.0 3.4
External financing capacity 6.8 6.3 6.5
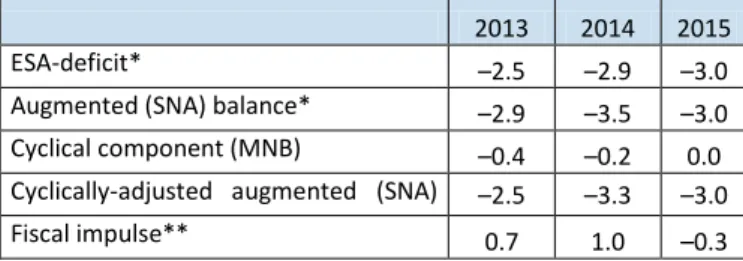
Government balance
1,6ESA balance (2013 data is preliminary) -2.5 -2.9 -3.0
Labour market
Whole-economy gross average earnings
23.3 3.8 6.1
Whole-economy employment 1.6 1.9 0.1
Private sector gross average earnings
33.6 2.4 3.7
Private sector employment 0.8 1.2 1.0
Unemployment 10.2 9.1 8.9
Unit labour costs in the private sector
41.7 1.9 1.4
Household real income
51.5 2.0 1.3
1 As a percentage of GDP.
2 Calculated on a cash-flow basis.
3 According to the original CSO data for full-time employees.
4 Private sector unit labour costs calculated with a wage indicator excluding the effect of whitening and the changed seasonality of bonuses and domestic employees.
5 MNB estimate.
6 With complete cancellation of free reserves.
* Data adjusted for calendar effects.
1. INFLATION AND REAL ECONOMY OUTLOOK
In recent months, stronger growth and a further decline in inflation were the main characteristics of macroeconomic developments. In line with the upturn in economic activity, private sector employment continued to increase. The economic environment continues to be marked by strong nominal adjustment. At the end of last year, wage dynamics in the private sector were subdued. The lower-than-projected inflation data at the beginning of the year were primarily driven by favourable effects on the cost side.
According to our forecast, inflation this year is expected to be significantly below the target and may still be in line with the medium-term inflation target in 2015, even as the output gap narrows. The steadily low inflation environment is supported by subdued consumer demand, further restrained growth in nominal wages in the slack labour market environment, weak external inflationary effects and a new round of regulated price cuts announced for this year. At the same time, the weaker forint exchange rate compared to last year may gradually pass through into consumer prices, resulting in a gradual increase in core inflation adjusted for indirect taxes. The development of inflation persistently below the central bank’s target may strengthen the further adjustment in inflation expectations, which may contribute to maintaining a low inflation environment in Hungary over the medium-term through pricing and wage-setting behaviour.
We expect to see continued improvement in economic growth over the forecast horizon. Stronger external economic activity and a weaker exchange rate both facilitate growth in exports. At the same time, the deteriorating and increasingly uncertain economic prospects of emerging countries which are faced with an unstable political situation may hamper Hungarian exports over the short term. In Russia, which has ties with the emerging region, no significant economic growth can be expected in the short run, due to sluggish growth in investments and falling oil prices, which could somewhat curb the upswing in Hungary’s exports. We expect dynamic expansion in exports in the second half of our forecast horizon, driven by Hungary's higher competitiveness resulting from the weaker exchange rate. Public investments financed from EU funds will also support stronger investment activity going forward. Easing lending constraints thanks to the Funding for Growth Scheme and improving real economic prospects support corporate investments by SMEs. We expect a gradual increase in household consumption over our forecast horizon. Rising real household income stemming from low inflation points towards growing household consumption. Nevertheless, factors working in the opposite direction include tight lending conditions, the ongoing reduction in household debt, and households’ presently precautionary stance which is only slowly easing.
In line with stronger real economic growth, we expect a gradual rise in both labour market activity and employment. Hiring in the private sector and public labour programmes may both contribute to a rise in employment. Restrained growth in nominal wages may result from the low inflation environment, firms’ improving profitability, the persistently lax labour market conditions and the adjustment of inflation expectations.
The cyclical position of the real economy (the output gap) may close in the second half of the forecast horizon, mainly due to the performance of exports and stronger investment. Household consumption, which is relevant from the perspective of the inflationary pressure exerted by the Hungarian real economy, may pick up more slowly and fall significantly short of its pre- crisis level even at the end of the forecast horizon. Thus, the real economy environment will continue to exert a disinflationary effect over our forecast horizon. In line with our assumption for external demand and the improvement in Hungarian economic fundamentals, we expect a steady improvement in financial market conditions.
1.1. Inflation forecast
Compared to our December forecast, we have decreased our short-term inflation expectations, but maintain a similar forecast for price increases over the medium term. Inflation is expected to steadily rise towards the medium-term inflation target over our forecast horizon.
The reductions in regulated prices carried out in several steps have decreased inflation considerably over the short run, and inflationary pressure from foreign trade partners might also remain subdued. Restrained wage dynamics and lower inflation expectations generally support the low inflation environment.
Chart 1–1 Fan chart of the inflation forecast
Source: MNB
The CPI may remain substantially below target this year and be close to the price stability target of 3 per cent in 2015. In line with the more favourable underlying inflation trends observed in the past period, inflation in 2014 is expected to be lower than our December forecast and close to the forecast in 2015 (Chart 1-1).
Chart 1–2 HICP inflation in the eurozone
Source: ECB, Consensus Economics
Core inflation excluding indirect tax effects shows historically low dynamics, mainly as a result of restrained inflation in market services and the slowing global price dynamics of imported products. In addition, subdued domestic demand and low wage dynamics contribute materially to restrained price changes in core inflation items. On the other hand, we have raised our forecast for core inflation based on the gradual pass-through of the weaker exchange rate into consumer prices (Chart 1-2).
On the whole, factors determining medium-term inflation trends point to a low inflation environment.
The real economy has a disinflationary impact over the entire forecast horizon. Although the output gap may close in the second half of our forecast period, the structure in which this occurs ensures that inflationary pressures from the real economy should remain subdued.
The narrowing of the output gap will mainly be driven by the recovery in the export sector and investment, while the effect of stronger consumption will only be gradually felt. According to our expectations, although GDP may exceed its pre-crisis level next year, consumption may well fall short of the values observed in the pre-crisis years.
-1 0 1 2 3 4 5 6 7
-1 0 1 2 3 4 5 6 7
2009 2010 2011 2012 2013 2014 2015 2016
Per cent Per cent
inflation target
-1 0 1 2 3 4 5
-1 0 1 2 3 4 5
2005 2006 2007 2008 2009 2010 2011 2012 2013 2014 2015 2016
Per cent Per cent
HICP inflation in the eurozone ECB staff projection
Consensus Economics
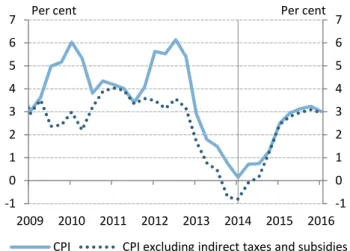
Chart 1–3 CPI with and without indirect taxes and subsidies
Source: MNB
Efforts to restore low profitability may continue to be a determining factor in corporate behaviour. In the low demand environment, price adjustment remains limited, and therefore firms attempt to improve their profitability mainly by cutting wages and other costs. Slack labour market conditions and the downward revision of inflation expectations also contribute to restrained wage dynamics. The persistently low inflation environment may reduce price and wage expectations over the long term, thus helping to maintain low inflation over the medium term (Chart 1-3).
We project subdued price increases in non-core items over the entire forecast horizon. Global crude oil prices have fallen since December and, owing to globally favourable harvest results, unprocessed food prices are low. Futures contracts for both crude oil and foods point to moderate dynamics.
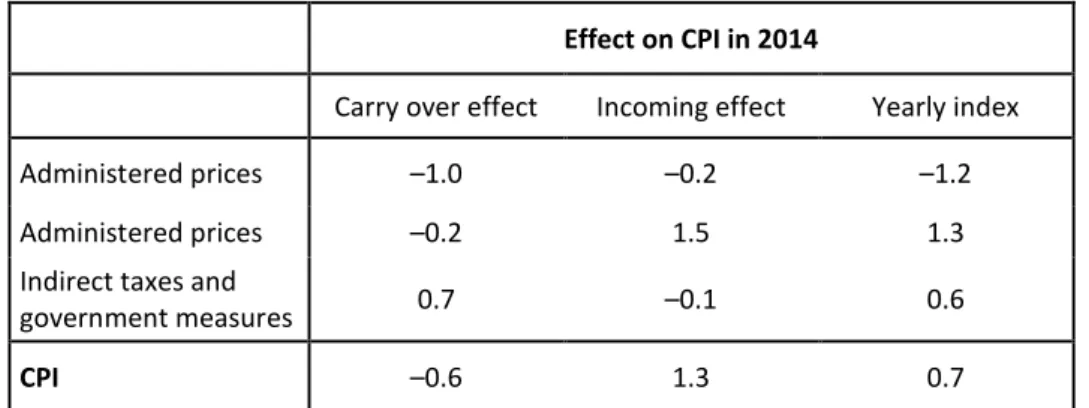
The direct impact of government measures on inflation may remain below the historical average over our entire forecast horizon. The new round of regulated price cuts, passed at the beginning of the year, resulted in a lower price level compared to our December assumption. The impact of this on average inflation for 2014 is -0.2 percentage points and -0.3 percentage points for 2015. In light of this, we maintain the assumption that regulated
energy prices will not rise until the end of our forecast horizon. In addition, we expect restrained dynamics in the regulated prices of non-energy items as well (Chart 1-4).
Chart 1–4 Decomposition of the inflation forecast
Source: MNB
Table 1-1 Details of the inflation forecast
2012 2013 2014 2015
Core inflation 5.1 3.3 3.0 3.5
Contribution to inflation 3.3 2.2 2.0 2.3
Non-core inflation
Unprocessed food 6.8 6.1 -2.0 4.5 Gasoline and
market energy 11.9 -0.9 0.5 2.4 Regulated prices 4.7 -3.7 -6.2 0.9
Total 6.8 -1.2 -3.7 1,9
Contribution to inflation 2.4 -0.5 -1.3 0.7
Inflation 5.7 1.7 0.7 3.0
Source: MNB
On the whole, a steadily low inflation environment is suggested by subdued domestic demand, the predominantly disinflationary government measures and lower inflation expectations. The rise in consumer prices may be far lower than the medium-term inflation target in 2014 and is expected to rise close to the 3 per cent target in the second half of the forecast horizon (Table 1-1).
-1 0 1 2 3 4 5 6 7
-1 0 1 2 3 4 5 6 7
2009 2010 2011 2012 2013 2014 2015 2016 Per cent Per cent
CPI CPI excluding indirect taxes and subsidies
-2 -1 0 1 2 3 4 5 6 7
-2 -1 0 1 2 3 4 5 6 7
2009 2010 2011 2012 2013 2014 2015 2016 Per cent Per cent
Core inflation Non-core inflation Indirect tax effect Consumer price index
Box 1–1 Underlying inflation in our forecast
The MNB has developed various measures of underlying inflation to capture longer-term inflationary trends. Eliminating the transitory effects of highly volatile items and government measures from the price index provides a more reliable picture of underlying inflationary pressure in the economy, particularly over the medium term, which is the relevant horizon for central bank decision making. In our assessment of the inflation stance, we put particular emphasis on monitoring demand-sensitive and sticky-price inflation.
We cannot, however, prepare all of the above indicators in a forward-looking manner, due to the highly aggregated nature of our forecast system and for reasons of calculation methodology. Our forecast captures underlying inflation trends mainly through developments in core inflation adjusted for taxes. Over the past year and a half, this indicator has co-moved closely with the other two underlying measures. A significant gap between core inflation adjusted for taxes and the other two underlying indicators only occurred during periods of food price shocks (2007-2008, 2010-2011); otherwise, the indicators showed similar dynamics.
According to our current forecast, the weaker exchange rate compared to 2013 H2 will gradually shape developments in underlying inflation in the upcoming quarters. The exchange rate is reflected in core inflation adjusted for taxes mainly in the changing price of tradables and, to a smaller degree, of processed foods. However, the subdued domestic demand since the recession may substantially limit the weaker exchange rate from being passed on to consumer prices and thus pass-through may be smaller compared to the pre-crisis period.
Over the medium term, core inflation is shaped by persistently low imported inflation, the adjustment of inflation expectations and depressed developments in wages; as a result, core inflation adjusted for taxes may gradually return to a value consistent with price stability from 2015 (Chart 1-5).
Chart 1–5 Forecast of core inflation excluding indirect taxes
Source: MNB 0
1 2 3 4 5 6
2004 2005 2006 2007 2008 2009 2010 2011 2012 2013 2014 2015 2016 Per cent
core inflation excluding indirect taxes sticky price inflation
demand sensitive inflation
Box 1–2 Tax effects shaping current inflationary trends
Recent years have seen the introduction of several tax changes which resulted in temporary increases in inflation. Changes in indirect taxes exert a significant impact in terms of monetary policy, if they entail permanent price increases by spilling over through corporate cost structures. However, the probability of indirect taxes triggering second-round effects is low and they are not expected to affect medium-term trends. In light of this, it is warranted to adjust time series for indirect tax effects when considering monetary policy.
Value added tax is a typical example of the impact of indirect taxes. Consumer prices are adjusted for VAT based on the estimated effect, as VAT may be passed on to different degrees based on the prevailing state of the economy. If demand is weak, hikes in VAT are unlikely to fully make their way into consumer prices. The price index is also adjusted for the effect of excise duties, the other typical form of indirect tax, and other sales taxes.
Several one-off measures were recently introduced (such as the increase in the retail margin for tobacco products1) which do not qualify as classical tax changes. It is warranted to eliminate these effects, because from a monetary policy point of view their impact mechanism on the consumer price index completely resembles a change in a consumption tax: they resulted in a temporary rise in inflation for a narrow range of goods and will presumably have no second-round inflationary effects.
In February 2014, the CPI stood at 0.1 per cent, while inflation adjusted for indirect taxes2 as determined by the MNB was - 0.7 per cent. For the most part, the gap between inflation and inflation adjusted for indirect taxes stems from the following measures: the introduction and increase in the financial transaction levy (January and August 2013), the increase in the retail margin for tobacco products (July 2013) and the two monthly free cash withdrawals of up to HUF 150,000 introduced in February of this year (Table 1-2).
Table 1-2 Indirect tax effect in consumer price index estimated by MNB
Source: MNB
1 See the June 2013 Inflation Report for a more in-depth analysis of the increase in the retail margin on tobacco products.
2 The difference between the constant tax rate CPI published by the Central Statistical Office, and inflation adjusted for indirect taxes calculated by the MNB stems from the fact that the indirect tax effect estimated by the MNB differs from the technical effect applied by the CSO for determining the constant tax rate CPI in terms of both the tax measures taken into account and their quantification.
February 2014 2014 average February 2014 2014 average
Increase in retail margin on cigarettes 0.7 0.5 1,0 0.7
Financial transaction levy 0.3 0.2 0.5 0.3
Two cash withdrawals free of charge every month up to a total of 150,000 HUF -0.1 -0.1 -0.2 -0.2
0.8 0.6 1.3 0.9
Total
Tax content Inflation Core inflation
1.2. Real economy forecast
We expect to see continued improvement in economic growth over the forecast horizon, similarly to our December predictions. Investment and exports may be the main drivers of growth. Economy-wide investments are primarily fuelled by government investments implemented with EU funding, while the central bank’s Funding for Growth Scheme substantially eases the financing constraints on small and medium-sized enterprises, thus boosting investment activity in the private sector. Despite the increase in real wages, household consumption may only pick up gradually due to tight lending conditions, the reduction of debt accumulated prior to the crisis and the slow easing of precautionary considerations.
In line with our December forecast, the Hungarian economy continued growing in Q4, albeit at a somewhat slower rate compared to the previous quarter. Monthly indicators of production reveal that economic performance maintained the same growth structure as in previous quarters. Industrial output increased, driven by the automotive industry and related sectors in late 2013, while the electronics sector saw output decline.
Construction industry output expanded significantly at the end of the year, thanks in part to the mild weather compared to previous years. The construction industry’s strong performance was fuelled mainly by the increased utilisation of European Union development funds, which primarily drove the investment activity of sectors linked to the state. Sectors producing for the domestic market (retail and market services) showed slow improvement in Q4. After last year’s correction of poor agricultural harvest results from 2012, we forecast average harvest figures for this year (Chart 1-6).
Chart 1–6 Fan chart of the GDP forecast (based on seasonally adjusted and reconciled data)
Source: MNB
Economic growth may continue strengthening over our forecast horizon. In line with our December forecast, economic growth should occur in a more balanced structure than before, with domestic expenditure also picking up alongside exports. The gradual improvement in international activity, a more pronounced utilisation of EU funds, accommodating monetary conditions and the Funding for Growth Scheme all foster economic growth (Chart 1-7).
Chart 1–7 Changes in GDP growth
Source: CSO, MNB
Hungary's export performance may develop in line with strong external demand. Growth in the euro area, Hungary's main export market, exceeded expectations in Q4, and the short-term growth forecast is also somewhat more positive. This is partly offset by the fact that, in parallel with the improving economic outlook for developed countries, emerging markets show signs of slowing; therefore, on the whole we expect similar
-8 -7 -6 -5 -4 -3 -2 -1 0 1 2 3 4 5
-8 -7 -6 -5 -4 -3 -2 -1 0 1 2 3 4 5
2009 2010 2011 2012 2013 2014 2015 2016
Per cent Per cent
-12 -10 -8 -6 -4 -2 0 2 4 6
-12 -10 -8 -6 -4 -2 0 2 4 6
2005 2007 2009 2011 2013 2015 Per cent Per cent
Final consumption of households Actual final consumption of government Gross fixed capital formation
Changes in inventories Net export
GDP
demand conditions over our forecast horizon. A weaker exchanged rate compared to December may significantly boost growth in Hungary’s export market share. Export sales may primarily be driven by additional capacity expansion in the automotive industry: with gradual increases in production, the number of vehicles manufactured in Hungary could rise by one-third during 2014. In addition, we expect a pick-up in other industrial sectors as well, and sectors that have long been in decline may see a turnaround in this negative trend. Along with improving exports, we expect a gradual increase in import demand, and net exports’ contribution to growth may be reduced by the combination of steadily increasing consumption, the utilisation of EU funds, and stronger investment activity thanks to the FGS (Chart 1-8).
Chart 1–8 Changes in export market share
Source: MNB
Expanding public investments implemented from EU funds are contributing to significant investment growth. The accelerated use of transfers from the EU’s 2007-2013 budget period notably increases the volume of co-funded investment projects over short run (Chart 1-9).
Chart 1–9 Development of sectoral investment
Source: CSO, MNB
Corporate investment may grow significantly, in line with the improving economic outlook and easing lending constraints. The Funding for Growth Scheme represents a significant contribution to easing the financing constraints of small and medium-sized enterprises, thereby facilitating the implementation of investment projects which allow for the preservation and expansion of capital.
The FGS results in expansion of bank lending to small and medium-sized enterprises over the entire forecast horizon and the decline in lending to the whole corporate sector may come to an end. This will be accompanied by a more balanced structure, due to the increase in long-term, forint-denominated loans (Chart 1-11 and Chart 1-12).
Chart 1–10 The use of household income
Note: As percentage of disposable income. Net financial savings of households exclude mandatory contributions payable to the private pension funds.
Source: CSO, MNB
Household consumption decisions are characterised by two trends. On the one hand, the low inflation -15
-10 -5 0 5 10 15 20
-15 -10 -5 0 5 10 15 20
2000 2002 2004 2006 2008 2010 2012 2014 Per cent Per cent
Export market share Export External demand
0 5 10 15 20 25
2005 2006 2007 2008 2009 2010 2011 2012 2013 2014 2015
Proportional to GDP (per cent)
Corporate investment Government investment Household investment
70 75 80 85 90 95
-5 0 5 10 15 20
2000 2001 2002 2003 2004 2005 2006 2007 2008 2009 2010 2011 2012 2013 2014 2015 Percentage of PDI
Percentage of PDI
Households net borrowing Firms net borrowing
environment has significantly lifted the purchasing power of household income, which fosters a rise in consumption.
On the other hand, efforts to reduce debts accumulated prior to the crisis remain a key pattern for a significant share of the population. Moreover, the strict credit conditions and the only slowly easing precautionary considerations are holding back a rise in household consumption demand. On the whole, we predict a slow and gradual rise in household consumption (Chart 1—10).
Chart 1–11 Our forecast for household and corporate lending
Note: Includes the fall in stocks of loans due to write-offs and sales, which means that regarding from transaction side in 2013 Q4 there is a 210 HUF billion fall.
Source: MNB
Chart 1–12 Forecast for lending to non-financial corporates and the SME sector
Note: Year on year change.
Source: MNB
In the second part of the forecast period, aggregate output may reach its potential level determined by the production capacities of the economy and thus the output gap may close, driven mainly by a pick-up in exports and investment. Domestic demand, which is relevant in terms of inflationary pressure of domestic origin, could fall short of its pre-crisis level even at the end of the forecast horizon, despite the steady increase (Chart 1—13). The narrowing of the output gap may take place in a structure that allows the general real economy environment to retain its disinflationary effect over our entire forecast horizon.
Chart 1–13 Changes in GDP and main components since the crisis
Source: CSO -300
-250 -200 -150 -100 -50 0 50 100 150 200
2009 2011 2013 2015 HUF
billion
Firms net borrowing -800 -700 -600 -500 -400 -300 -200 -100 0
2009 2011 2013 2015 HUF
bln
Households net borrowing
-10 -8 -6 -4 -2 0 2 4 6
-10 -8 -6 -4 -2 0 2 4 6
2010 2011 2012 2013 2014 2015 Per cent Per cent
Lending to non-financial corporates Lending to SMEs
70 80 90 100 110 120 130 140
2007 2008 2009 2010 2011 2012 2013 2014 2015
2007 = 100
GDP Consumption
Export Investment
Box 1–3 One-off effects in domestic exports and industrial production
In the years following the outbreak of the crisis, the Hungarian economy underwent a major transformation. Net exports contributed significantly to the increase in gross domestic product, the level of which was also boosted by the rise in export sales from 2009 and a decline in import demand amidst restrained internal demand. The continuous increase in exports was accompanied by a restructuring in the manufacturing sector: over the past five years, the share of road vehicle production and that of the related sectors have increased sharply within industrial production, while the share of the sector of computers, electronics and optical products has gradually declined. Since the post-crisis deterioration of existing capacities was faster in the indicators of production than the implementation of new investment projects and the installation of new capacities, Hungary’s export market share has decreased somewhat in recent years as a result of these combined effects.
Changes in industrial production and exports can be better understood once one-off effects are quantified.
Demand in the automobile market fell significantly across Europe, and the recovery to pre-crisis levels will be a slow process, while at the same time demand in developing countries remained strong. Asian exports – mainly connected to Germany – are among the drivers of growth in Europe, which can also affect the growth prospects of the Hungarian economy. All companies engaged in automobile production in Hungary during the pre-crisis years (Audi, GM, Suzuki) have expanded their activities to varying degrees in recent years and with the construction of the new Mercedes factory in Kecskemét, another important player has entered the Hungarian manufacturing sector. As a net result of these effects, the capacities of the automobile industry have nearly doubled, and by 2016 production may commence, subject to sufficient demand, at all new plants.
Similarly, adverse developments affecting the manufacturing sector have also resulted from the market environment which was altered by the crisis. As regards the electronics sector – which had boasted a significant weight in previous periods – a wide range of companies (Flextronics, Elcoteq, Jabil Circuits) terminated production partly or fully, resulting in significant layoffs. Nokia was one of the biggest losers in this process in Hungary, as it had to reconsider its activities in Hungary due to the change in its global position. Production in the Komárom-based plant and several other activities were discontinued, affecting two-thirds of the former domestic export performance of the Group (Chart 1—14).
Chart 1–14 Production structure shift in manufacturing sector
Source: CSO
The changes that started in recent years in vehicle production and the electronics sector are still in progress and, exerting opposing effects, this process greatly influence developments in industrial production and export sales. Output in vehicle production already exceeds its pre-crisis level and looking ahead the share of this sector in industrial production and exports may increase further. By contrast, the share of the electronics sector in industrial production has shrunk to one-half of its earlier share. One-off effects can be quantified based on the public profit and loss accounts of the companies concerned, by determining – relative to pre-crisis production levels and export sales revenues and also taking into account the expected
17,1 17,9 17,4 16,3 16,3 16,6 15,4
14,6 14,6 16,2 14,4 14,5 15,3 15,5
19,8 21,2 20,1 21,1 22,6 23,5 22,9
9,3 9,5 10,1 10,1 11,2 11,5 11,5
19,4 17,5 19,1 20,3 17,2 13,9 11,7
19,8 19,3 17,1 17,6 18,1 19,2 23,0
0%
20%
40%
60%
80%
100%
2007 2008 2009 2010 2011 2012 2013
Other industries
Food and other light industry Chemicals
Other machinery and equipment Electronics and optics
Motor vechicles and transport equipment
maximum capacity – the extent of the extra export performance to be generated by the new investment projects in the vehicle manufacturing sector. The negative results stemming from the deterioration of electronics sector capacities can be quantified in a similar manner. Overall, we can conclude that – assuming that automobile production runs at full capacity in the coming years – the extra performance it generates will exceed the loss in capacity in the electronics sectors, and thus after years of decline, Hungary’s export share may begin to increase again (Chart 1—15).
Chart 1–15 One-off effects in manufacture of motor vehicles and electronics
Source: CSO -2%
-1%
0%
1%
2%
2011 2012 2013 2014 2015 2016
Percentage point
Closed capacities New capacities Overall effect
1.3. Labour market forecast
We project both activity and employment in the whole economy to rise over the forecast horizon. Hiring in the private sector and public labour programmes should both be able to contribute to a rise in employment. The rate of unemployment may remain below 9 per cent over the forecast horizon. The number of people employed in the private sector may also increase gradually as the economy recovers. Part-time employment forms may continue to gain ground, resulting in a slower rise in the number of hours worked compared to the expansion of employment.
In line with slack labour market conditions and companies’
wage and other cost cuts aimed at restoring their profitability, we expect wage dynamics to be subdued.
Employment in the private sector increased until 2013 Q4, but the average number of work hours per capita was low. The trend-like growth in part-time employment contributed to this, facilitated by the new Labour Code via easier application of flexible forms of employment.
In our forecast, employment increases in parallel with output growth. The number of employed in the private sector may reach pre-crisis levels by the end of our forecast horizon. At the same time, we expect a further rise in part-time employment, as a result of which the corporate sector’s effective labour demand may increase more moderately than indicated by the employment figures. Public employment programmes may continue to play a key role in the developments in whole-economy employment (Chart 1—16).
Chart 1–16 Employment and unemployment, total economy
Source: CSO
We expect restrained wage dynamics, in line with the slack labour market conditions. Weak domestic demand limits companies’ ability to increase prices, and thus companies will primarily aim to curb their production costs in order to improve their profitability. Restrained wages could be a key element in this effort, supported by the overall low inflation environment and the gradual decline in inflation expectations. As the minimum wage increase envisaged for 2014 is only slightly higher than the average wage increase expectations, it is not expected to cause significant wage extrusion (Chart 1—17).
Chart 1–17 Evolution of productivity and real wagecosts
Source: CSO, MNB
Persistently below-target inflation may facilitate a decline in inflation expectations, which in turn may contribute to the stabilisation of low wage dynamics. Overall, inflationary pressure from the labour market remains weak.
0 2 4 6 8 10 12
48 50 52 54 56 58 60
2009 2010 2011 2012 2013 2014 2015 Per cent Per cent
participation rate employment rate
unemployment rate (right scale)
-10 -8 -6 -4 -2 0 2 4 6 8 10
2009 2010 2011 2012 2013 2014 2015
Annual change (per cent)
productivity real wagecosts
Table 1-3 Changes in our projections compared to the previous Inflation report
2013 2014 2015
Actual Projection
December Current December Current
Inflation (annual average)
Core inflation 3.3 3.0 3.0 3.0 3.5
Core inflation without indirect tax effects 1.5 2.2 2.1 2.8 3.3
Inflation 1.7 1.3 0.7 2.8 3.0
Economic growth
External demand (GDP-based) 0.6 1.7 1.7 2.2 2.2
Household consumer expenditure 0.2 1.5 1.3 1.8 1.7
Government final consumption expenditure 1.3 0.7 0.7 1.4 1.6
Fixed capital formation 5.9 7.4 7.3 4.8 3.6
Domestic absorption 0.8 2.4 2.3 2.3 2.1
Export 5.3 5.4 5.8 6.1 6.5
Import 5.3 6.0 6.2 6.4 6.4
GDP* 1.2 2.1 2.1 2.4 2.5
External balance1 (2013 data is forecast)
Current account balance 3.2 2.8 3.0 3.2 3.4
External financing capacity 6.8 5.5 6.3 5.8 6.5
Government balance1,6
ESA balance (2013 data is preliminary) -2.5 -2.5 -2.9 -2.9 -3.0
Labour market
Whole-economy gross average earnings2 3.3 3.9 3.8 5.1 6.1
Whole-economy employment 1.6 1.7 1.9 0.3 0.1
Private sector gross average earnings3 3.6 2.8 2.4 3.5 3.7
Private sector employment 0.8 1.3 1.2 0.9 1.0
Private sector unit labour cost4 1.7 1.4 1.9 1.1 1.4
Household real income5 1.5 1.8 2.0 1.2 1.3
1 As a percentage of GDP.
2 Calculated on a cash-flow basis.
3 According to the CSO data for full-time employees.
4 Private sector unit labour costs calculated with a wage indicator excluding the effect of whitening and the changed seasonality of bonuses and domestic employees.
5 MNB estimate.
6
With complete cancellation of free reserves.
* Data adjusted for calendar effects
Table 1-4 MNB baseline forecast compared to other forecasts
2013 2014 2015
Consumer Price Index (annual average growth rate, %)
MNB (March 2014) 1.7 0.7 3.0
Consensus Economics (February 2014)¹ 1.7 0.7 - 1.4 - 2.5 2.3 - 3.0 - 4.4
European Commission (February 2014) 1.7 1.2 2.8
IMF (October 2013) 2.3 3.0 3.0
OECD (November 2013) 1.9 2.1 3.5
Reuters survey (February 2014)¹ 1.7 0.8 - 1.3 - 2.6 2.0 - 2.85 - 3.5
GDP (annual growth rate, %)
MNB (March 2014) 1.2 2.1 2.5
Consensus Economics (February 2014)¹ 1.1 1.3 - 1.9 - 2.8 1.3 - 2.1 - 3.5
European Commission (February 2014) 1.1 2.1 2.1
IMF (October 2013) 0.2 1.3 1.5
OECD (November 2013) 1.2 2.0 1.7
Reuters survey (February 2014)¹ 1.1 1.1 - 1.8 - 2.2 1.3 - 1.9 - 2.5
Current account balance³
MNB (March 2014) 3.2 3.0 3.4
European Commission (February 2014) 2.9 2.7 2.6
IMF (October 2013) 2.2 2.0 1.3
OECD (November 2013) 1.8 2.1 2.4
Budget deficit (ESA-95 method)3,4
MNB (March 2014) 2.5 2.9 3.0
Consensus Economics (February 2014)¹ 2.8 2.7 - 3.0 - 4.0 2.5 - 2.8 - 3.1
European Commission (February 2014) 2.4 3.0 2.9
IMF (October 2013) 2.7 2.8 3.0
OECD (November 2013) 2.7 2.9 2.9
Reuters survey (February 2014)¹ 2.6 2.8 - 3.0 - 3.5 2.5 - 2.9 - 3
Forecasts on the size of Hungary's export markets (annual growth rate, %)
MNB (March 2014) 1.1 4.7 5.0
European Commission (February 2014)² 1.1 4.5 6.1
IMF (October 2013)² 1.7 3.9 3.8
OECD (November 2013)² 1.2 4.5 5.5
Forecasts on the GDP growth rate of Hungary's trade partners (annual growth rate, %)
MNB (March 2014) 0.6 1.7 2.2
European Commission (February 2014)² 0.6 1.9 2.3
IMF (October 2013)² 0.8 1.8 2.3
OECD (November 2013)² 0.5 1.8 2.1
1 For Reuters and Consensus Economics surveys, in addition to the average value of the analysed replies (i.e. the median value), we also indicate the lowest and the highest values to illustrate the distribution of the data.
2 Values calculated by the MNB; the projections of the named institutions for the relevant countries are adjusted with the weighting system of the MNB, which is also used for the calculation of the bank’s own external demand indices. Certain institutions do not prepare forecast for all partner countries.
3 As a percentage of GDP.
4 With complete cancellation of free reserves.
Sources: Eastern Europe Consensus Forecasts (Consensus Economics Inc. (London), February 2014); European Commission Economic Forecasts (February 2014); IMF World Economic Outlook Database (October 2013); Reuters survey (February 2014); OECD Economic Outlook No. 93 (November 2013).
*Data adjusted for calendar effects.
2. EFFECTS OF ALTERNATIVE SCENARIOS ON OUR FORECAST The Monetary Council identified three alternative scenarios around the baseline projection of the March Report on Inflation, which might significantly influence the future conduct of monetary policy.
In the alternative scenario assuming a persistently low external inflation environment and a slower-than-expected recovery in external demand, the inflation target may be achieved with looser monetary conditions than assumed in the baseline scenario. In the risk scenario assuming an unfavourable external environment and higher investor risk aversion, inflation moves in line with price stability in the medium term under considerably tighter monetary conditions than implied by the baseline projection. The third scenario, assuming a pick-up in domestic employment and consumption, resulting in weaker domestic disinflationary pressures, also implies a tighter monetary policy stance.
Incoming data in recent months indicate that global inflation was moderate, which significantly contributed to the fall in inflation in Hungary as well in 2013. Euro- area inflation was below expectations in recent months and is expected to remain subdued going forward. Global inflation is expected to remain moderate according to the baseline projection.
Low euro-area inflation, which is steadily below expectations and the related deflation fears may raise the possibility of a slower-than-expected recovery in the euro area resulting in a more open cyclical position of Hungary’s external markets than presently assumed. Furthermore, tapering of the Federal Reserve’s asset purchase programme may warrant tighter monetary policies in certain emerging countries, which could also contribute to slowing global economic activity and to a decrease in commodity prices. If weak external demand exerts a stronger disinflationary effect, the external inflation environment may remain persistently low, resulting in lower imported inflation which could mainly be reflected in more moderate price increases of tradables and food.
In light of the above, the scenario assumes a slower recovery in external demand and lower commodity prices, resulting in low external inflation and lower imported inflation for a long period of time. In addition, weaker external demand also dampens Hungarian exports, leading to a slower closing of the domestic output gap, which reduces the price pressure exerted by aggregate demand. In this scenario, as a result of stronger
disinflation, the inflation target can be achieved in the medium term with looser interest rate conditions than those assumed in the baseline scenario, while loose monetary policy can only partially offset the unfavourable growth effects of weaker demand (Chart 2—1).
Chart 2–1 The impact of the risk scenarios on our inflation forecast
Source: MNB
International investor sentiment has been volatile in the past quarter, and Hungarian risk premia remained essentially unchanged, while the exchange rate deteriorated amidst substantial volatility. In addition, the divergence in growth prospects of developed and emerging economies continued as growth prospect in the latter group gradually deteriorated.
There are numerous risk factors that may have a negative impact on Hungary's external demand and risk premium.
These include a deterioration in global risk appetite, due the vulnerability of certain emerging economies and the future withdrawal of unconventional tools applied by globally important central banks. The recent financial market turbulence in vulnerable emerging economies may result in these countries facing a permanently higher risk premium, tighter monetary conditions and more sluggish growth in the near future. This environment may be conducive to more financial market turmoil, which would in turn lead to a deterioration of the risk perception of most emerging countries and could also spread to the region and Hungary. There is also significant uncertainty about economic performance in certain emerging countries (such as Russia, China and India): fragile growth prospects or possible deceleration in these countries could have a negative impact on global investor sentiment.
0 1 2 3 4 5 6
2010 2011 2012 2013 2014 2015 2016 Per cent
Base scenario
Low external inflation environment
Unfavourable ext. environm. and higher risk premium Weaker domestic disinflation
Finally, the potential challenges faced by the euro-area periphery’s banking sector may also involve a substantial risk: protracted balance sheet adjustments by more vulnerable banks may trigger tensions on the financial markets and undermine investor sentiment. The current Ukrainian crisis presents similar risks, fuelled by concerns regarding its banking system and potential sovereign default.
In light of the above, this scenario assumes lower external demand and an increase in the risk premium due to external factors. The deteriorating global investor climate raises Hungarian risk premia, which restrains bank lending through higher funding costs, and consequently credit conditions both for firms and households may tighten. A rise in the risk premium causes exchange rate depreciation, which in turn increases inflation. Due to the deterioration in external demand and the impact of the risk premium on lending, growth in this scenario is lower than outlined in the baseline projection. In terms of inflation developments, the effect of the weaker exchange rate is only partially offset by the wider output gap resulting from slower growth and the disinflationary impact of the external environment. Against the backdrop of deteriorating risk perceptions and rising inflation, tighter monetary policy compared to the baseline scenario may ensure that inflation is in line with the 3 percent target by the end of the forecast horizon (Chart 2—2).
Chart 2–2 The impact of the risk scenarios on our GDP forecast
Source: MNB
Past quarters have been characterised by restrained inflation and wage growth in line with subdued domestic demand, which allows firms to stabilise their profitability by curbing wage increases. In addition, households’
protracted balance sheet adjustment and the subdued dynamics of core income point to slow growth in consumption.
At the same time, several factors suggest that wage dynamics and the consumption path might be higher than assumed in the baseline scenario. In line with the upswing in economic activity and employment, the labour market may become tighter. This is suggested by last year’s marked decline in the unemployment rate, the rise in the number of new non-subsidised jobs and in private sector employment. Sectoral labour market indicators also suggest that the shortage of labour is becoming a constraint in production for an increasing number of firms.
A less loose labour market does not allow for stronger wage adjustment by firms, and thus companies may pass on rising wage costs in their prices, in a trend that may grows as economic activity accelerates. In addition, the stronger-than-expected growth in labour demand may also exert inflationary pressure.
In addition to the labour market trends, there are also several upside risks related to the future development of consumption. First, independently of the real economic indicators, a positive impact on confidence indicators has been observed, which may trigger a stronger-than- expected rise in consumption compared to the baseline scenario. Moreover, substantial deleveraging has occurred in the household sector in the recent past, and consequently there may have been an increase in the proportion of households with easing balance sheet adjustment constraints and thus higher disposable income.
Finally, the recent rise in employment may also foster more favourable developments in households’ income position, and the low inflation since early 2013 coupled with certain government measures may also improve households’ purchasing power.
A tighter labour market compared to the baseline scenario and the increase in households’ disposable income could trigger a faster closing of the output gap – which can be viewed as a measure of inflationary pressure. Higher wage dynamics materialising in a tighter labour market represent cost pressures for firms. In a context of higher wage costs and rising demand, firms can improve their profitability by increasing retail prices, which strengthens inflationary pressure. In addition, households’
improved income position and lower balance sheet adjustment pressure entail a higher consumption path. On the whole, rising domestic demand entails a narrower output gap and lower disinflationary effect, and therefore -3
-2 -1 0 1 2 3
2010 2011 2012 2013 2014 2015 2016 Per cent
Base scenario
Low external inflation environment
Unfavourable ext. environm. and higher risk premium Weaker domestic disinflation
in this scenario tighter monetary conditions than in the baseline scenario are needed for inflation to remain in line with the 3 per cent target (Chart 2—3).
Chart 2–3 Risk map: The effect of alternative scenarios on baseline forecast
Note: The risk map presents the average difference between the inflation and growth path of the alternative scenarios and the baseline forecast on the forecast horizon. The red markers mean tighter and the green markers mean looser monetary policy than the baseline forecast.
Source: MNB -0,6 -0,4 -0,2 0,0 0,2 0,4 0,6
-0,4 -0,2 0,0 0,2 0,4
Inflation
GDP (y/y growth) Low external inflation environment
Unfavourable ext. environm. and higher risk premium Weaker domestic disinflation
3. MACROECONOMIC OVERVIEW
3.1. International environment
The global economy continued to recover slowly during the past quarter. The growth environment developed on different paths for the developed and emerging economies. Previously fast-growing emerging economies were characterised by slowing growth in the final months of 2013, while at the same time a broader group of advanced economies showed signs of strengthening economic activity. Declining commodity prices and the present moderate growth in the global economy have a disinflationary effect, and consequently inflation rates stayed below the inflation targets of the major central banks. The Fed began to taper its asset purchases, while some central banks indicated in forward guidance that the current loose monetary conditions may persist for an extended period of time. The turbulence seen in the emerging markets at the beginning of the year primarily affected countries with weak economic fundamentals and resulted in interest rate hikes in several cases.
3.1.1. Developments in global economic activity
During the fourth quarter, global economic activity picked up. Compared to earlier quarters, higher annual rates of growth were observed in the most important economic regions. The differential between the growth of developed and emerging economies increased; i.e. in contrast to the acceleration seen in the former group, output growth has slowed in various emerging countries. The diverging paths of economic activity were the combined result of various factors. Fiscal consolidation eased up in advanced economies, mitigating the negative impact of fiscal policy on growth. In addition, the forward guidance published by central banks in several developed countries indicated that monetary conditions may stay loose for an extended period of time. In developed economies, bank lending may show signs of picking up (although from a low base), due to easing credit conditions and stronger economic activity. The financial fragmentation observed in the euro area declined, while lending prospects improved. In contrast to the above, the central banks of various emerging countries were compelled to tighten their policies as a result of increasing risk premiums and weakening exchange rates in the wake of financial tensions. The lending boom seen recently may be followed by more restrained credit conditions.
Furthermore, the decline in commodity prices due to deceleration in emerging economies may have an adverse effect mostly on net importers of commodities. On the
whole, while the gradual global recovery is expected to continue in the quarters ahead, growth rates may differ across regions (Chart 3—1).
Chart 3–1 GDP growth in the major economies (seasonally adjusted quarterly change)
Source: OECD
The continued growth of the US economy was accompanied by increasing consumer confidence and improvement in the housing market. In the fourth quarter, GDP increased by 2.5 per cent year-on-year. In addition to rising household consumption and the easing of fiscal tightening, this faster growth was also due to favourable net exports. Consumption was supported by the improving labour market and by rising house prices and stock exchange indices. At the end of the year, economic indicators showed a slight deceleration, which may also have reflected the impact of adverse weather conditions. Unemployment in the US has continued to fall.
By January, the unemployment rate declined to 6.6 per cent, approaching the 6.5 per cent threshold set in the forward guidance of the central bank. One negative aspect, however, is the decline in the activity rate, which may indicate discouraged workers exiting the labour market.
Moreover, in some cases, the number of hours worked is still low due to cyclical reasons. Taking the improving macroeconomic environment into consideration, the Fed decided to start tapering its asset purchases in December.
Last year, the rate of growth accelerated in Japan. In addition to expansive monetary and fiscal policies, this was also fostered by the depreciation of the yen. Exports continued to increase, while domestic demand strengthened as a result of private sector consumption and
-5 -4 -3 -2 -1 0 1 2 3
2009 2010 2011 2012 2013
Per cent
Japan Euro area USA
Advanced economies
-4 -3 -2 -1 0 1 2 3 4 5
2009 2010 2011 2012 2013
Per cent
Russia China Developing
economies