Research Article
Mild Type 2 Diabetes Mellitus Reduces the Susceptibility of the Heart to Ischemia/Reperfusion Injury: Identification of Underlying Gene Expression Changes
Sevil Korkmaz-Icöz,
1Alice Lehner,
1Shiliang Li,
1Adrian Vater,
1Tamás Radovits,
2Péter Heged 4 s,
1,2Mihály Ruppert,
1Paige Brlecic,
1Markus Zorn,
3Matthias Karck,
1and Gábor Szabó
11Department of Cardiac Surgery, University of Heidelberg, 69120 Heidelberg, Germany
2Heart and Vascular Center, Semmelweis University, 1122 Budapest, Hungary
3Department of Internal Medicine I, University of Heidelberg, 69120 Heidelberg, Germany
Correspondence should be addressed to Sevil Korkmaz-Ic¨oz; korkmaz sevil@hotmail.com Received 25 February 2015; Revised 18 May 2015; Accepted 26 May 2015
Academic Editor: Andrea Scaramuzza
Copyright © 2015 Sevil Korkmaz-Ic¨oz et al. This is an open access article distributed under the Creative Commons Attribution License, which permits unrestricted use, distribution, and reproduction in any medium, provided the original work is properly cited.
Despite clinical studies indicating that diabetic hearts are more sensitive to ischemia/reperfusion injury, experimental data is contradictory. Although mild diabetes prior to ischemia/reperfusion may induce a myocardial adaptation, further research is still needed. Nondiabetic Wistar (W) and type 2 diabetic Goto-Kakizaki (GK) rats (16-week-old) underwent 45 min occlusion of the left anterior descending coronary artery and 24 h reperfusion. The plasma glucose level was significantly higher in diabetic rats compared to the nondiabetics. Diabetes mellitus was associated with ventricular hypertrophy and increased interstitial fibrosis.
Inducing myocardial infarction increased the glucose levels in diabetic compared to nondiabetic rats. Furthermore, the infarct size was smaller in GK rats than in the control group. Systolic and diastolic functions were impaired in W + MI and did not reach statistical significance in GK + MI animals compared to the corresponding controls. Among the 125 genes surveyed, 35 genes showed a significant change in expression in GK + MI compared to W + MI rats. Short-term diabetes promotes compensatory mechanisms that may provide cardioprotection against ischemia/reperfusion injury, at least in part, by increased antioxidants and the upregulation of the prosurvival PI3K/Akt pathway, by the downregulation of apoptotic genes, proinflammatory cytokine TNF- 𝛼, profibrogenic TGF-𝛽, and hypertrophic marker𝛼-actin-1.
1. Introduction
Diabetes mellitus (DM) is a common, chronic, metabolic syndrome characterized by hyperglycemia, resulting from defects in insulin secretion, insulin effects, or both. Type 2 diabetes accounts for more than 90% of all cases and is often associated with hyperinsulinaemia, hyperglycaemia, and dys- lipidaemia. DM can affect the cardiac structure and function in the absence of hypertension, coronary artery disease, or hyperlipidemia, a phenomenon known as diabetic cardiomy- opathy. Diabetic cardiomyopathy is characterized by ventric- ular dilatation, myocyte hypertrophy, prominent interstitial fibrosis, and decreased or sustained systolic function [1] in
the presence of a diastolic dysfunction [2]. However, DM not only affects the myocardium, but also leads to vascu- lar complications. Macrovascular complications of DM are responsible for the high incidence of vascular diseases, such as myocardial infarction, which is caused by an imbalance between the coronary blood flow and the metabolic demand of the myocardium. Clinical studies have shown that patients with DM are at a greater risk for myocardial infarction and that, after an infarction, diabetes increases the risk for the development of left-ventricular dysfunction and heart failure when compared with nondiabetic individuals [3,4].
Additionally, morbidity and mortality rates after myocardial infarction are significantly higher in diabetic patients than
Volume 2015, Article ID 396414, 16 pages http://dx.doi.org/10.1155/2015/396414
in nondiabetic patients [5]. Myocardial infarct size is a primary determinant of the prognosis in patients with acute myocardial infarction. Although clinical studies showed that DM increased the susceptibility of the myocardium to ischemia/reperfusion injury [6, 7], infarct size studies in diabetic animal models showed quite contradictory results, especially at the early stage of the disease. It appears that the susceptibility of the postischemic myocardial injury of the diabetic heart is dependent on the duration of ischemia, the duration and the stage of the diabetes, and/or the metabolic profile. Evidence suggests that the ischemic hearts from the mildly diabetic animals are resistant to ischemia [8], and the severely diabetic hearts are more prone to ischemic injury [9]. Several mechanisms have been proposed to explain the cardioprotective property of a high glucose exposure, by an increase in survival pathways, such as antiapoptotic factor Bcl-2, and prosurvival factors such as protein kinase B (Akt), the inactivation of the proapoptotic factor bad, inappropriate expression of proangiogenic vascular endothelial growth factor (VEGF), hypoxia inducible factor 1𝛼, and protein kinase C-𝜀[10].
The Goto-Kakizaki (GK) rat, a model of type 2 diabetes, was developed from a stock of Wistar rats, by selective breeding over many generations of rats with the highest blood glucose levels during an oral glucose tolerance test [11].
GK rats develop mild hyperglycemia and hyperinsulinemia and are not associated with the development of obesity, hypertension, or hyperlipidemia. The spontaneous diabetic GK rat thus offers a convenient model for studying the pathogenesis of diabetic cardiomyopathy, independent from the effect of hyperlipidemia, obesity, or hypertension.
Taking this into consideration, and in order to provide further insight into the understanding of the myocardial cel- lular/molecular events associated with short-term diabetes- induced cardioprotection, we investigated the effects of a myocardial ischemia/reperfusion injury on metabolic and functional changes and on cardiac gene expression patterns in GK rats. To that end, we evaluated in vivo the left- ventricular mechanical function with a Millar pressure- volume conductance catheter system, assessed biochemical and histopathological changes, and identified changes in myocardial gene expression relevant to diabetes, apoptosis, oxidative stress, PI3K/Akt signalling, inflammation, cardiac fibrosis, and hypertrophy using an RT2Profiler PCR Arrays system.
2. Materials and Methods
2.1. Animals. Spontaneously diabetic male GK rats (Taconic, Ry, Denmark) and age-matched nondiabetic male Wistar (W) control rats (Charles River, Sulzfeld, Germany) were purchased at 4–9 weeks of age and studied at the age of 16 weeks. The animals were housed at a constant room temper- ature (22 ± 2∘C) and 12 h light/dark cycles with free access to standard laboratory rat diet and water. The investigation conforms with the Guide for the Care and Use of Laboratory Animals published by the US National Institutes of Health (NIH) (publication no. 85-23, revised in 1996) and German
animal protection code. All procedures with and handling of the animals during the investigations were reviewed and approved by the appropriate institutional review board (G- 122/11).
2.2. Experimental Induction of Myocardial Infarction. The rats were anesthetized with a mixture of ketamine (100 mg/kg) and xylazine (3 mg/kg) intraperitoneally. An intratracheal tube was inserted, and the animals were artificially ventilated using a rodent ventilator (F¨ohr Medical Instruments GmbH, Seeheim, Ober-Beerbach, Germany). The core temperature (measured via a rectal probe) was maintained at 37∘C with a controlled heating pad. The chest was opened via a left thoracotomy, followed by a pericardiotomy. A 6-0 single silk suture was passed around the left anterior descending (LAD) coronary artery, and the ends of the tie were pulled through a small pledget to form a snare and then tightened. After 45 minutes of ischemia, reperfusion was achieved by releasing the snare. After surgery the thorax was closed, the skin was sutured, and the rats were allowed to recover on a heating pad.
Sham-operated animals were subjected to the same surgical procedures, except that the suture under the LAD coronary artery was not tied.
2.3. Experimental Groups. The rats were randomly divided into four groups: (1) W + sham: sham-operated nondiabetic Wistar control rats (𝑛 = 10); (2) GK + sham: sham-operated diabetic GK animals (𝑛 = 7); (3) W + MI: myocardial infarcted nondiabetic Wistar control rats (𝑛 = 9); (4) GK + MI: myocardial infarcted diabetic GK animals (𝑛 = 8).
2.4. In Vivo Hemodynamic Measurements and Cardiac Func- tion. Twenty-four hours after the reperfusion, the animals were tracheotomised, intubated, and artificially ventilated.
A polyethylene catheter was inserted into the left external jugular vein for fluid administration. A 2F microtip pressure- volume catheter was inserted into the right carotid artery and advanced into the ascending aorta. After being stabilized for 5 minutes, the arterial blood pressure was recorded and the catheter was advanced into the left-ventricle under pressure control. With the use of a special pressure-volume analysis program (PVAN, Millar Instruments, Houston, TX, USA), heart rate, systolic blood pressure, diastolic blood pressure, mean arterial pressure, ejection fraction, maximal slope of the systolic pressure increment (𝑑𝑃/𝑑𝑡max), and maximal slope of the diastolic pressure decrement (𝑑𝑃/𝑑𝑡min) were computed and calculated. The ventricular relaxation was assessed by the time constant of left-ventricular pressure decay (Tau). It was calculated by the Glantz method (Tau-g; regression of 𝑑𝑃/𝑑𝑡versus pressure). The left-ventricular pressure-volume relations are assessed by transiently compressing the inferior vena cava. The slope𝐸maxof the left-ventricular end-systolic pressure-volume relationship (ESPVR) was calculated as a load-independent index of LV contractility. At the end of each experiment, 0.1 mL of hypertonic saline (5%) was injected using the central venous line, and using the shift of pressure-volume relations, the parallel conductance volume
was calculated by the software and used for the correction of the cardiac mass volume.
2.5. Biochemical Estimation. After 24 hours reperfusion had been established, the heart function was measured, and blood was collected from the abdominal aorta in Lithium-Heparin- Gel Monovette, EDTA, and serum tubes. After centrifugation, the plasma and serum samples were obtained. Plasma glucose levels, triglycerides, cholesterol, serum insulin levels, and urinary glucose levels were determined by the usage of an automatic biochemistry analyzer.
2.6. Histopathological Process. After the blood samples were collected, pieces of the left-ventricular myocardial tissue were collected for histopathology, fixed in buffered paraformalde- hyde solution (4%), and embedded in paraffin. Then, 5𝜇m thick sections were placed on adhesive slides and stained with hematoxylin and eosin (H&E). Cardiomyocyte cross- sectional areas were calculated under a microscope using the Cell∧A software (Olympus Soft Imaging Solutions GmbH, Germany). Masson’s trichrome staining was performed to determine the extent of fibrosis. Four sections per heart were inspected under light microscopy and rated according to the following scoring system: grade 0 indicates normal tissue showing no fibrotic region, grade 1 indicates mild fibrosis, grade 2 indicates moderate fibrosis, and in grade 3 severe fibrosis is indicated. The histological evaluation was conducted by an investigator unaware of the treatment attribution of the animals.
2.7. Gene Expression Analysis Using RT2Profiler PCR Arrays.
After the blood samples were collected, pieces of the left- ventricular myocardial tissue were rapidly excised, frozen in liquid nitrogen, and stored at −80∘C. The total RNA was extracted from the hearts with miRNeasy Mini Kit (Qiagen, Hilden, Germany) and was reverse-transcribed into cDNA using the RT2 First Strand Kit, mixed with RT2 qPCR Master Mix containing SYBR Green according to manufacturer’s instructions (Qiagen, Hilden, Germany). The data was analyzed with the RT2 Profiler PCR Array Data Analysis Template available on the manufacturer’s website.
2.8. Determination of Area at Risk and Infarct Size. After 24 hours reperfusion had been established, the heart function was measured, and blood samples were collected. After the heart was excised, a second investigator, unware of the randomization, determined the infarct size. The hearts were excised, quickly hung on a Langendorff apparatus, and perfused with 0.9% NaCl solution in order to wash the blood out from the coronary vessels. Then, the coronary artery was religated with the help of the 6-0 single silk suture previously located under the LAD coronary artery. Some additional rats in each experimental group (𝑛 = 3/group) were injected with 1.5 mL of Evans blue dye (1% w/v) via the aorta and coronary arteries to demarcate the ischemic risk (nonstained) or nonrisk (stained) area of the heart.
The rest solely underwent 2,3,5-triphenyltetrazolium chloride (TTC) staining. The transverse heart tissue sections were
incubated with 1% TTC for 30 minutes at 37∘C. The viable myocardium was stained with brick red due to the formation of a precipitate that resulted from a reaction of TTC with dehydrogenase enzymes. The loss of these enzymes from the infarcted myocardium prevents the formation of the precipitate, and the infarcted area within the region at risk remains pale yellow. The tissue samples were then fixated in 4% formalin solution for at least 24 hours. The mean value of risk area has been calculated and used to determine the infarct size of the area at risk of infarction. Individual slices were photographed in colour using the Cell∧A software (Olympus Soft Imaging Solutions GmbH, Germany), and the extent of myocardial necrosis and the area at risk were quantified.
2.9. Chemical Reagents. Sodium pentobarbital was pur- chased from Merial GmbH (Hallbergmoos, Germany), and Evans blue and TTC were bought from Sigma-Aldrich (Stein- heim, Germany).
2.10. Statistical Analysis. All data is expressed as mean ± standard error of the mean (SEM). In case of the PCR array gene expression, the𝑃values were calculated based on Student’s𝑡-test of the replicate 2−ΔCtvalues for each gene in the experimental groups. Genes corresponding to a𝑃value less than 0.05 are indicated in Table 4. In all other cases, intergroup comparisons were performed by using a one-way analysis of the variance, followed by Student’s unpaired 𝑡- test with Bonferroni’s correction for multiple comparisons. A value of𝑃 < 0.05was considered statistically significant.
3. Results
3.1. Biochemical Parameters. The biochemical values are listed inTable 1. The plasma glucose levels were significantly higher in diabetic rats compared to nondiabetic animals (GK + sham: 12.8 ± 1.5mM versus W + sham: 8.5 ± 0.4mM, 𝑃 < 0.05), indicating the manifestation of an overt diabetes.
Additionally, diabetic rats with myocardial infarction had significantly higher glucose levels when compared with the GK + sham animals (GK + MI:19.0 ± 2.3mM versus GK + sham:12.8 ± 1.5mM,𝑃 < 0.05). High levels of urinary glucose have been observed in diabetic rats compared to the nondiabetic animals (Table 1). We found no difference in the plasma cholesterol, triglyceride, and serum insulin concentrations amongst the experimental groups.
3.2. Myocardial Infarct Size. In rats, subjected to coronary artery occlusion and reperfusion, there was no difference in the area at risk between the nondiabetic Wistar and diabetic GK rats, indicating that a comparable degree of ischemic area was induced (Wistar47 ± 8% versus GK42 ± 2%,𝑃 = 0.42).
However, the myocardial infarct size (infarct zone/area at risk) was smaller in diabetic hearts than in nondiabetic hearts (GK + MI:27 ± 6% versus W + MI:53 ± 9%,𝑃 < 0.05).
3.3. Myocardial Hypertrophy and Fibrotic Remodelling. Com- pared to the corresponding age-matched control rats, the
Table 1: Biochemical parameters in Goto-Kakizaki (GK) and control rats 24 h after sham operation or myocardial infarction.
W + sham GK + sham W + MI GK + MI
Plasma glucose [mmol/L] 8.5±0.4 12.8±1.5∗ 8.4±0.6 19.2±2.3∗#$
Plasma triglycerides [mg/dL] 67±9 60±9 67±7 88±8
Plasma cholesterol [mg/dL] 70±8 93±6 71±7 91±7
Serum insulin [mU/L] 6.3±0.8 5.3±0.2 5.4±0.5 5.1±0.6
Urine glucose [g/L] 0.13±0.02 0.73±0.28∗$ 0.14±0.03 0.76±0.15∗$
Data is expressed as mean±SEM;∗𝑃 < 0.05versus W + sham;#𝑃 < 0.05versus GK + sham;$𝑃 < 0.05versus W + MI; MI indicates myocardial infarction;
GK: Goto-Kakizaki; W: Wistar.
Table 2: Physiological characteristics of Goto-Kakizaki (GK) and control rats 24 h after sham operation or myocardial infarction.
W + sham GK + sham W + MI GK + MI
Body weight [g] 450±6 331±8∗$ 444±11 322±6∗$
Heart weight to body weight ratio [×1,000] 2.96±0.08 3.73±0.10∗ 3.54±0.10∗ 4.05±0.09∗$
Heart rate [beats/min] 453±13 454±28 456±6 453±4
SBP [mmHg] 145±6 123±6 137±8 120±7∗
DBP [mmHg] 117±5 89±6∗ 113±8 92±8∗
MAP [mmHg] 126±5 100±6∗ 121±8 102±7∗
Data is expressed as mean±SEM;∗𝑃 < 0.05versus W + sham;$𝑃 < 0.05versus W + MI; MI indicates myocardial infarction; GK: Goto-Kakizaki; W: Wistar;
SBP: systolic blood pressure; DBP: diastolic blood pressure; MAP: mean arterial pressure.
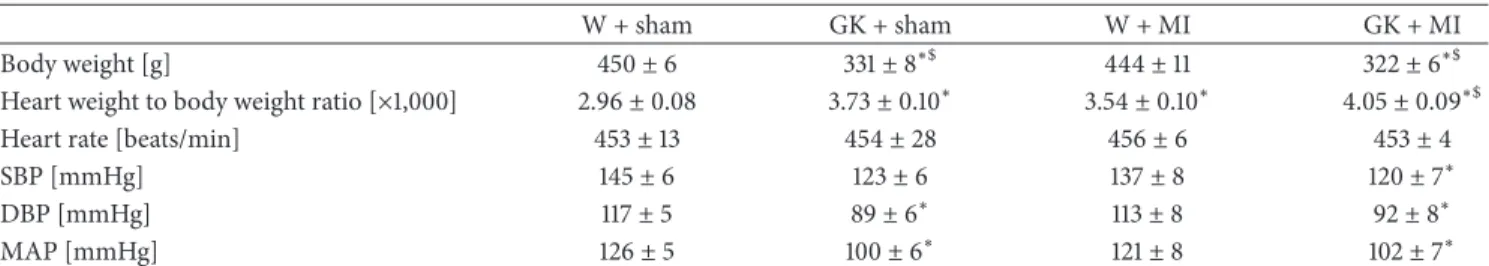
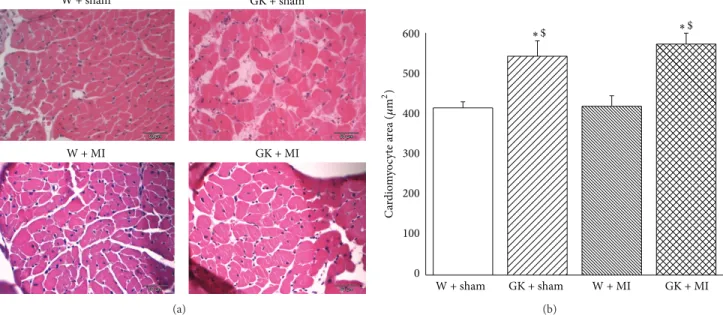
body weight was significantly lower, and the heart-to-body weight ratio was higher in diabetic animals (Table 2). Fur- thermore, the histological examination revealed that the cardiomyocyte transverse cross-sectional area in the GK + sham and GK + MI rats was significantly increased in the H&E-stained sections compared to the nondiabetic animals (Figure 1). Additionally, Masson’s trichrome stained sections showed myocardial fibrosis in GK + sham and GK + MI rats compared to the nondiabetic animals (Figure 2).
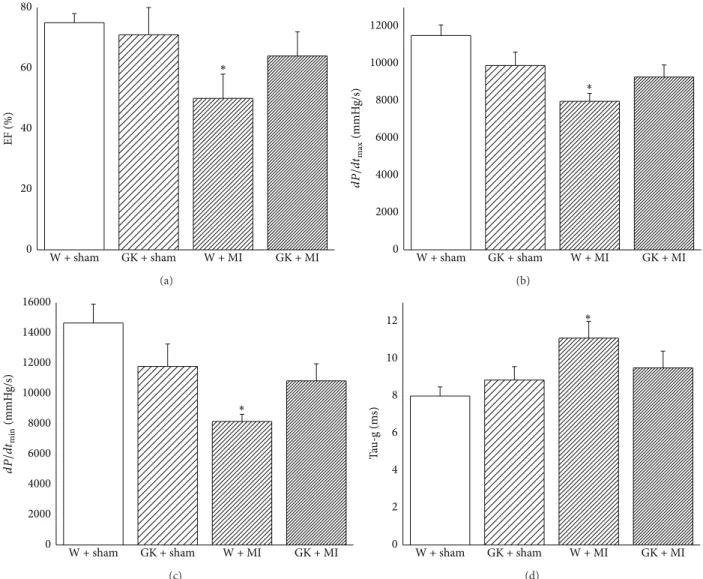
3.4. Cardiac Pump Function. The heart rate did not differ between the experimental groups (Table 2). The systolic blood pressure in GK + MI animals and the diastolic blood pressure and mean arterial pressure in GK + sham and GK + MI rats were significantly lower compared to the W + sham animals (Table 2). The cardiac index derived from a pressure-volume analysis is shown in Figure 3. Although the induction of acute myocardial infarction in nondiabetic rats significantly decreased systolic performance (ejection fraction, 𝑑𝑃/𝑑𝑡max) and ventricular relaxation (𝑑𝑃/𝑑𝑡min, Tau-g), it had no effect on diabetic rats when compared to the corresponding control groups (Figure 3).
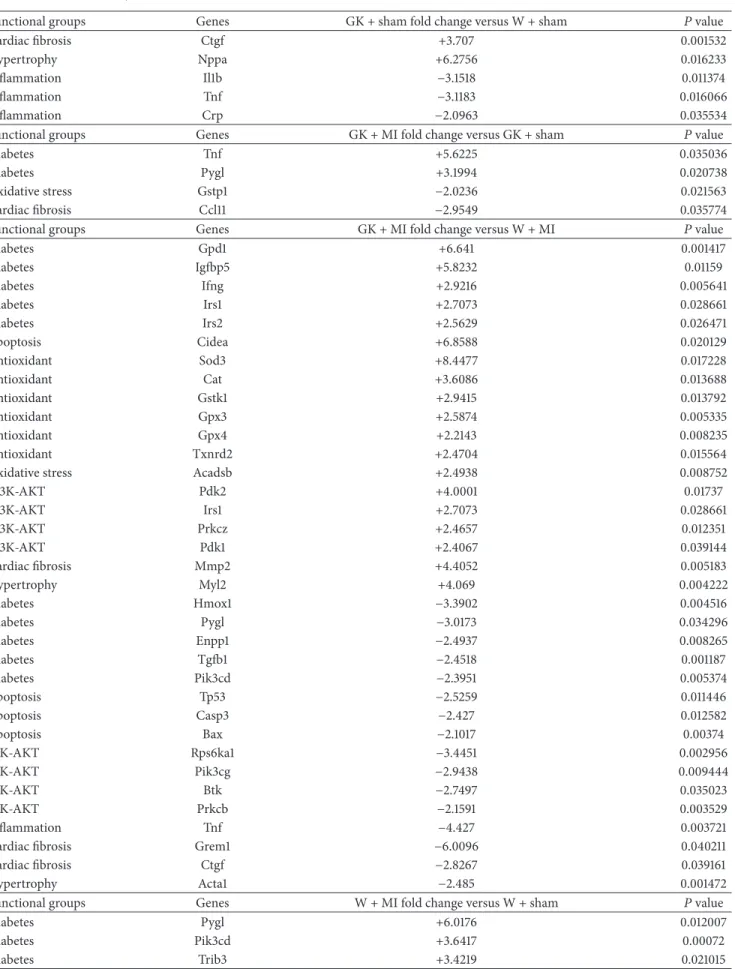
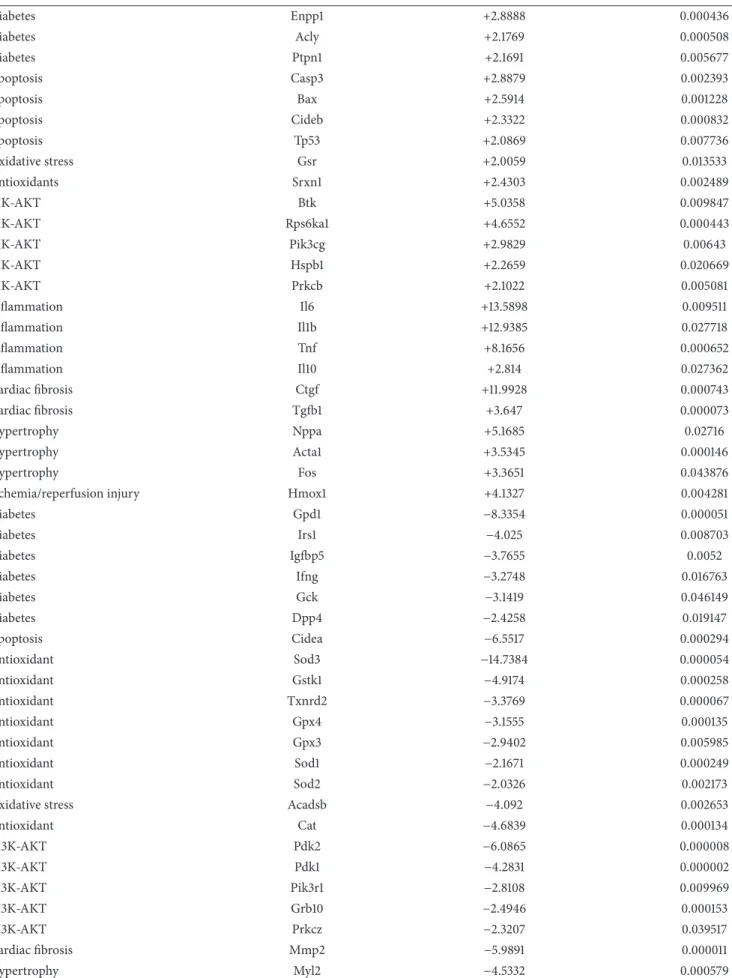
3.5. Myocardial Gene Expression Analysis Using RT2 Profiler PCR Arrays. The significantly upregulated and downregu- lated 125 genes surveyed are shown in Tables 3and 4 and in Figure 4. DM only significantly altered the expression of 5 genes (2 upregulated and 3 downregulated) in the hearts of GK + sham animals compared to W + sham rats.
Only 4 genes (2 upregulated and 2 downregulated) showed significant expression changes in the hearts of GK + MI animals compared to GK + sham rats. However, 35 genes
(19 upregulated and 16 downregulated) showed significant changes in expression in the hearts of GK + MI animals compared to W + MI rats. Genes whose expression was found to be highly up- and downregulated (fold change>
+/−3) were mostly related to the onset, development, and progression of diabetes [glycerol-3-phosphate dehydrogenase (Gpd)-1, insulin-like growth factor binding protein (Igfbp)- 5, phosphorylase glycogen liver (Pygl), heme oxygenase (Hmox)-1], apoptosis [cell death-inducing DFFA-like effec- tor (Cidea)], antioxidants [superoxidase dismutase (Sod)-3, catalase], PI3K/Akt signaling pathway [pyruvate dehydroge- nase kinase, isozyme (Pdk)-2, ribosomal protein S6 kinase polypeptide (Rps6ka)-l], cardiac fibrosis [matrix metallopep- tidase (Mmp)-2, Gremlin-1], inflammation [tumor necrosis factor (Tnf)], and hypertrophy [myosin, light polypeptide (Myl)-2]. Acute myocardial infarction in nondiabetic rats (W + MI) altered 50 genes (19 upregulated and 16 downregulated) in comparison to the W + sham rats. These genes (fold change>+/−3) were mostly related to the PI3K/Akt signaling pathway [Rps6ka-l, bruton agammaglobulinemia tyrosine kinase (btk), Pdk-1, Pdk-2], inflammation [interleukin (Il)1b, Il6, Tnf], cardiac fibrosis [transforming growth factor (Tgf)- beta, Mmp2], hypertrophy [natriuretic peptide precursor A (Nppa), alpha actin (Acta)-1, FBJ osteosarcoma onco- gene (Fos), Myl-2], ischemia/reperfusion injury [Hmox1], apoptosis [Cidea], and antioxidants [glutathione peroxydase (Gpx)-4, glutathione S-transferase kappa (Gstk)-1, thiore- doxin reductase (Txnrd)2, sod3, catalase]. Additionally, the mRNA expressions of 4 genes corresponding to sod3, Il6, Il1b, and ctgf were highly regulated in W + MI compared to W + sham hearts, showing more than 11-fold change (fold changes for sod3:−14.7, Il6: +13.6, Il1b: +12.9, and ctgf: +12.0).
W + sham
W + MI
GK + sham
GK + MI
(a)
0 100 200 300 400 500
600 ∗$
GK + MI W + MI
GK + sham W + sham
∗$
Cardiomyocyte area (𝜇m2)
(b)
Figure 1: Histological analysis (hematoxylin and eosin staining). (a) Hematoxylin and eosin staining micrographs of transverse sections of myocardium (magnification×400, scale bar: 50𝜇m) and (b) quantitative analysis of cardiomyocyte cross-sectional area using measurements of∼20 cardiomyocytes in each group. Data is presented as mean±SEM.∗𝑃 < 0.05versus W; GK;$𝑃 < 0.05versus W + MI. MI indicates myocardial infarction; GK: Goto-Kakizaki; W: Wistar.
∗ ∗
W + sham
W + MI
GK + sham
GK + MI
0.0 0.2 0.4 0.6
0.8 $
Fibrosis (score)
GK + MI W + MI
GK + sham W + sham
$
Figure 2: Histological analysis (Masson’s trichrome staining). Histological examination of the myocardium stained with Masson’s trichrome (magnification×100, scale bar: 100𝜇m). Data is presented as mean±SEM.∗𝑃 < 0.05versus W;#𝑃 < 0.05versus GK;$𝑃 < 0.05versus W + MI. MI indicates myocardial infarction; GK: Goto-Kakizaki; W: Wistar. Masson’s trichrome staining (grade 0 indicates normal tissue showing no fibrotic region; grade 1 indicates mild fibrosis; grade 2 indicates moderate fibrosis, and grade 3 indicates severe fibrosis).
4. Discussion
The aim of this study was to investigate additional molecular pathomechanisms of acute myocardial infarction in mildly diabetic GK rats. In line with the previous literature [8,12,13], our results showed that DM decreases myocardial suscepti- bility to ischemia/reperfusion injury. We demonstrated that this short-term and mild diabetes-induced cardioprotection may be, at least in part, due to an increased transcriptional
expression of markers of antioxidant defense and the prosur- vival PI3K/Akt pathway and due to the downregulation of apoptotic genes, proinflammatory cytokine tumor necrosis factor-𝛼, profibrogenic transforming growth factor-𝛽, and hypertrophic marker alpha actin-1. This present work addi- tionally expands previous studies by identifying additional target genes associated with the cardioprotective effect of middle diabetes against ischemia/reperfusion injury.
0 20 40 60 80
EF (%)
∗
GK + MI W + MI
GK + sham W + sham
(a)
0 2000 4000 6000 8000 10000 12000
∗
GK + MI W + MI
GK + sham W + sham
dP/dtmax(mmHg/s)
(b)
0 2000 4000 6000 8000 10000 12000 14000 16000
∗
GK + MI W + MI
GK + sham W + sham
dP/dtmin(mmHg/s)
(c)
0 2 4 6 8 10
12 ∗
GK + MI W + MI
GK + sham W + sham
Tau-g (ms)
(d)
Figure 3: Left-ventricular systolic and diastolic function. Assessment of (a) ejection fraction, (b) maximal slope of the systolic pressure increment𝑑𝑃/𝑑𝑡max, (c) maximal slope of the diastolic pressure decrement𝑑𝑃/𝑑𝑡min, and (d) time constant of left-ventricular pressure decay Tau-g. Data is expressed as mean±SEM.∗𝑃 < 0.05versus W + sham. MI indicates myocardial infarction; GK: Goto-Kakizaki; W: Wistar.
Diabetic cardiomyopathy, an early complication of dia- betes, is a result of complex interactions between metabolic abnormalities (hyperinsulinemia, hyperlipidemia, and hyp- erglycemia) that accompany diabetes and their cellular consequences (oxidative stress, endothelial dysfunction, inflammation, and renin angiotensin aldosterone system activation), resulting in functional (systolic and diastolic dysfunction) and structural (left-ventricular hypertrophy and cardiac fibrosis) changes in the myocardium. In the present study, higher plasma and urine glucose levels, cardiomyocyte hypertrophy, and myocardial fibrosis were documented and the cardiac function was indistinguishable in GK rats when compared with nondiabetic animals.
Despite these impairments, DM significantly altered only 5 of the tested genes involved in cardiac fibrosis (ctgf), hypertrophy (Nppa), and inflammation (Tnf, Il1b, Crp).
Although clinical trials showed that DM increased the sensitivity of the myocardium to ischemia/reperfusion injury
[6, 7], infarct size studies in diabetic animal models have produced variable results. Some studies have shown that the diabetic heart is more sensitive to ischemic injury [14–16];
others found no difference [17,18]. It has been also demon- strated that the myocardium of animals with DM compared to nondiabetic animals paradoxically is more resistant to ischemia, resulting in smaller myocardial infarctions [8,12].
The reasons for the disparity between the animal and clinical data were the subject of a review in 1997, by Paulson, who concluded that the sensitivity of the diabetic heart to acute myocardial ischemia/reperfusion injury was dependent on the animal models and conditions used [9]. Additionally, in 2012, Whittington et al. added another complicating factor, the choice of the ischemia/reperfusion injury model, and the lack of other comorbidities such as age, dyslipidemia, and hypertension [19]. The duration and severity of the diabetic state, ischemic insults, and metabolic profiles after
Table 3: Genes Table.
Official full name Gene
symbol Official full name Gene
symbol Acyl-coenzyme A dehydrogenase, short/branched
chain Acadsb Interleukin 10 Il10
ATP citrate lyase Acly Interleukin 1 beta Il1b
Actin, alpha 1, skeletal muscle Acta1 Interleukin 6 Il6
Bcl2-associated X protein Bax Insulin receptor substrate 1 Irs1
Bruton agammaglobulinemia tyrosine kinase Btk Insulin receptor substrate 2 Irs2
Caspase 3 Casp3 Matrix metallopeptidase 2 Mmp2
Catalase Cat Myosin, light polypeptide 2, regulatory, cardiac, slow Myl2
Chemokine (C-C motif) ligand 11 Ccl11 Natriuretic peptide precursor A Nppa
Cell death-inducing DFFA-like effector a Cidea Pyruvate dehydrogenase kinase, isozyme 1 Pdk1 Cell death-inducing DFFA-like effector b Cideb Pyruvate dehydrogenase kinase, isozyme 2 Pdk2 C-reactive protein, pentraxin-related Crp Phosphoinositide-3-kinase, catalytic, delta polypeptide Pik3cd Connective tissue growth factor Ctgf Phosphoinositide-3-kinase, catalytic, gamma polypeptide Pik3cg Dipeptidylpeptidase 4 Dpp4 Phosphoinositide-3-kinase, regulatory subunit 1 (alpha) Pik3r1 Ectonucleotide
pyrophosphatase/phosphodiesterase 1 Enpp1 Protein kinase C, beta Prkcb
FBJ osteosarcoma oncogene Fos Protein kinase C, zeta Prkcz
Glucokinase Gck Protein tyrosine phosphatase, nonreceptor type 1 Ptpn1
Glycerol-3-phosphate dehydrogenase 1 (soluble) Gpd1 Phosphorylase, glycogen, liver Pygl
Glutathione peroxidase 3 Gpx3 Ribosomal protein S6 kinase polypeptide 1 Rps6ka1
Glutathione peroxidase 4 Gpx4 Superoxide dismutase 1, soluble Sod1
Growth factor receptor bound protein 10 Grb10 Superoxide dismutase 2, mitochondrial Sod2 Gremlin 1, cysteine knot superfamily,
homolog (xenopus laevis) Grem1 Superoxide dismutase 3, extracellular Sod3
Glutathione reductase Gsr Sulfiredoxin 1 homolog (S. cerevisiae) Srxn1
Glutathione S-transferase kappa 1 Gstk1 Transforming growth factor, beta 1 Tgfb1
Glutathione S-transferase pi 1 Gstp1 Tumor necrosis factor (TNF superfamily, member 2) Tnf
Heme oxygenase (decycling) 1 Hmox1 Tumor protein p53 Tp53
Heat shock protein 1 Hspb1 Tribbles homolog 3 (Drosophila) Trib3
Interferon gamma Ifng Thioredoxin reductase 2 Txnrd2
Insulin-like growth factor binding protein 5 Igfbp5
the diabetic induction play a role in explaining the vulnera- bility of diabetic hearts to myocardial ischemia/reperfusion injury. One of the reasons for the increased myocardial ischemic tolerance in diabetic animals may be associated with hypotension and bradycardia [20]. At the same time, different authors supported the endogenous cardioprotective phenotype (metabolic preconditioning) of the myocardium in the absence of differences in the hemodynamic mea- surements between control and diabetic animals [12]. In the present work, to evaluate the cardiac function, different indices were calculated. Our results showed that even though acute myocardial infarction decreased𝑑𝑃/𝑑𝑡max (an index of contractility) and ejection fraction (widely used clinical parameter of systolic performance) in nondiabetic rats, it had no effects on diabetic animals. Additionally, the left- ventricular diastolic function, evaluated by𝑑𝑃/𝑑𝑡minand Tau, has shown to be impaired by acute myocardial infarction in nondiabetic rats, while it was not significantly impaired
in diabetic animals. However, we documented a modest hypotension in diabetic rats. Altogether, our results demon- strated that in the absence of differences in the cardiac systolic and diastolic functions, the infarct size was smaller in diabetic animals than in nondiabetic rats. However, the induction of a myocardial infarction in diabetic animals increased the glucose levels further when compared to the sham-operated diabetic animals. Furthermore, in the ischemic/reperfused diabetic myocardium only 2 of the tested genes were upreg- ulated and 2 downregulated, when compared to diabetic hearts. This data suggests that an acute myocardial infarction in mild diabetic animals did not induce additional cardiac damage when compared to the noninfarcted diabetic rats.
Although the persistence of a hyperglycaemic environ- ment prior to the ischemia/reperfusion injury may induce a myocardial adaptation [13], the exact mechanisms need to be elucidated. The following mechanisms have been proposed to explain the lower sensitivity of the acutely diabetic hearts
Table 4: Significant upregulated and downregulated genes in Goto-Kakizaki (GK) and control rats 24 h after sham operation or myocardial infarction. MI indicates myocardial infarction; W: Wistar.
Functional groups Genes GK + sham fold change versus W + sham 𝑃value
Cardiac fibrosis Ctgf +3.707 0.001532
Hypertrophy Nppa +6.2756 0.016233
Inflammation Il1b −3.1518 0.011374
Inflammation Tnf −3.1183 0.016066
Inflammation Crp −2.0963 0.035534
Functional groups Genes GK + MI fold change versus GK + sham 𝑃value
Diabetes Tnf +5.6225 0.035036
Diabetes Pygl +3.1994 0.020738
Oxidative stress Gstp1 −2.0236 0.021563
Cardiac fibrosis Ccl11 −2.9549 0.035774
Functional groups Genes GK + MI fold change versus W + MI 𝑃value
Diabetes Gpd1 +6.641 0.001417
Diabetes Igfbp5 +5.8232 0.01159
Diabetes Ifng +2.9216 0.005641
Diabetes Irs1 +2.7073 0.028661
Diabetes Irs2 +2.5629 0.026471
Apoptosis Cidea +6.8588 0.020129
Antioxidant Sod3 +8.4477 0.017228
Antioxidant Cat +3.6086 0.013688
Antioxidant Gstk1 +2.9415 0.013792
Antioxidant Gpx3 +2.5874 0.005335
Antioxidant Gpx4 +2.2143 0.008235
Antioxidant Txnrd2 +2.4704 0.015564
Oxidative stress Acadsb +2.4938 0.008752
PI3K-AKT Pdk2 +4.0001 0.01737
PI3K-AKT Irs1 +2.7073 0.028661
PI3K-AKT Prkcz +2.4657 0.012351
PI3K-AKT Pdk1 +2.4067 0.039144
Cardiac fibrosis Mmp2 +4.4052 0.005183
Hypertrophy Myl2 +4.069 0.004222
Diabetes Hmox1 −3.3902 0.004516
Diabetes Pygl −3.0173 0.034296
Diabetes Enpp1 −2.4937 0.008265
Diabetes Tgfb1 −2.4518 0.001187
Diabetes Pik3cd −2.3951 0.005374
Apoptosis Tp53 −2.5259 0.011446
Apoptosis Casp3 −2.427 0.012582
Apoptosis Bax −2.1017 0.00374
PIK-AKT Rps6ka1 −3.4451 0.002956
PIK-AKT Pik3cg −2.9438 0.009444
PIK-AKT Btk −2.7497 0.035023
PIK-AKT Prkcb −2.1591 0.003529
Inflammation Tnf −4.427 0.003721
Cardiac fibrosis Grem1 −6.0096 0.040211
Cardiac fibrosis Ctgf −2.8267 0.039161
Hypertrophy Acta1 −2.485 0.001472
Functional groups Genes W + MI fold change versus W + sham 𝑃value
Diabetes Pygl +6.0176 0.012007
Diabetes Pik3cd +3.6417 0.00072
Diabetes Trib3 +3.4219 0.021015
Table 4: Continued.
Diabetes Enpp1 +2.8888 0.000436
Diabetes Acly +2.1769 0.000508
Diabetes Ptpn1 +2.1691 0.005677
Apoptosis Casp3 +2.8879 0.002393
Apoptosis Bax +2.5914 0.001228
Apoptosis Cideb +2.3322 0.000832
Apoptosis Tp53 +2.0869 0.007736
Oxidative stress Gsr +2.0059 0.013533
Antioxidants Srxn1 +2.4303 0.002489
PIK-AKT Btk +5.0358 0.009847
PIK-AKT Rps6ka1 +4.6552 0.000443
PIK-AKT Pik3cg +2.9829 0.00643
PIK-AKT Hspb1 +2.2659 0.020669
PIK-AKT Prkcb +2.1022 0.005081
Inflammation Il6 +13.5898 0.009511
Inflammation Il1b +12.9385 0.027718
Inflammation Tnf +8.1656 0.000652
Inflammation Il10 +2.814 0.027362
Cardiac fibrosis Ctgf +11.9928 0.000743
Cardiac fibrosis Tgfb1 +3.647 0.000073
Hypertrophy Nppa +5.1685 0.02716
Hypertrophy Acta1 +3.5345 0.000146
Hypertrophy Fos +3.3651 0.043876
Ischemia/reperfusion injury Hmox1 +4.1327 0.004281
Diabetes Gpd1 −8.3354 0.000051
Diabetes Irs1 −4.025 0.008703
Diabetes Igfbp5 −3.7655 0.0052
Diabetes Ifng −3.2748 0.016763
Diabetes Gck −3.1419 0.046149
Diabetes Dpp4 −2.4258 0.019147
Apoptosis Cidea −6.5517 0.000294
Antioxidant Sod3 −14.7384 0.000054
Antioxidant Gstk1 −4.9174 0.000258
Antioxidant Txnrd2 −3.3769 0.000067
Antioxidant Gpx4 −3.1555 0.000135
Antioxidant Gpx3 −2.9402 0.005985
Antioxidant Sod1 −2.1671 0.000249
Antioxidant Sod2 −2.0326 0.002173
Oxidative stress Acadsb −4.092 0.002653
Antioxidant Cat −4.6839 0.000134
PI3K-AKT Pdk2 −6.0865 0.000008
PI3K-AKT Pdk1 −4.2831 0.000002
PI3K-AKT Pik3r1 −2.8108 0.009969
PI3K-AKT Grb10 −2.4946 0.000153
PI3K-AKT Prkcz −2.3207 0.039517
Cardiac fibrosis Mmp2 −5.9891 0.000011
Hypertrophy Myl2 −4.5332 0.000579
Tgfb1
Dapk1Agt Fos Alb Ccl5 Gstk1 Casp3 Ikbkb Shc1 Mapk14 Bax Gsr Map2k1 Ptpn1 Rps6kb1 Grem1Gpx1 Gsk3b Sod2 Acadsb Retn Xdh Ace Ccl11 Eif4g1 Akt1 Gpx2 Gpd1 Nppa Ctgf Hras Irs2 Cflar Mmp1a Txnrd1 Abl1 Trib3 Rheb Pdpk1 Tp53 Cideb Dusp4 Cidea Mmp2 Mtor Igfbp5 Srxn1 Bcl2l1 Hspb1 Igf1r Acly Nos3 Il10 Eif4ebp1 Casp8ap2 Il6 Mapk8 Hmox1 Sels Gstp1 Pik3r2 Cat Il1b Casp6 Ide Tnf Pygl Bad Crp Pdk1 Inppl1 Pik3cg Pik3cd Prkcb Gpx7 Akt3 Fkbp1a Ilk Bcl2 Mtcp1 Tsc2 Prkcg Vegfa Pten Acta1 Btk Pik3ca Irs1 Dpp4 Ywhah Gck Sfrp4 PrkczGpx3 Prkca Gpx4 Enpp1 Grb10 Sod3 Pik3r1 Tsc1 Sos1 Mapk1 Ifng Parp1 Tcl1a Gpx6 Gpx5 Tp73Ins1 Il12b Gcg Fbp1 G6pc Eif4b Mapk3 Rps6ka1 Pdk2 Sod1 Txnrd2 Grb2 Eif4e Myl2 Akt2
Magnitude of gene expression
Min Avg. Max
68
7182 65
76878380
(a)
Figure 4: Continued.
Magnitude of gene expression
Min Avg. Max
Casp6
Sfrp4 Hmox1 Nppa Cideb Igf1r Trib3 Nos3 Acly Eif4ebp1 Casp8ap2Txnrd1 Sels Abl1 Tp53 Dusp4 Srxn1 Mapk14 Gpx2 Ccl11 Alb Ikbkb Bcl2l1 Mapk8 Dapk1 Xdh Gpx1 Gck Pik3r1Sos1 Cat Acadsb Gcg Akt3 Bcl2 Gpx7 Grb10 Mapk3 Prkcz Gpx3 Vegfa Grb2 Ifng Pik3r2 Prkcg Prkcb PrkcaTsc2 G6pc Ccl5 Akt2 Parp1 Irs1 Igfbp5 Gpd1 Mapk1 Sod3 Sod1 Myl2 Pdk1 Txnrd2 Gstk1 Pdk2 Sod2 Cidea Mmp1a Gstp1 Agt Rheb Cflar Mmp2 Ide Tcl1a Gpx6 Gpx5 Tp73 Il12b Fbp1 Pten Retn Gpx4 Tsc1 Mtcp1Ins1 Eif4e Eif4b Mtor Hras Enpp1 Tnf Pygl Btk Acta1 Rps6ka1 Ilk Fkbp1a Tgfb1 Pik3cd Map2k1 Eif4g1 Gsr Ace Grem1 Shc1 Akt1 Casp3 Bax Ctgf Hspb1 Il6 Crp Pik3cg Irs2 Il1b Dpp4 Fos Il10 Pdpk1 Rps6kb1Gsk3b Pik3ca Bad Inppl1 Ptpn1 Ywhah
87
15 82 11 19 35 80 83
(b)
Figure 4: Continued.
Magnitude of gene expression
Min Avg. Max
25
35 11 19 37 15 9 29
Parp1
Sfrp4 Gsk3b Bcl2l1 Mapk8 Ccl5 Xdh Dapk1 Casp8ap2 Enpp1 Sels Pygl Hmox1 Pik3cgShc1 Rps6ka1 Tgfb1 Pten Grb2 Casp6 Prkcb Acta1 Tnf Cideb Grem1 Srxn1 Gsr Bax Pik3cd Casp3 Btk Tp53 Trib3 Gstp1 Cflar Ikbkb Il1b Ptpn1 Alb Agt Retn Akt3 Mmp1a Tcl1a Gpx6 Gpx5 Tp73 Fbp1 Ins1 Ide Mtcp1 Mapk1 Gcg Crp Bad Gpx7 Gpx2 Akt1 Il12b Nos3 Acly Il6 Txnrd1 Map2k1 Ctgf Ilk Fkbp1a Abl1 Eif4ebp1Eif4e Hras Hspb1 Igf1r Nppa Ccl11 Fos Il10 Rps6kb1 Ace Prkcg Mapk14 Pik3ca Pdpk1 Dusp4 Eif4g1 Eif4b Tsc1 MtorIrs2 Dpp4 Rheb Myl2 Gstk1 Txnrd2 Acadsb Sod3 Ifng Sod1 Cidea Pdk2 Cat Pdk1 Vegfa Prkcz Pik3r2 Pik3r1Sos1 Gck Gpx1 Irs1 Akt2 Gpx3 Gpd1 Gpx4 Grb10 Inppl1 Prkca Mmp2 Igfbp5 Ywhah Tsc2 Sod2 Bcl2 G6pc Mapk3
(c)
Figure 4: Continued.
Agt
Prkcg Pdpk1 Pik3ca Sfrp4Ctgf Hspb1 Ilk Igf1r Cideb Tnf Acta1 PrkcbSels Nppa Akt1 Hras Eif4e Grb2 Fkbp1a Casp8ap2 Enpp1Casp6 Pten Eif4ebp1 Il12bBad Fos Cflar Mapk8 Il6 Pik3cg Nos3 Il1b PyglIl10 Bax Pik3cd Casp3Btk Tp53 Gsr Trib3 Map2k1 Srxn1 Rps6ka1 Acly Shc1 Tgfb1 Ptpn1 Hmox1 Bcl2l1 Grem1 Gsk3b Retn Mapk14Inppl1 Txnrd1 Abl1 Rps6kb1 Ccl11Ifng Mapk1 Parp1 Ide Pik3r1 Irs1 Gpx3 Igfbp5Prkcz Grb10 Sos1 Tsc1 Tsc2 Myl2 Mtcp1 Dpp4 VegfaGpx1 Gck Ywhah Sod1 Gpx4 Cat Sod3 Gstk1 Cidea Mmp2 Pdk2 Pdk1 Txnrd2Gpd1 Akt2 Acadsb Pik3r2Sod2 Crp Dapk1 Ccl5 Gstp1 Eif4b Irs2 Eif4g1Rheb Mtor Dusp4 Mmp1a Tcl1a Gpx6 Gpx5 Tp73 Ins1 Fbp1 G6pc Gcg Mapk3Gpx2 Gpx7 Bcl2 Akt3 Prkca Ikbkb Xdh Ace Alb
76 2529937686571
Magnitude of gene expression
Min Avg. Max
(d)
Figure 4: PCR array gene expression clustergrams: (a) GK + sham versus W + sham, (b) GK + MI versus GK + sham, (c) GK + MI versus W + MI, and (d) W + MI versus W + sham. MI indicates myocardial infarction; GK: Goto-Kakizaki; W: Wistar.
to ischemia/reperfusion injury: the degree of intracellular acidity and how the cells handle this acidosis [21]. It has also been shown that preischemic myocardial glycogen content is increased in diabetic hearts [22, 23], and high glycogen reserves protect from ischemic damage resulting in smaller infarcts in the diabetic rat hearts [22]. Short- term diabetes may also increase the myocardial content of free-radical scavenging enzymes, catalase, and glutathione reductase which may also be involved [24,25]. In the present study, we evaluated the effects of mild hyperglycemia after acute myocardial infarction on the ventricular transcriptional profile, using quantitative gene approaches. In line with these observations, our RT2 Profiler PCR Array results confirmed that reductions in the myocardial infarct area may be, at least in part, due to the upregulation of antioxidant enzymes including glutathione peroxidase-3 and peroxidase- 4, glutathione S-transferase kappa-1, thioredoxin reductase-2, superoxide dismutase-3, and catalase.
Insulin sequentially activates the insulin receptor, PI3K, and Akt [26] through phosphorylation at threonine 308 and serine 473 [27]. Insulin receptor substrates- (Irs-) 1 and Irs-2 have been shown to play major roles in the control of cardiac homeostasis, metabolism, and function. Suppressing cardiac IRS-1 and IRS-2 may serve as a fundamental mechanism for induction of heart failure [28]. A growing body of evidence indicates that the PI3K/Akt pathway is generally considered to be beneficial for heart function [29]. The abnormal regulation of the PI3K/Akt pathway may be one of several factors contributing to diabetes-induced cardiac dysfunction, and its activation may prevent cardiac myocyte apoptosis and protect the myocardium from ischemia/reperfusion injury in vivo [30]. In the present work, we studied the prosur- vival PI3K/Akt signal transduction pathway. An increased mRNA expression of Irs-1, Prkcz (a downstream of IRS- 1 and PI3K), pyruvate dehydrogenase kinase (Pdk)-1, and Pdk-2 was observed in diabetic rats after myocardial infarc- tion. Elevated inflammatory mediators have been shown to reduce the phosphorylation of tyrosine in IRS-1 and to reduce the activation of the PI3K/Akt pathway [31]. In line with these observations, genes encoding proteins, including markers of proinflammatory cytokine tumor necrosis factor- 𝛼, were downregulated in the ischemic/reperfused diabetic myocardium.
A programmed cell death mechanism or apoptosis plays a major role in the pathogenesis of diabetic cardiomyopathy.
We showed that genes encoding proteins, including markers of apoptosis (cidea, Tp53, Bax, and caspase 3), were down- regulated in diabetic hearts after acute myocardial infarction.
Cardiac cell death can induce a compensatory hypertrophy of myocardial cells and reparative fibrosis [32]. Our results also showed that markers of myocardial fibrosis (Mmp-2, ctgf, and Grem-1), cardiac hypertrophy (myl-2 and acta1), and profibrogenic transforming growth factor-𝛽were regulated in diabetic hearts after myocardial infarction. These findings provide new insight into the identification of potential genes that may be involved in mild hyperglycaemia environment induced protection against myocardial ischemia/reperfusion injury.
In the present study, our results showed that nondi- abetic hearts are more sensitive to ischemia/reperfusion injury than the diabetic myocardium. Acute myocardial infarction impaired systolic performance (as evidenced by decreased 𝑑𝑃/𝑑𝑡max and ejection fraction) and ventricular relaxation (as shown by decreased𝑑𝑃/𝑑𝑡min and prolonged Tau). The restoration of blood flow to the nondiabetic ischemic myocardium can cause injury. Ischemic damage and hypoxia induce the secretion of proinflammatory medi- ators, such as reactive oxygen species (ROS), cytokines, and chemokines, and cause ATP depletion. Furthermore, during reperfusion, the acute ischemic myocardium is subjected to several abrupt biochemical and metabolic changes including intracellular calcium overload, energy depletion, acidosis, activation of granulocytes, and the generation of reactive oxygen species [33]. During the postmyocardial infarction period, we showed that nondiabetic hearts responded with altered levels for transcripts representing markers of inflam- mation (upregulation of Il10, Tnf, Il1b, and Il6 expres- sions), apoptosis (upregulation of Tp53, Bax, and caspase 3 expressions), antioxidant defense (downregulation of Gpx3, Gpx4, Gstk1, Txnrd2, Sod3, and catalase expressions), and the prosurvival PI3K/Akt pathway (upregulation of Rps6k, Btk, Pik3cg, and Prkcb and down regulation of pdk2 and Prkcz expressions). These genes were inversely regulated in ischemic/reperfused diabetic hearts when compared to the nondiabetic myocardium. Hence, it is plausible to speculate that these genes may play an important role in the short-term induced cardioprotection against myocardial ischemia/reperfusion injury.
5. Conclusions
Our data shows that a mild hyperglycaemic environment provides protection to the heart against ischemia/reperfusion injury, at least in the early phase of the disease. Lists of genes demonstrating changes in their expression patterns are strongly influenced by the duration and severity of the diabetic state and ischemic insults. In our setup (45 min ischemic time and 24 h reperfusion), the downregulation of apoptotic genes, myocardial proinflammatory cytokine tumor necrosis factor-𝛼, hypertrophic marker alpha actin- 1, and profibrogenic transforming growth factor-𝛽 may at least be due to the activation of the prosurvival PI3K/Akt pathway and the upregulation of antioxidants during the acute phase of diabetes. From a clinical perspective, gene expression profiling studies aiming towards the discovery of pathways and identification of factors leading to coronary heart disease in diabetic patients, a high risk population, may help to design new preventive/therapeutic strategies.
A limitation of our study was that we did not investigate the protein expression of the genes in PRC array that were regulated but confined the investigation solely to profiling the myocardial transcriptome in diabetic rats after acute myocardial infarction.
Conflict of Interests
The authors declare that they have no conflict of interests.
Acknowledgments
This study was supported by the Deutsche Gesellschaft f¨ur Kardiologie (German Cardiac Society) (to S. Korkmaz-Ic¨oz), by the Hungarian Research Fund (OTKA PD100245 to Tam´as Radovits), and by the J´anos Bolyai Research Scholarship of the Hungarian Academy of Sciences (to Tam´as Radovits). The excellent technical assistance of Patricia Kraft, Tobias Mayer, Karin Sonnenberg, Nadine Weiberg, Ulrike Vogt, and Lutz Hoffmann is greatly acknowledged.
References
[1] G. C. Fonarow and P. Srikanthan, “Diabetic cardiomyopathy,”
Endocrinology and Metabolism Clinics of North America, vol. 35, no. 3, pp. 575–599, 2006.
[2] D. L. Severson, “Diabetic cardiomyopathy: recent evidence from mouse models of type 1 and type 2 diabetes,”Canadian Journal of Physiology and Pharmacology, vol. 82, no. 10, pp. 813–
823, 2004.
[3] M. J. Garcia, P. M. McNamara, T. Gordon, and W. B. Kannell,
“Morbidity and mortality in diabetics in the Framingham population. Sixteen year follow-up study,”Diabetes, vol. 23, no.
2, pp. 105–111, 1974.
[4] K. J. Mukamal, R. W. Nesto, M. C. Cohen et al., “Impact of dia- betes on long-term survival after acute myocardial infarction:
comparability of risk with prior myocardial infarction,”Diabetes Care, vol. 24, no. 8, pp. 1422–1427, 2001.
[5] P. H. Stone, J. E. Muller, T. Hartwell et al., “The effect of diabetes mellitus on prognosis and serial left ventricular function after acute myocardial infarction: contribution of both coronary disease and diastolic left ventricular dysfunction to the adverse prognosis. The MILIS Study Group,”Journal of the American College of Cardiology, vol. 14, no. 1, pp. 49–57, 1989.
[6] J. R. Alegria, T. D. Miller, R. J. Gibbons, Q.-L. Yi, and S. Yusuf,
“Infarct size, ejection fraction, and mortality in diabetic patients with acute myocardial infarction treated with thrombolytic therapy,”American Heart Journal, vol. 154, no. 4, pp. 743–750, 2007.
[7] S. P. Marso, T. Miller, B. D. Rutherford et al., “Comparison of myocardial reperfusion in patients undergoing percutaneous coronary intervention in ST-segment elevation acute myocar- dial infarction with versus without diabetes mellitus (from the EMERALD Trial),”American Journal of Cardiology, vol. 100, no.
2, pp. 206–210, 2007.
[8] D. Feuvray and G. D. Lopaschuk, “Controversies on the sensitiv- ity of the diabetic heart to ischemic injury: the sensitivity of the diabetic heart to ischemic injury is decreased,”Cardiovascular Research, vol. 34, no. 1, pp. 113–120, 1997.
[9] D. J. Paulson, “The diabetic heart is more sensitive to ischemic injury,”Cardiovascular Research, vol. 34, no. 1, pp. 104–112, 1997.
[10] C. Malfitano, A. L. de Souza Junior, and M. C. Irigoyen, “Impact of conditioning hyperglycemic on myocardial infarction rats:
cardiac cell survival factors,”World Journal of Cardiology, vol.
6, no. 6, pp. 449–454, 2014.
[11] Y. Goto, M. Kakizaki, and N. Masaki, “Production of sponta- neous diabetic rats by repetition of selective breeding,”Tohoku Journal of Experimental Medicine, vol. 119, no. 1, pp. 85–90, 1976.
[12] G. Hadour, R. Ferrera, L. Sebbag, R. Forrat, J. Delaye, and M. de Lorgeril, “Improved myocardial tolerance to ischaemia in the diabetic rabbit,”Journal of Molecular and Cellular Cardiology, vol. 30, no. 9, pp. 1869–1875, 1998.
[13] S. B. Kristiansen, B. Løfgren, N. B. Støttrup et al., “Ischaemic preconditioning does not protect the heart in obese and lean animal models of Type 2 diabetes,”Diabetologia, vol. 47, no. 10, pp. 1716–1721, 2004.
[14] M. Desrois, K. Clarke, C. Lan et al., “Upregulation of eNOS and unchanged energy metabolism in increased susceptibility of the aging type 2 diabetic GK rat heart to ischemic injury,”American Journal of Physiology—Heart and Circulatory Physiology, vol.
299, no. 5, pp. H1679–H1686, 2010.
[15] C. di Filippo, R. Marfella, S. Cuzzocrea et al., “Hypergly- cemia in streptozotocin-induced diabetic rat increases infarct size associated with low levels of myocardial HO-1 during ischemia/reperfusion,” Diabetes, vol. 54, no. 3, pp. 803–810, 2005.
[16] R. Marfella, M. D’Amico, C. Di Filippo et al., “Myocardial infarc- tion in diabetic rats: role of hyperglycaemia on infarct size and early expression of hypoxia-inducible factor 1,”Diabetologia, vol. 45, no. 8, pp. 1172–1181, 2002.
[17] A. A. Bulhak, C. Jung, C.-G. ¨Ostenson, J. O. Lundberg, P.-O.
Sjoquist, and J. Pernow, “PPAR-𝛼activation protects the type 2 diabetic myocardium against ischemia-reperfusion injury:
Involvement of the PI3-kinase/Akt and NO pathway,”American Journal of Physiology—Heart and Circulatory Physiology, vol.
296, no. 3, pp. H719–H727, 2009.
[18] S. Matsumoto, S. Cho, S. Tosaka et al., “Pharmacological preconditioning in type 2 diabetic rat hearts: the roles of mitochondrial ATP-sensitive potassium channels and the phos- phatidylinositol 3-kinase-Akt pathway,”Cardiovascular Drugs and Therapy, vol. 23, no. 4, pp. 263–270, 2009.
[19] H. J. Whittington, G. G. Babu, M. M. Mocanu, D. M. Yellon, and D. J. Hausenloy, “The diabetic heart: too sweet for its own good?”Cardiology Research and Practice, vol. 2012, Article ID 845698, 15 pages, 2012.
[20] M. M. Galagudza, M. K. Nekrasova, A. V. Syrenskii, and E. M.
Nifontov, “Resistance of the myocardium to ischemia and the efficacy of ischemic preconditioning in experimental diabetes mellitus,”Neuroscience and Behavioral Physiology, vol. 37, no. 5, pp. 489–493, 2007.
[21] N. Khandoudi, M. Bernard, P. Cozzone, and D. Feuvray, “Intra- cellular pH and role of Na+/H+exchange during ischaemia and reperfusion of normal and diabetic rat hearts,”Cardiovascular Research, vol. 24, no. 11, pp. 873–878, 1990.
[22] S. B. Kristiansen, B. Lofgren, J. M. Nielsen et al., “Comparison of two sulfonylureas with high and low myocardial K(ATP) channel affinity on myocardial infarct size and metabolism in a rat model of type 2 diabetes,”Diabetologia, vol. 54, no. 2, pp.
451–458, 2011.
[23] C. Lajoie, A. Calderone, F. Trudeau et al., “Exercise training attenuated the PKB and GSK-3 dephosphorylation in the myocardium of ZDF rats,”Journal of Applied Physiology, vol. 96, no. 5, pp. 1606–1612, 2004.
[24] M. V. Cohen, “Free radicals in ischemic and reperfusion myocardial injury: is this the time for clinical trials?”Annals of Internal Medicine, vol. 111, no. 11, pp. 918–931, 1989.
[25] S. W. Werns and B. R. Lucchesi, “Free radicals and ischemic tissue injury,”Trends in Pharmacological Sciences, vol. 11, no. 4, pp. 161–166, 1990.
[26] G. Zeng, F. H. Nystrom, L. V. Ravichandran et al., “Roles for insulin receptor, PI3-kinase, and Akt in insulin-signaling path- ways related to production of nitric oxide in human vascular endothelial cells,”Circulation, vol. 101, no. 13, pp. 1539–1545, 2000.
[27] T. F. Franke, D. R. Kaplan, and L. C. Cantley, “PI3K: downstream AKTion blocks apoptosis,”Cell, vol. 88, no. 4, pp. 435–437, 1997.
[28] Y. Qi, Z. Xu, Q. Zhu et al., “Myocardial loss of IRS1 and IRS2 causes heart failure and is controlled by p38𝛼MAPK during insulin resistance,”Diabetes, vol. 62, no. 11, pp. 3887–3900, 2013.
[29] Z. Lu, Y.-P. Jiang, W. Wang et al., “Loss of cardiac phospho- inositide 3-kinase p110𝛼 results in contractile dysfunction,”
Circulation, vol. 120, no. 4, pp. 318–325, 2009.
[30] Y. Fujio, T. Nguyen, D. Wencker, R. N. Kitsis, and K. Walsh,
“Akt promotes survival of cardiomyocytes in vitro and protects against lschemia-reperfusion injury in mouse heart,”Circula- tion, vol. 101, no. 6, pp. 660–667, 2000.
[31] J. Jager, T. Gr´emeaux, M. Cormont, Y. le Marchand-Brustel, and J.-F. Tanti, “Interleukin-1beta-induced insulin resistance in adipocytes through down-regulation of insulin receptor substrate-1 expression,”Endocrinology, vol. 148, no. 1, pp. 241–
251, 2007.
[32] B. Swynghedauw, “Molecular mechanisms of myocardial remodeling,”Physiological Reviews, vol. 79, no. 1, pp. 215–262, 1999.
[33] D. J. Hearse and R. Bolli, “Reperfusion induced injury: mani- festations, mechanisms, and clinical relevance,”Cardiovascular Research, vol. 26, no. 2, pp. 101–108, 1992.
Submit your manuscripts at http://www.hindawi.com
Stem Cells International
Hindawi Publishing Corporation
http://www.hindawi.com Volume 2014
Hindawi Publishing Corporation
http://www.hindawi.com Volume 2014
INFLAMMATION
Hindawi Publishing Corporation
http://www.hindawi.com Volume 2014
Behavioural Neurology
Endocrinology
International Journal ofHindawi Publishing Corporation
http://www.hindawi.com Volume 2014
Hindawi Publishing Corporation
http://www.hindawi.com Volume 2014
Disease Markers
Hindawi Publishing Corporation
http://www.hindawi.com Volume 2014
BioMed
Research International
Oncology
Journal ofHindawi Publishing Corporation
http://www.hindawi.com Volume 2014
Hindawi Publishing Corporation
http://www.hindawi.com Volume 2014
Oxidative Medicine and Cellular Longevity
Hindawi Publishing Corporation
http://www.hindawi.com Volume 2014
PPAR Research The Scientific World Journal
Hindawi Publishing Corporation
http://www.hindawi.com Volume 2014
Immunology Research
Hindawi Publishing Corporation
http://www.hindawi.com Volume 2014
Journal of
Obesity
Journal ofHindawi Publishing Corporation
http://www.hindawi.com Volume 2014
Hindawi Publishing Corporation
http://www.hindawi.com Volume 2014
Computational and Mathematical Methods in Medicine
Ophthalmology
Journal ofHindawi Publishing Corporation
http://www.hindawi.com Volume 2014
Diabetes Research
Journal ofHindawi Publishing Corporation
http://www.hindawi.com Volume 2014
Hindawi Publishing Corporation
http://www.hindawi.com Volume 2014
Research and Treatment
AIDS
Hindawi Publishing Corporation
http://www.hindawi.com Volume 2014
Gastroenterology Research and Practice
Hindawi Publishing Corporation
http://www.hindawi.com Volume 2014
Parkinson’s Disease
Evidence-Based Complementary and Alternative Medicine
Volume 2014 Hindawi Publishing Corporation
http://www.hindawi.com