Life Sciences 277 (2021) 119492
Available online 14 April 2021
0024-3205/© 2021 The Authors. Published by Elsevier Inc. This is an open access article under the CC BY-NC-ND license
(http://creativecommons.org/licenses/by-nc-nd/4.0/).
Detection of acute stress by smooth muscle electromyography: A translational study on rat and human
Ildik ´ o Katalin Prib ´ ek
a,1, K ´ alm ´ an Ferenc Sz ucs ˝
b,1, Mikl ´ os Süle
c, Gy ¨ orgy Grosz
c, Eszter Ducza
d, D ora Vigh ´
b, Erika T ´ oth
a, Zolt ´ an Janka
a, J ´ anos K ´ alm ´ an
a, Zsolt L ´ aszl ´ o Datki
a,
R ´ obert G ´ asp ´ ar
b,2,*, B ´ alint And ´ o
a,**,2aDepartment of Psychiatry, Faculty of Medicine, University of Szeged, Szeged, Hungary
bDepartment of Pharmacology and Pharmacotherapy, Faculty of Medicine, University of Szeged, Szeged, Hungary
cMDE GmbH, Walldorf, Germany
dDepartment of Pharmacodynamics and Biopharmacy, Faculty of Pharmacy, University of Szeged, Szeged, Hungary
A R T I C L E I N F O Keywords:
Gut-brain axis Stress
Electromyography Rat Trier Social Stress Test
A B S T R A C T
Aims: Non-invasive and simultaneous recording of gastrointestinal (GI) activity during stress induction is still an unexplored field. In our previous investigation, the stress-induced alteration of the gastrointestinal tract was explored in rats. Our aims were to expand our previous rat experiment and to induce stress response in rats (Study 1) and humans (Study 2) to detect the GI tract activity, heart rate and body temperature.
Materials and methods: In the preclinical sample, acute stress was induced by immobilization in Sprague-Dawley rats (N =10). Acute stress response was generated by the Trier Social Stress Test among healthy volunteers (N = 16). Detection of acute stress was measured by using smooth muscle electromyography, which recorded the myoelectric waves of the gastrointestinal tract (stomach, ileum and colon) simultaneously with heart rate and body temperature in rats and humans.
Key findings: The myoelectric waves of the stomach, the cecum and the ileum increased during immobilization in rats, rising in parallel with heart rate and the dermal temperature of the abdominal surface. The same alterations were found during the stress period among humans, except in the case of the colon, where no change was detected.
Significance: The crucial role of the GI tract in stress response was revealed by translating the outcome of basic research into human results. The similar GI alterations during stress in rats and humans underpin the robustness of our findings. In summary, our preliminary translational-based study can serve as an appropriate basis for further human studies.
1. Introduction
Recently, as high as 74% of U.K. adults reported to be overwhelmed by stress [1], which is a non-specific, physiological reaction of the body
to any kind of encumbrances [2,3]. The sympathetic-adrenal-medullary (SAM) system and the hypothalamic–pituitary–adrenal (HPA) axis are responsible for responding to acute and chronic stressors, which contribute to the development of somatic (e.g. cardiovascular diseases,
Abbreviations: BMI, body mass index; BPM, beats per minute; BT, body temperature; CPM, cycle per minute; ECG, electrocardiogram; FFT, Fast Fourier Trans- formation; GBA, gut-brain axis; GI, gastrointestinal; GSI, Global Severity Index; HPA axis, hypothalamic–pituitary–adrenal axis; HR, heart rate; LI, large intestine; PS, power spectrum; PsDmax, power spectrum density maximum value of the Fast Fourier Transformation; SAM, sympathetic-adrenal-medullary system; SCL-R-90, Symptom Checklist Revised; SEM, standard error of mean; SI, small intestine; SMEMG, smooth muscle electromyography; ST, stomach; STAI, Spielberger State Anxiety Inventory; TSST, Trier Social Stress Test.
* Correspondence to: R. Gasp´ ´ar, 12 D´om t´er, Szeged H-6720, Hungary.
** Correspondence to: B. And´o, 8-10 Kor´anyi fasor, Szeged H-6720, Hungary.
E-mail addresses: gaspar.robert@med.u-szeged.hu (R. G´asp´ar), ando.balint@med.u-szeged.hu (B. And´o).
1 Share first authorship.
2 The authors contributed equally to this work.
Contents lists available at ScienceDirect
Life Sciences
journal homepage: www.elsevier.com/locate/lifescie
https://doi.org/10.1016/j.lfs.2021.119492
Received 25 September 2020; Received in revised form 22 March 2021; Accepted 3 April 2021
allergies) and psychiatric disorders (e.g. depression, anxiety, post- traumatic stress disorder) [4–7].
Additionally, numerous articles revealed the role of the gut-brain axis (GBA) in stress response. The GBA allows bidirectional communi- cation between the central nervous system and the gastrointestinal (GI) tract through neural and humoral pathways [8]. Recently, considerable attention has been paid to the potential role of the GBA in developing GI diseases due to stressors (e.g. inflammatory bowel disease, irritable bowel syndrome) [8].
Consequently, the GBA plays a key role in understanding the phys- iological reactions to acute stressors. Therefore, a device capable of measuring the stress-induced modifications in the GI tract via myoelectric signals may serve as a stress detector. This myoelectric signal is generated by the interstitial cells of Cajal (ICC) and propagates electric impulses which can be detected from the abdomen surface non- invasively [9,10]. Nevertheless, the non-invasive detection of the myoelectric activity of the human GI tract is still poorly developed.
However, recent rodent studies by Szucs et al. [11,12] identified and ˝ characterized the myoelectric signals of the stomach, the ileum and the cecum and their acute stress responses were also identified by smooth muscle electromyography (SMEMG). The alterations in SMEMG pa- rameters had a good correlation with the changes in plasma cortico- sterone levels of rats. These preclinical studies confirmed the functional significance and monitoring option of the GBA in stress. However, other indicators of acute stress response such as heart rate (HR) and body temperature (BT) were not investigated simultaneously. The physio- logical reactions to acute stressor are similar in rats and humans [13], therefore the combined measurements of stress response elements can be easily translated to humans, thereby providing a useful model for human study.
Several physiological, psychological, and pharmacological stress inductions can be applied to induce and objectify the stress level [14,15]. Immobilization in rats and social stress among humans are reliable and valid stress-induction procedures [11,12,16,17]. To assess the psychophysiological aspects of stress-induced response in humans, invasive (e.g. blood cortisol level) and non-invasive procedures (e.g.
heart rate, body temperature, galvanic skin response) are available.
Translation-based studies are important to bridge the gap between basic and clinical experiments [18], serving as an appropriate basis of initiation and design of human studies. Therefore, our aim was to extend the previous rat experiments [11,12] with multiple detection of stress response with a device detecting physiological parameters (GI tract, HR and BT) simultaneously in immobilization stress (Study 1). Our further aim was the multiple measurement of the stress response to induced acute moderate social stress generated by the Trier Social Stress Test (TSST) in humans [19] by the device modified to humans (Study 2).
2. Material and methods 2.1. Study 1
2.1.1. Housing and handling of the animals
During the rat experiment, 10 male Sprague-Dawley rats were used in the study. The animals were treated in accordance with the European Communities Council Directive (2016/63/EU) and the Hungarian Act for the Protection of Animals in Research (Article 32 of Act XXVIII). The experiment was accomplished with the approval of the Hungarian Ethical Committee for Animal Research (registration number: IV/3796/
2015). Sprague-Dawley rats (Charles-River Laboratories, Budapest, Hungary) were placed in a relative humidity of 30–70% and at 22 ± 3 ◦C, under a 12 h light/12 h dark cycle. Tap water and standard rodent pellet food (Charles-River Laboratories, Budapest, Hungary) were given ad libitum.
2.1.2. Electromyographic measurements and procedures
The study was carried out in the Department of Pharmacology and
Pharmacotherapy, University of Szeged, Hungary. Before the day of stress induction, a bipolar disk electrode pair was fixed subcutaneously to male rats (10–14 weeks old, 260–350 g, N =10) anesthetized with isoflurane inhalation (SEN-15-2; MDE GmbH, Walldorf, Germany). The distance between the two electrodes was 20 mm and they were fixed 1 cm right from the midline above the gastrointestinal tract. The con- necting cable of the sensor to the swivel was conducted subcutaneously and the terminal was taken out through the skin of the neck. We closed the abdominal and cervical incision surfaces after the placement of the sensor with surgical sutures and staples. On the day after the implan- tation of the sensors, the basal GI SMEMG activity was detected together with HR and BT by an SMEMG/HR/BT Holter system (MDE GmbH, Walldorf, Germany). Two hours before and during the detection, food and water were withdrawn. Each animal was placed in cages with a transparent wall at the front side and high-pitched walls.
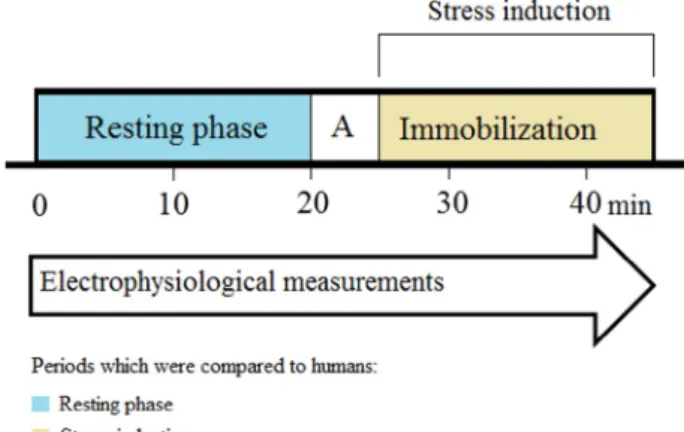
The SMEMG measurements under stress condition were carried out between 9.00 and 11.00 a.m. at room temperature (24 ◦C). During the study stress protocol (Fig. 1), the animals were not regulated in their movements for 20 min while recording their heart frequency, BT and basal GI tract activity (control/resting phase). Then the rats were anesthetized with 3.5% isoflurane inhalation and were immobilized onto a glass plate by strong sticky belts, which meant that the rats could not move or turn around. The examined electrophysiological parameters were recorded again after full awakening (3–5 min) for 20 min under this stress condition. Regarding the interpretation of the physiological parameters, if the values were greater than one standard deviation, they were considered as outliers, and therefore they were excluded from the analysis.
2.1.3. Collection of rat plasma samples and plasma corticosterone analysis At the end of resting and stress periods of 20 min, samples of 0.5 ml blood were collected from the tail veins into 1 ml tubes containing K3EDTA (0.6 mg/tube) and centrifuged (1700 ×g, 10 min, 4 ◦C) to separate plasma. The plasma samples were stored at − 20 ◦C until hor- mone assay. The plasma concentration of corticosterone was measured by enzyme-linked immunosorbent assay (ELISA). A Mouse/Rat Corti- costerone ELISA (BioVendor, Bio-Kasztel Ltd., Hungary) kit was used for the quantification of corticosterone, according to the manufacturer’s manual.
2.2. Study 2
2.2.1. Participants and procedure
The study was carried out in the Department of Psychiatry, Univer- sity of Szeged, Hungary. The investigations were conducted in air- conditioned examination rooms, the temperature was set to 24 ◦C.
Twenty-one healthy volunteers participated in the study. The age of the
Fig. 1. The stress protocol inducing immobilization in rats. Abbreviation: A
=anesthesia.
participants was between 21 and 26 years. The volunteers were based on convenience sampling and did not receive any remuneration for participating in the study. Prior to enrolment, a written informed con- sent form was used.
At the start of the study, demographic data (gender, age and educational attainment) was gathered, and weight, height and abdom- inal circumference were taken. Based on the self-reported Symptom Checklist Revised (SCL-R-90), the Global Severity Index (GSI), which indicates the current level of distress, was calculated [20,21]. The questionnaire was reliable in our sample based on the Cronbach Alpha value (α: 0.958) [22]. In addition, to establish the efficacy of the TSST protocol, the Spielberger State Anxiety Inventory (STAI) [23,24] was applied to measure state anxiety during stress induction. STAI was administered at three time points in the TSST protocol: after the resting phase, during stress induction and in the recovery phase (Fig. 2). STAI questionnaires were reliable in our sample based on the Cronbach Alpha values [22] (resting phase: Cronbach α = 0.906, stress induction:
Cronbach α =0.947, recovery phase: Cronbach α =0.939).
Exclusion criteria were major psychiatric disorders, a BMI index below 18 or above 30, scores greater than two standard deviations on GSI, chronic diseases, current medication (except contraceptives) and current drug and/or alcohol consumption. Regarding the exclusion criteria, 5 participants were excluded (measurement error, outlier on GSI, pharmacotherapy, BMI index), therefore the final sample size was 16. Subjects refrained from eating 2 h before starting the study, which ensured the standardization of the initial GI parameters. During the measurements, drinking water was provided if it was necessary. The study lasted approximately 90 min per individual.
The Trier Social Stress Test [19] protocol started after the application of the SMEMG/HR/BT/GSR Holter device. The TSST provides an op- portunity for inducing moderate acute social stress in laboratory con- ditions. The TSST protocol began at 3 p.m. in view of the circadian rhythm of the subjects [25,26]. The protocol consisted of three phases, each of them lasting 20 min: resting phase, stress induction and recovery phase. Following the resting phase, a three-member selection committee was introduced as behavioral analysts and it was announced that the selection committee would interpret the nonverbal behavior of the participants and the performance would be recorded by a video camera to conduct further analysis. Then the subject had to prepare alone for 10 min (anticipatory stress phase) for a 5-minute job interview simulation in front of the selection committee. During the job interview, the par- ticipants had to make an introduction to the selection committee and convince them that the participant was the right choice for a dream job (first stress situation). Afterwards, the participant had to perform an arithmetic task for 5 min and had to count loudly from 1022 by 13 as fast and as accurately as possible (second stress situation). The TSST pro- tocol ended with the recovery phase and the participant was informed
that the video camera was not turned on during the study and the speech and math performances were not recorded [19] (Fig. 2). The efficacy of the stress protocol was confirmed by the STAI total score which was significantly higher (p <0.001) after stress induction than in the resting and the recovery phase. (For detailed information, see the Supplemen- tary Material.)
The study was conducted in accordance with the Declaration of Helsinki and the protocol was approved by the Human Investigation Review Board, University of Szeged (ethical approval number: 134/
2017).
2.2.2. Holter device measuring SMEMG/HR/BT/GSR
The SMEMG/HR/BT/GSR Holter system recorded the physiological parameters real-time (Fig. 3). The smooth muscle electromyographic (SMEMG), electrocardiographic (ECG) and body temperature changes (BT) of the subjects were recorded simultaneously and non-invasively on the abdominal surface. The signals were detected with a thermometer combined electrode pair fixed on the abdominal dermal surface of the healthy volunteers. The measurement procedure with the Holter device is painless and completely harmless. The waves detected through the electrodes were amplified by the transducer analogue amplifiers and digitized by appropriate A/D conversion.
Abdominal circumference was measured before positioning the combined electrodes. As a standard, 10% of the abdominal circumfer- ence was considered as the measurement distance from the baseline (navel). In each case, a pea-sized amount of EEG conductive paste was positioned to each electrode using a medical spatula. Subsequently, the electrodes were applied in a triangle shape on the abdominal wall, the highest vertex of the triangle was the electrode measuring BT (Fig. 3.).
The Holter system was placed in a sealable pouch fixed to a belt and the device recorded the biological parameters during the stress protocol.
Additionally, galvanic skin response (GSR) reflecting sweat gland activity was recorded non-invasively. GSR measurement was carried out with 10-μm gold-plated silver electrodes fixed with Velcro on the non- dominant index and middle fingers of the participants. Before posi- tioning the electrodes, conductive paste was used on the skin surface (Fig. 3).
2.3. Evaluation and statistical analysis
The myoelectric signals of the GI tract, HR and BT parameters of the rat (Study 1) and human samples (Study 2) were analyzed by Easy Chart software (MDE GmbH, Walldorf, Germany). During evaluation, a digital cutter was used to remove the motion artefacts whose edge values were given by motion-free artefacts. Consequently, high-amplitude values resulting from motion did not distort the GI signals [12]. The recorded values of the GI parameters were evaluated by Fast Fourier trans- formation (FFT), which required at least a 20-minute measurement period in each phase, therefore rats and humans were exposed to equal stress time. Therefore, the results of the rat experiment could also be translated in time for human results. HR (Study 1 and Study 2) and GSR (Study 2) values were evaluated in every 5 min during both the resting phase and stress induction. The values of each stage were aggregated so both HR and GSR could be described by a single mean value during the resting phase and stress induction. To explore the changes in BT, stress induction 0 min (t0) was compared to stress induction 20 min (t20) in rats (Study 1) and humans (Study 2), respectively.
In the human sample (Study 2), supplementary analyses were con- ducted similarly to compare the changes between the stress induction and the second resting phase in the case of the GI parameters and HR. As regards BT, stress induction 20 min (t0) was compared to the subsequent 20 min of the resting phase (t20).
The magnitude of the electrical activity of the GI parameters was characterized by power spectrum density (PsDmax), HR was defined by bpm (beats per minute) and BT was described by ◦C (Study 1 and Study 2). Furthermore, the plasma level of corticosterone was defined by ng/
Fig. 2. The Trier Social Stress Test protocol. Abbreviations: AS =Anticipatory Stress phase (10 min speech preparation), M =Arithmetic task (5 min), S = Speech task (5 min), × =measuring state anxiety with Spielberger State Anx- iety Inventory.
ml in rats (Study 1) and GSR was characterized by kOhm among humans (Study 2).
The electromyographic results were statistically analyzed with IBM SPSS Statistics 24.0 software together with plasma corticosterone and galvanic skin response [27]. Values greater than one standard deviation in the physiological parameters were considered as outliers and were therefore excluded from the analysis. Wilcoxon signed-rank tests were calculated regarding the biological parameters (stomach, colon, small intestine, HR, BT, plasma level of corticosterone and GSR) between the resting phase and stress induction. In the human sample, differences between stress induction and the recovery phase were analyzed by further Wilcoxon signed-rank tests in terms of the physiological vari- ables (stomach, large intestine, small intestine, HR and BT). State anx- iety was evaluated by repeated-measures ANOVA during the TSST protocol. The results were considered statistically significant if p <0.05.
The reliability of the psychometric questionnaires was identified by the Cronbach Alpha value, which measures the internal consistency of the items. If the value of Cronbach Alpha is above 0.7, the questionnaire is reliable in the sample [22].
3. Results
3.1. Measurements with the combined electrodes (myograph and body temperature)
The SMEMG, ECG and BT signals were revealed parallel both in rat and human experiments. The SMEMG signals were transformed to spectra by FFT analysis to reveal the different PsDmax values for the segments of the GI tract (Figs. 4 and 5).
3.2. Comparison of the results in rats (Study 1) and humans (Study 2) In the animal experiment (Study 1), a total of 10 Sprague-Dawley male rats were involved. In the human sample (Study 2), 7 men and 9 women participated and the mean age was 23.56 (SE = 0.33).
Furthermore, 6 participants (37.5%) had secondary and 10 subjects (62.5%) had higher education. The mean score of GSI was 0.56 (SE = 0.09).
Changes in the SMEMG signals of the GI tract were characterized with PsDmax values. The SMEMG, HR and BT measurements were carried out between the resting phase and stress induction in rats and humans (Fig. 6).
3.2.1. GI tract
In rats, the gastric PsDmax values increased during immobilization (p
=0.005). During stress induction, the cecal PsDmax values were also elevated in rats (p = 0.013). Changes of the PsDmax in the ileum increased between the resting and stress phase (p =0.013) (Study 1).
In humans, the values of the PsDmax in the stomach were higher during the TSST than in the resting phase (p =0.048). No significant difference was observed in terms of the myoelectric waves of the large intestine during social stress in humans (p = 0.51). The myoelectric waves of the small intestine showed higher values during social stress than in the resting phase among humans (p =0.041) (Study 2) (Fig. 6A).
3.2.2. Heart rate
HR was higher during immobilization in rats (p =0.008) (Study 1).
HR was also higher during the TSST among humans compared to the resting phase (p <0.001) (Study 2) (Fig. 6B).
3.2.3. Body temperature
BT increased during immobilization in rats (p =0.007) (Study 1). In humans, the BT of the subjects was also significantly higher during the TSST compared to the resting phase (p =0.009) (Study 2) (Fig. 6C).
3.3. Additional measurements of stress-related responses in rats and humans
Immobilization increased the plasma level of corticosterone in rats (p =0.007) (Fig. S1). The rate of increase was 2.3-fold as compared with Fig. 3. A schematic figure of the Holter system. The figure represents the abdominal and GSR electrodes, which were connected to the Holter device. The Holter device was further connected to a computer via Bluetooth. Created with BioRender.com.
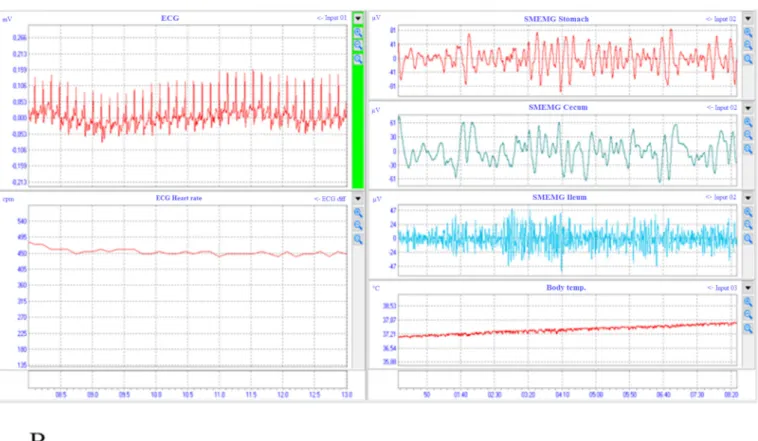
Fig. 4. The signals of ECG and SMEMG measurements in wakeful rats (Study 1). The ECG and the heart rate can be seen online on the left side, while the SMEMG signals of 3 GI tract segments are shown on the right side together with the body temperature data. All signals were detected with a thermometer combined electrode pair implanted to the abdominal subcutaneous area of rats (A). The spectra of the GI tract signal after FFT analysis. The highest peak belongs to the cecum, the middle peak is for the stomach, while the flat peak represents the ileum (B). Abbreviations: CPM =cycle per minute; μV =microvolt; ECG =electrocardiogram; SMEMG = smooth muscle electromyogram; PS: power spectrum.
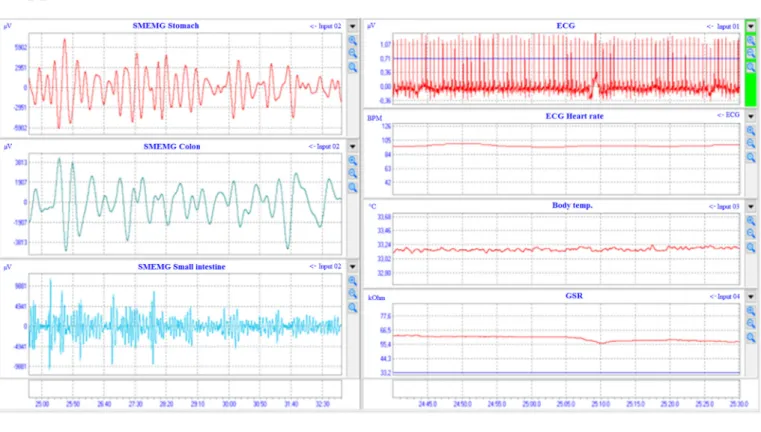
Fig. 5. The signals of ECG and SMEMG measurements in healthy volunteers (Study 2). The SMEMG signals of 3 GI tract segments are shown online on the left side, while ECG, HR and BT can be seen together with the GSR data on the right side. All signals were detected with a thermometer combined electrode pair fixed on the abdominal dermal surface of the subjects (A). The spectra of the GI tract signal after FFT analysis. The green peak belongs to the colon, the red peak is for the stomach, while the blue one represents the small intestine (B). Abbreviations: BPM =beats per minute; BT =body temperature; CPM =cycle per minute; ECG = electrocardiogram; GSR =galvanic skin response; HR =heart rate; PS =power spectrum; SMEMG =smooth muscle electromyogram. (For interpretation of the references to colour in this figure legend, the reader is referred to the web version of this article.)
the resting phase. This increase clearly justifies the stress condition in the animals and correlates with our previous findings [12] (Study 1).
For providing an additional real-time monitoring in humans, GSR was also recorded during Study 2. GSR decreased by 65% during the TSST (p =0.004) (Fig. S2) (Study 2).
3.4. Recovery phase after stress induction in the human sample (Study 2) Following stress induction, recording the examined parameters were continued in the second resting phase among humans therefore the data of the recovery phase were also observed. Gastric PsDmax values decreased significantly in the recovery phase (p =0.035). No significant differences were detected in the recovery phase in terms of the myoelectric waves of the large intestine (p =0.570). Concerning the PsDmax values of the small intestine, a significant decrease was showed
between the stress induction and the recovery phase (p =0.023). HR also significantly decreased in the recovery phase (p =0.004). In regard to BT, an increase in the level of tendency was observed in the recovery phase (p =0.050).
4. Discussion
Previous studies by Szucs et al. [11,12] reported an electromyo-˝ graphic method to measure acute stress response in vivo, focusing on the GI tract in rats. In our recent study, this method was translated and applied in humans, extended with parallel HR and BT measurements.
Prior to trying it in humans, the device was tested on rats (Study 1). In rats, the SMEMG signals of the GI tract (stomach, ileum and colon) and body temperature were recorded in vivo together with HR and BT during immobilization stress. Furthermore, the plasma level of corticosterone was also measured in rats to confirm the efficacy of stress induction. In humans, the Holter device was tested in healthy volunteers during social stress generated by the TSST [19]. This test is the most effective stress induction method in a laboratory setting [17] and its efficacy was also verified by STAI scores.
In the preclinical sample, the PsDmax of the SMEMG waves of the stomach, the cecum, and the ileum, HR and BT increased in rats during the stress induction process. In a rat experiment by Sz˝ucs et al. [12], an increased SMEMG activity of the GI tract was found during acute stress induction. Our present findings reinforced that the stress condition significantly increases the activity of SMEMG signals in the stomach, the ileum and the cecum of rats, which is detectable by a subcutaneously implanted electrode pair. Besides the GI SMEMG signal, we also detected stress-induced changes in HR with the same electrode pair. In general, the resting HR of the rat is extremely high as compared to humans (360 bpm), but this frequency increased by 32% during immobilization stress.
Finally, BT, as a third parameter was also investigated in parallel with GI SMEMG and HR. BT increased significantly by 0.05 ◦C during acute stress induction. In addition, an elevated plasma level of corticosterone was observed during immobilization, which further supports the effi- cacy of stress induction.
In healthy volunteers, similar alterations were found during the stress period with regard to gastrointestinal myoelectric activation as in the preclinical sample. Similarly to rats, the stomach and the small in- testine were found to be the most sensitive to acute stress in humans.
According to the literature, acute stress (e.g. arithmetic task, mirror drawing test) can increase gastric myoelectric activity in healthy sub- jects [28,29]. Although the stress-induced increase in the colon SMEMG activity was not significant in our human study, a few earlier studies reported a moderate increase in colon motility during psychological and physical stressors detected by manometry [30]. The clarification of this discrepancy requires further investigations. Furthermore, acute stress response increases the activity of the sympathetic nervous system, leading to an increased HR [31], therefore HR was recorded parallel with the GI tract. Exploring the changes in HR is crucial in sustained stress exposure as psychological stressors can contribute to cardiovas- cular outcomes, e.g. coronary artery disease [32]. The TSST increased the mean HR by 33.4%, which is consistent with the previously pub- lished data [19,33–35]. In addition, acute stress also elevates BT through human thermoregulation, which is a multifaceted process under the regulation of the central nervous system [36]. In the present study, BT was also measured simultaneously, which indicated that the TSST increased BT by 0.35 ◦C in humans. Furthermore, GSR decreased during stress induction, which was used as an additional physiological measure to assess stress levels, and it also provided real-time monitoring during the study. In consistence with the autonomic functions, the score of the self-reported level of state anxiety (STAI) was significantly higher after stress induction in the human sample, which also indicates an elevated level of anxiety. Thus, these alternations clearly justify the efficacy of stress condition among humans.
During the human study, in the second 20-minute resting period Fig. 6.Changes in the myoelectric waves of the gastrointestinal tract (A), heart
rate (B) and body temperature (C) during immobilization in rats (Study 1) and the TSST protocol in humans (Study 2). In rats, significant increases were detected in the changes of the myoelectric signals of the GI tract (stomach, cecum, ileum), HR and BT. In humans, the myoelectric waves of the stomach and the small intestine, heart frequency and BT showed significant increases.
Columns represent mean, error bars represent standard error of mean (SEM).
Abbreviations: body temp =body temperature (Unit: ◦C), HR bpm =heart rate (beats per minute); PsDmax =Power spectrum density maximum value of the Fast Fourier Transformation (Unit: μV2); TSST =Trier Social Stress Test (*, #: p
<0.05; **, ##: p <0.01; ###: p <0.001).
following social stress, the participants could rest in the recovery phase according to the TSST protocol. During this period, the participants continuously calmed down and the physiological parameters normal- ized, as indicated by the decreased level of HR and GI tract contractions.
The normalization of these parameters in the resting periods can be considered as proof of the reliability of our measurement.
Since similar stress response patterns were found in rats and humans (except for the large intestine in humans), we suppose that the stress response is detectable by SMEMG in different species, including humans (Fig. 7). In addition, plasma corticosterone levels were enhanced in rats, while the GSR value was reduced in humans during stress induction.
Since the increase in plasma corticosterone and the decrease in GSR are widely accepted as indicators of stress responses in rats and humans, respectively, these modifications confirm the presence of stress response in both species and support the interpretation of SMEMG responses to stress.
For the better understanding of stress reactivity both in animal and human stress models, the GI tract had been predicted to be a key factor.
We were able to record clear GI and cardiac signals both in wakeful rats and humans. The similarities between the SMEMG spectra of rats and humans are known [11]; therefore the pieces of information gained from the rat experiments provided a good basis for the human study. How- ever, the available human studies on the non-invasive SMEMG mea- surements of the GI tract are insufficient; most of the published data are related to the invasive detection of the role of stress and anxiety in functional GI diseases, e.g. stress-induced gastrointestinal inflammation, dysfunction, cellular and molecular mechanisms [37–39]. To the best of our knowledge, our work was the first study to detect 3 different elec- trophysiological signals (smooth muscle electromyography, HR and BT) simultaneously with one combined electrode pair during acute stress response both in rats and humans. The measurement of BT during different stress reactions is very frequent in rats; however, it is rarely used in human stress situations. The comparison of these data is difficult because normal BT determination is complicated [40]. For instance, significantly elevated axillary BT was detected during psychological stress [41], but the temperature measured at the periphery (upper arm skin) did not increase significantly during the TSST [36]. Nevertheless, the measurement of BT on the abdominal dermal surface seems appro- priate to detect the stress-induced alterations.
Some limitations of our study should also be noted. Firstly, this was a preliminary study with a limited number of subjects; therefore in further studies the sample size must be increased. Secondly, different stress inductions were used in rat and human samples. Our goal was to induce a quick and effective stress situation which is comparable between the preclinical and the human sample. Among humans, social stress was found to be the most effective [17], while immobilization proved to be a rapid stress induction method in rats [12]. Thirdly, the stress-induced elevation in BT depends on some further parameters (e.g. peripheral vasodilatation, ambient temperature) [42], but all these factors could not be controlled in our study. In the preclinical sample, only male rats were used; however, man and women were involved in the human sample. As for gender differences, no significant differences were detected in the human sample.
Animal (especially rat) stress models translated to humans offer special insight both for researchers and clinicians [43,44] since the co- morbidity of stress-induced anxiety and depression showed similar patterns in rats and humans [45]. In clinical practice, there is an urgent need for a non-invasive device measuring different electromyographic signals simultaneously during stress response [46]. The Holter device applied by our research group effectively measures 4 parameters simultaneously and non-invasively (GI SMEMG, HR, BT and GSR) during acute stress response in humans. Besides supporting the utility of this translational model, our findings were also emphasized by the alterna- tions in the plasma level of corticosterone and self-reported STAI scores in rats and humans, respectively. This confirms that stress induction was developed successfully both in rats and humans. However, further
assessment of the diagnostic properties (e.g. specificity and sensitivity) of this device in different stress and anxiety conditions is indispensable for its introduction into routine clinical practice in the future.
5. Conclusions
In a rat-to-human translational study, the crucial role of the GI tract in stress response was confirmed. The SMEMG/HR/BT device was used in a translational model for the first time. It represents a new technical basis to understand the stress-induced alterations in the myoelectrical activity of the GI tract in parallel with the alterations of HR and BT, which increased during stress induction in rats and humans. The current data revealed that the GBA has an important role in stress-induced re- sponses. The alternations of the similar parameters contribute to establishing further studies, especially in clinical settings. It is proposed that the device is suitable to detect the stress level and anxiety in pa- tients with various psychiatric disorders. For instance, stress and anxiety may participate in the development of alcohol use and affective disor- ders and play a crucial role in the course of these disorders [47,48], therefore investigating stress response is a key issue regarding psychi- atric illnesses.
Declaration of competing interest
The authors declare that there are no conflicts of interest.
Acknowledgement
We would like to thank Ad´ ´am Farkas, Nelli Fisher, Zita G´alik-Ol´ah, Kl´ara Heged˝us, M´aria Horv´ath, Lilla M´acsai, G´abor Mih´aly, Ilona Moln´ar and Ildik´o Kov´acs for their help in conducting the Trier Social Stress Test.
This research was supported by the EU-funded Hungarian grant EFOP-3.6.1-16-2016-00008. IKP was supported by the University of Fig. 7.Summary of results during stress inductions. Stress was induced by immobilization in rats and the Trier Social Stress Test was used among humans.
In rats, significant increases were observed in HR, BT and the myoelectric waves of the gastrointestinal tract (stomach, small intestine, large intestine).
Among humans, HR, BT and the myoelectric waves of the stomach and the small intestine showed significant increases. Created with BioRender.com.
Abbreviations: BT =body temperature; HR =heart rate; LI =large intestine; n.
s. =not significant; SI =small intestine; ST =stomach.
Szeged, Faculty of Medicine [EFOP-3.6.3-VEKOP-16-2017-00009].
Appendix A. Supplementary data
Supplementary data to this article can be found online at https://doi.
org/10.1016/j.lfs.2021.119492.
References
[1] Mental Health Foundation, Stress: Are We Coping? Mental Health Foundation, London, 2018.
[2] H. Selye, The evolution of the stress concept: the originator of the concept traces its development from the discovery in 1936 of the alarm reaction to modern therapeutic applications of syntoxic and catatoxic hormones, Am. Sci. 61 (1973) 692–699. https://www.jstor.org/stable/27844072 (accessed July 23, 2020).
[3] H. Selye, The Stress of Life, McGraw-Hill, New York, NY, 1956.
[4] S. Chiba, T. Numakawa, M. Ninomiya, M.C. Richards, C. Wakabayashi, H. Kunugi, Chronic restraint stress causes anxiety- and depression-like behaviors, downregulates glucocorticoid receptor expression, and attenuates glutamate release induced by brain-derived neurotrophic factor in the prefrontal cortex, Prog.
Neuro-Psychopharmacology Biol. Psychiatry. 39 (2012) 112–119, https://doi.org/
10.1016/j.pnpbp.2012.05.018.
[5] J. Montoro, J. Mullol, I. J´auregui, I. D´avila, M. Ferrer, J. Bartra, A. del Cuvillo, J. Sastre, A. Valero, Stress and allergy, J Investig Allergol Clin Immunol 19 (Suppl.
1) (2009) 40–47.
[6] T.B. Vanitallie, Stress: a risk factor for serious illness, Metabolism 51 (2002) 40–45, https://doi.org/10.1053/meta.2002.33191.
[7] P.H. Wirtz, R. von K¨anel, Psychological stress, inflammation, and coronary heart disease, Curr. Cardiol. Rep. 19 (2017), 111, https://doi.org/10.1007/s11886-017- 0919-x.
[8] G. De Palma, S.M. Collins, P. Bercik, E.F. Verdu, The microbiota-gut-brain axis in gastrointestinal disorders: stressed bugs, stressed brain or both? J. Physiol. 592 (2014) 2989–2997, https://doi.org/10.1113/jphysiol.2014.273995.
[9] K.M. Sanders, S.M. Ward, G.W. Hennig, Problems with extracellular recording of electrical activity in gastrointestinal muscle, Nat. Rev. Gastroenterol. Hepatol. 13 (2016) 731–741.
[10] R. Mazloom, A new approach for digestive disease diagnosis: dynamics of gastrointestinal electrical activity, Med. Hypotheses 128 (2019) 64–68.
[11] K.F. Szucs, A. Nagy, G. Grosz, Z. Tiszai, R. Gaspar, Correlation between slow-wave myoelectric signals and mechanical contractions in the gastrointestinal tract:
advanced electromyographic method in rats, J. Pharmacol. Toxicol. Methods 82 (2016) 37–44, https://doi.org/10.1016/j.vascn.2016.07.005.
[12] K.F. Sz˝ucs, G. Grosz, M. Süle, A. Sztojkov-Ivanov, E. Ducza, A. M´arki, A. Kothencz, L. Balogh, R. G´asp´ar, Detection of stress and the effects of central nervous system depressants by gastrointestinal smooth muscle electromyography in wakeful rats, Life Sci. 205 (2018) 1–8, https://doi.org/10.1016/j.lfs.2018.05.015.
[13] G.P. Moberg, The biology of animal stress: Basic principles and implications for animal welfare, in: Biol. Response to Stress Implic. Anim. Welf, 2000, pp. 1–22.
[14] N.P. Daskalakis, R. Yehuda, D.M. Diamond, Animal models in translational studies of PTSD, Psychoneuroendocrinology 38 (2013) 1895–1911, https://doi.org/
10.1016/j.psyneuen.2013.06.006.
[15] S. Thomas, A.K. Bacon, R. Sinha, M. Uhart, B. Adinoff, Clinical laboratory stressors used to study alcohol–stress relationships, Alcohol Res. 34 (2012) 459–467.
[16] E. Vermetten, J.D. Bremner, Circuits and systems in stress. I. Preclinical studies, Depress. Anxiety 15 (2002) 126–147.
[17] S.S. Dickerson, M.E. Kemeny, Acute stressors and cortisol responses: a theoretical integration and synthesis of laboratory research, Psychol. Bull. 130 (2004) 355–391, https://doi.org/10.1037/0033-2909.130.3.355.
[18] K. Akarowhe, Citation: Akarowhe K Translational Research: Definitions and Relevance, iMedPub, 2018.
[19] C. Kirschbaum, K.M. Pirke, D.H. Helhammer, The ‘Trier Social Stress Test’–a tool for investigating psychobiological stress responses in a laboratory setting, Neuropsychobiology 28 (1989) 76–81.
[20] L.R. Derogatis, SCL-90-R, Administration, Scoring and Procuderes Manual for the Revised Version, John Hopkins University, School of Medicine, Baltimore, 1977.
[21] Z. Unoka, S. Rozsa, N. K´ ˝o, J. K´allai, A. F´abi´an, L. Simon, A Derogatis-f´ele Tünetlista hazai alkalmaz´as´aval szerzett tapasztalatok./Experiences with the Hungarian version of Derogatis Symptom Check List, Psychiatr. Hungarica 3 (2004) 28–35.
[22] M. Tavakol, R. Dennick, Making sense of Cronbach’s alpha, Int. J. Med. Educ. 2 (2011) 53–55, https://doi.org/10.5116/ijme.4dfb.8dfd.
[23] C.D. Spielberger, R.L. Gorsuch, P.R. Lushene, P.R. Vagg, A.G. Jacobs, Manual for the State-Trait Anxiety Inventory (Form Y), Consulting Psychologists Press, Inc., Palo Alto, 1983.
[24] K. Sipos, M. Sipos, C.D. Spielberger, A State-Trait Anxiety Inventory (STAI) magyar v´altozata/The Hungarian version of State-Trait Anxiety Inventory (STAI). M´erei F., Szak´acs F. (eds.): Pszichodiagnosztikai Vademecum 2, Nemzeti Tank¨onyvkiad´o, Budapest, 1994, pp. 123–148.
[25] X. Hu, Y. Wang, J.C. Pruessner, J. Yang, Interdependent self-construal, social evaluative threat and subjective, cardiovascular and neuroendocrine stress response in Chinese, Horm. Behav. 106 (2018) 112–121, https://doi.org/10.1016/
j.yhbeh.2018.10.006.
[26] R. Sharma, S.A. Smith, N. Boukina, A. Dordari, A. Mistry, B.C. Taylor, N. Felix, A. Cameron, Z. Fang, A. Smith, N. Ismail, Use of the birth control pill affects stress reactivity and brain structure and function, Horm. Behav. 124 (2020), https://doi.
org/10.1016/j.yhbeh.2020.104783.
[27] IBM Corp, IBM SPSS Statistics for Windows, Version 24.0, IBM Corp., Armonk, NY, 2016.
[28] S. Homma, The effects of stress in response to mirror drawing test trials on the electrogastrogram, heart rate and respiratory rate of human subjects, J. Smooth Muscle Res. 41 (2005) 221–233, https://doi.org/10.1540/jsmr.41.221.
[29] G. Riezzo, P. Porcelli, V. Guerra, I. Giorgio, Effects of different psychophysiological stressors on the cutaneous electrogastrogram in healthy subjects, Arch. Physiol.
Biochem. 104 (1996) 282–286. https://www.tandfonline.com/doi/abs/10.1076/a pab.104.3.282.12899 (accessed July 23, 2020).
[30] S.S. Rao, R.A. Hatfield, J.M. Suls, M.J. Chamberlain, Psychological and physical stress induce differential effects on human colonic motility, Am. J. Gastroenterol.
93 (1998) 985–990, https://doi.org/10.1111/j.1572-0241.1998.00293.x.
[31] R.a.L. Dampney, M.J. Coleman, M.a.P. Fontes, Y. Hirooka, J. Horiuchi, Y.W. Li, J.
W. Polson, P.D. Potts, T. Tagawa, Central mechanisms underlying short- and long- term regulation of the cardiovascular system, Clin. Exp. Pharmacol. Physiol. 29 (2002) 261–268, https://doi.org/10.1046/j.1440-1681.2002.03640.x.
[32] H.M. Lagraauw, J. Kuiper, I. Bot, Acute and chronic psychological stress as risk factors for cardiovascular disease: insights gained from epidemiological, clinical and experimental studies, Brain Behav. Immun. 50 (2015) 18–30, https://doi.org/
10.1016/j.bbi.2015.08.007.
[33] B.M. Kudielka, A. Buske-Kirschbaum, D.H. Hellhammer, C. Kirschbaum, Differential heart rate reactivity and recovery after psychosocial stress TSST in healthy children, younger adults, and elderly adults: the impact of age and gender, Int. J. Behav. Med. 11 (2004) 116–121, https://doi.org/10.1207/
s15327558ijbm1102_8.
[34] P. J¨onsson, M. Wallergård, K. Osterberg, A.M. Hansen, G. Johansson, B. Karlson, Cardiovascular and cortisol reactivity and habituation to a virtual reality version of the Trier Social Stress Test: a pilot study, Psychoneuroendocrinology 35 (2010) 1397–1403, https://doi.org/10.1016/j.psyneuen.2010.04.003.
[35] D. Jezova, A. Makatsori, R. Duncko, F. Moncek, M. Jakubek, High trait anxiety in healthy subjects is associated with low neuroendocrine activity during psychosocial stress, Prog. Neuro-Psychopharmacology Biol. Psychiatry 28 (2004) 1331–1336, https://doi.org/10.1016/j.pnpbp.2004.08.005.
[36] C.H. Vinkers, R. Penning, J. Hellhammer, J.C. Verster, J.H.G.M. Klaessens, B. Olivier, C.J. Kalkman, The effect of stress on core and peripheral body temperature in humans, Stress 16 (2013) 520–530, https://doi.org/10.3109/
10253890.2013.807243.
[37] B. Dickhaus, E.A. Mayer, N. Firooz, J. Stains, F. Conde, T.I. Olivas, R. Fass, L. Chang, M. Mayer, B.D. Naliboff, Irritable bowel syndrome patients show enhanced modulation of visceral perception by auditory stress, Am. J.
Gastroenterol. 98 (2003) 135–143, https://doi.org/10.1111/j.1572- 0241.2003.07156.x.
[38] P.J. Kennedy, J.F. Cryan, E.M.M. Quigley, T.G. Dinan, G. Clarke, A sustained hypothalamic–pituitary–adrenal axis response to acute psychosocial stress in irritable bowel syndrome, Psychol. Med. 44 (2014) 3123–3134.
[39] N. Sugaya, S. Izawa, K. Kimura, N. Ogawa, K.C. Yamada, K. Shirotsuki, I. Mikami, K. Hirata, Y. Nagano, S. Nomura, H. Shimada, Adrenal hormone response and psychophysiological correlates under psychosocial stress in individuals with irritable bowel syndrome, Int. J. Psychophysiol. 84 (2012) 39–44, https://doi.org/
10.1016/j.ijpsycho.2012.01.006.
[40] C.H. Vinkers, R. Penning, M.M. Ebbens, J. Hellhammer, J.C. Verste, C.J. Kalkman, et al., Stress-induced hyperthermia in translational stress research, Open Pharmacol. J. 4 (2010) 30–35.
[41] D. Marazziti, A. Di Muro, P. Castrogiovanni, Psychological stress and body temperature changes in humans, Physiol. Behav. 52 (1992) 393–395, https://doi.
org/10.1016/0031-9384(92)90290-i.
[42] R.F. McGivern, D.G. Zuloaga, R.J. Handa, Sex differences in stress-induced hyperthermia in rats: restraint versus confinement, Physiol. Behav. 98 (2009) 416–420, https://doi.org/10.1016/j.physbeh.2009.07.004.
[43] K. Henningsen, J.T. Andreasen, E.V. Bouzinova, M.N. Jayatissa, M.S. Jensen, J.
P. Redrobe, O. Wiborg, Cognitive deficits in the rat chronic mild stress model for depression: relation to anhedonic-like responses, Behav. Brain Res. 198 (2009) 136–141, https://doi.org/10.1016/j.bbr.2008.10.039.
[44] M. Papp, P. Gruca, P.-A. Boyer, E. Moca¨er, Effect of agomelatine in the chronic mild stress model of depression in the rat, Neuropsychopharmacol. 28 (2003) 694–703, https://doi.org/10.1038/sj.npp.1300091.
[45] R. De La Garza, J.J. Mahoney, A distinct neurochemical profile in WKY rats at baseline and in response to acute stress: implications for animal models of anxiety and depression, Brain Res. 1021 (2004) 209–218, https://doi.org/10.1016/j.
brainres.2004.06.052.
[46] J.J. Robert-McComb, S. Casey, Y. Kim, M. Hart, R. Norman, X. Qian, Experimental models for research in stress and behavior, J. Behav. Brain Sci. 05 (2015) 295, https://doi.org/10.4236/jbbs.2015.57030.
[47] H.C. Becker, Effects of alcohol dependence and withdrawal on stress responsiveness and alcohol consumption, Alcohol Res. Curr. Rev. 34 (2012) 448–458.
[48] R.D. Goodwin, D.A. Stayner, M.J. Chinman, P. Wu, J.K. Tebes, L. Davidson, The relationship between anxiety and substance use disorders among individuals with severe affective disorders, Compr. Psychiatry 43 (2002) 245–252, https://doi.org/
10.1053/comp.2002.33500.