Non-invasive smooth muscle
electromyography (SMEMG) as a novel
monitoring technology of the gastrointestinal tract of awake, free-moving pigs—A pilot study
Katalin Nagy1, Hedvig Fe´bel2, George BazarID1,3*, Gyo¨ rgy Grosz4, Ro´ bert Ga´spa´r5, Ka´lma´n Ferenc SzűcsID5, Tama´s To´ th1,3
1 Institute of Animal Physiology and Nutrition, Hungarian University of Agricultural and Life Sciences, Kaposva´ r, Hungary, 2 Institute of Animal Physiology and Nutrition, Hungarian University of Agricultural and Life Sciences, Herceghalom, Hungary, 3 ADEXGO Kft., Balatonfu¨ red, Hungary, 4 MSB-MET Kft., Balatonfu¨red, Hungary, 5 Department of Pharmacology and Pharmacotherapy, Faculty of Medicine, University of Szeged, Szeged, Hungary
*bazar@agrilab.hu
Abstract
There are several mathematical models and measurements to determine the efficiency of the digestibility of different feedstuffs. However, there is lack of information regarding the direct methods or measurement techniques used to analyse the physical response of the different parts of the gastrointestinal tract (GIT) of growing pigs to different diets. Smooth muscle electromyography (SMEMG) is a non-invasive method for the measurement of gas- trointestinal myoelectrical activity. In the present study, SMEMG methodology has been adapted from laboratory rats to pigs, and the effects of feedstuffs with control (CTR) or experimentally increased (EXP) amounts of fibre were investigated on gastrointestinal tract motility. Nine barrow pigs ((Danish Landrace×Danish Yorkshire)×Danish Duroc) were used (30±3 kg), and their CTR and EXP feedstuffs contained 29 and 49 g/kg crude fibre (CF), respectively. Myoelectric activities of the stomach, ileum and caecum were detected in the awake pigs by a pair of electrodes. The recorded myoelectric signals were analysed with fast Fourier transformation (FFT), and the spectra were expressed in GIT section-spe- cific cycles per minutes (cpm) values and the maximum power spectrum density (PsDmax).
A significant increase (P<0.001) was observed in the value of the PsDmaxof the small intes- tine (20–25 cpm) as a consequence of the EXP diet. The PsDmax values of the stomach (3–5 cpm) and large intestine (1–3 cpm) did not show any significant change in pigs fed the EXP diet. As a direct and non-invasive method, SMEMG is suitable for the rapid evaluation of the effects of diets with different fibre contents on the GIT of non-anaesthetised, free-mov- ing pigs.
a1111111111 a1111111111 a1111111111 a1111111111 a1111111111
OPEN ACCESS
Citation: Nagy K, Fe´bel H, Bazar G, Grosz G, Ga´spa´r R, Ferenc Szűcs K, et al. (2021) Non- invasive smooth muscle electromyography (SMEMG) as a novel monitoring technology of the gastrointestinal tract of awake, free-moving pigs—
A pilot study. PLoS ONE 16(9): e0257311.https://
doi.org/10.1371/journal.pone.0257311 Editor: Ewa Tomaszewska, University of Life Sciences in Lublin, POLAND
Received: January 31, 2021 Accepted: August 27, 2021 Published: September 13, 2021
Peer Review History: PLOS recognizes the benefits of transparency in the peer review process; therefore, we enable the publication of all of the content of peer review and author responses alongside final, published articles. The editorial history of this article is available here:
https://doi.org/10.1371/journal.pone.0257311 Copyright:©2021 Nagy et al. This is an open access article distributed under the terms of the Creative Commons Attribution License, which permits unrestricted use, distribution, and reproduction in any medium, provided the original author and source are credited.
Data Availability Statement: All relevant data are within the paper and itsSupporting Information files.
Introduction
Digestion is affected by many factors, such as the physical and chemical characteristics of feed [1], feed processing [2], different animal factors and nutritional levels [3]. Dietary fibre regu- lates motility and digestive transit time through the gastrointestinal tract (GIT) [4].
There are several models to predict the digestibility of different feedstuffs. These models can integrate theories and observations to obtain a comprehensive view of complex biological systems [5]. Ileal or total tract digestion models have been developed for pigs [6–8], in which digestibility is predicted by separately quantifying transit time, endogenous secretions, degra- dation, absorption and microbial fermentation. These predictions are required because of the limited quantitative information concerning the digestion and transit kinetics in the different segments of the GIT of pigs. Moreover, the gastric emptying process is represented by different masses of feedstuff or segments of the digestive tract [6–8].
Only a few methods are available to analyse the physical reaction of the different parts of the GIT to the consumed feed. Electrogastrography (EGG) is a non-invasive method for the measurement of gastric myoelectrical activity [9]. The GIT smooth muscle has pacemaker cells, called the interstitial cells of Cajal (ICCs), that play a key role in the generation and prop- agation of the electric signal in GIT contractility, which is measurable. The newly developed smooth muscle electromyography (SMEMG) method examines the different organs of the GIT (the stomach, small and large intestine), rather than examining only gastric myoelectrical activity as in the case of EGG. Pigs can be used in various preclinical experiments [10–15] as an omnivorous representative due to their relatively similar gastrointestinal functions to those of humans [16,17].
In human (especially awake) patients and large model animals such as pigs, there are few possibilities to record myoelectric signals directly from the colon or small intestine other than using electrodes placed on the body surface, as the placement of various internal sensors is considerably difficult. However, in a rat experiment [18] electrodes were implanted on the outer surface of the digestive tract, and the slow-wave frequency parameters of the gastric, small intestine and large intestine segments of the GIT were identified using smooth muscle electromyography. The changes in the myoelectric activity of the GIT were followed with SMEMG in parallel with the mechanical contractions in anaesthetised rats using a strain gauge tool. Another SMEMG experiment was carried out in awake rats, measuring GIT activity under normal and stressed conditions [19].
Based on these earlier findings, our study primarily aims to develop the non-invasive SMEMG measurement applied for pigs, and to identify and analyse myoelectric signals of the different GIT segments in growing and awake pigs. The secondary objective is to investigate the effect of fibre-rich nutrition on the GIT activity of pigs, using the applied SMEMG method.
Materials and methods
Housing and handling of the animals
The animals were treated following the European Communities Council Directives (2010/63/
EU) and the Hungarian Act for the Protection of Animals in Research (Article 32 of Act XXVIII). All experiments involving animal subjects were carried out with the approval of the Hungarian Ethical Committee for Animal Research (registration number: VIII-I-001/01854- 0005/2014).
Nine barrow pigs ((Danish Landrace×Danish Yorkshire)×Danish Duroc) were used at age 72±3 days. Average body weight (BW) was 30±3 kg. The animals were housed
Funding: This publication was prepared within the framework of the predoctoral scholarship program of the Ministry of Human Capacities, Hungary (project number: EFOP-3.6.3-VEKOP-16-2017- 00005). The results discussed in this publication are the outcome of an independent research that was part of a PhD work. The conditions (stable, animals, human resources) were provided and financed by Sze´chenyi Istva´n University and Hungarian University of Agricultural and Life Sciences, which has been recognized in the
„Acknowledgements” section. Commercial R&D companies, ADEXGO Kft. and MSB-MET Kft.
provided support in the form of salaries for authors [G. Bazar, Gy. Grosz, T. To´th], but did not have any additional role in the study design, data collection and analysis, decision to publish, or preparation of the manuscript. The specific roles of these authors are articulated in the ‘author contributions’ section.
Competing interests: Authors G. Bazar and T. To´th are partly employed by a commercial R&D company, ADEXGO Kft., and Gy. Grosz is employed by a commercial R&D company, MSB-MET Kft.
However, these conditions do not alter the authors’
adherence to PLOS ONE policies on sharing data and materials. The mentioned companies only provided financial support in the form of authors’
salaries, and did not play a role in the study design, data collection and analysis, decision to publish, or preparation of the manuscript.
individually (1 pig/pen, 1 m2/pig) without litter, and water was offered ad libitum.Fig 1sum- marises the full random crossover trial design, in which the two diets (control and experimen- tal) were administered in an alternating manner in four iterative cycles, each comprising an adaptation period (five days) and measuring day.
Diet and chemical analysis
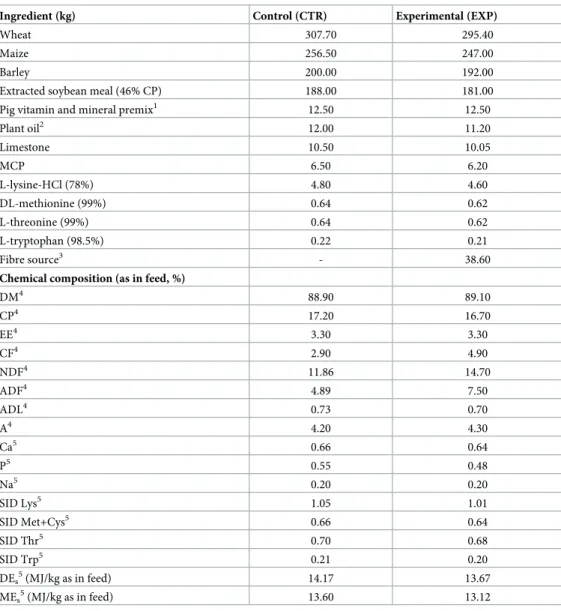
The control diet (CTR) contained a low level of crude fibre (CF; 29 g/kg as in feed) and was prepared from wheat, maize, barley and soybean meal without a specific fibre source. The experimental diet (EXP) corresponded to the control diet, except that it had an increased CF content (49 g/kg as in feed) due to the addition of a concentrated fibre source (Opticell C5, Agromed Austria GmbH, Kremsmu¨nster, Austria). Ingredients and analysed or calculated chemical characteristics of the diets are given inTable 1.
Dry matter (DM), crude protein (CP), crude fibre (CF), neutral detergent fibre (NDF), acid detergent fibre (ADF), acid detergent lignin (ADL), ether extract (EE), ash (A) of CTR and EXP diets were determined. The chemical analysis of the diets was performed following the AOAC protocol [20] and the standard laboratory procedures.
Outside the experimental period, pigs received the CTR diet. The control and experimental diets were fed for five days before the SMEMG measurements were taken. The animals received the daily amount of feed in two equal portions, covering 2.8 times their maintenance energy requirement (450 kJ MEs/kg0.75/day). The daily amount of feed was calculated based on the body weight (BW) of the animals (the growing pigs were weighed every week, and the fed diet was adjusted to their BW). The pigs were fed at 7.00 a.m. and 12.00 a.m.
Detection of gastrointestinal myoelectric activity
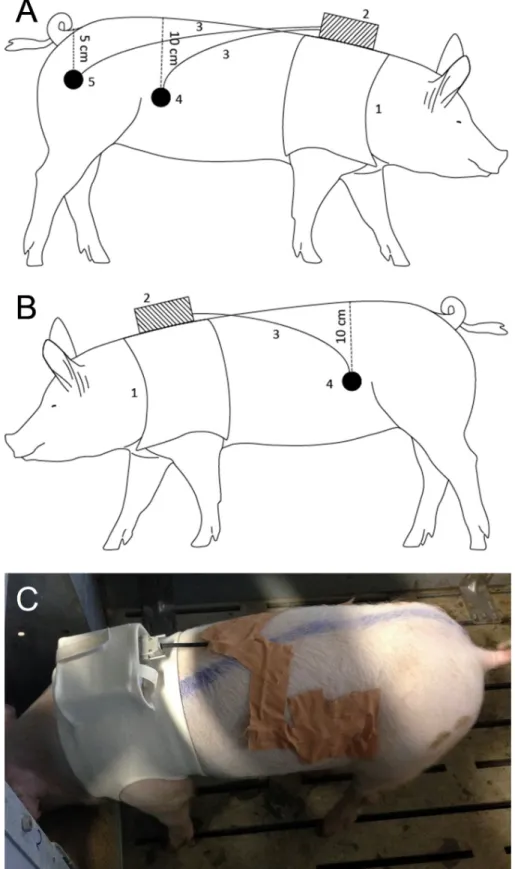
SMEMG measurements were performed on the “measuring days” (Fig 1), starting at the time of feeding (7.00 a.m. or 12.00 a.m.), and lasted for 4 hours per animal. Before the measure- ment, the epigastric area was cleaned, and the skin was gently shaved. The electrodes (Elec- trode PE Foam Solidgel, Bio Lead-Lok B Sp. Zo.o, Jo´zefo´w, Poland) were fixed onto the surface of the skin with adhesive plaster (Leukoplast 5 cm, BSN medical GmbH, Hamburg, Germany), without surgery. Ten20 EEG conductive gel (Bio-Medical Instruments, USA) was used on the skin surface to provide proper conductivity of the electrodes. The standard elec- trode pairs (2 electrodes) were fixed to the right and left sides of the abdominal wall, 10 cm lat- eral from the spine, while the neutral electrode was placed on the right thigh at a distance of 5 cm from the tail. A custom belt was designed to fix and protect the electrodes and hold the hal- ter device (MDE GmbH, Walldorf, Germany), which recorded and stored the myoelectric sig- nals (Fig 2).
The slow-wave frequency parameters of the gastric, small intestine and large intestine seg- ments of the GIT in rats identified by Szűcs et al. [18] were used in this study. The electric sig- nals were recorded and analysed with an on-line computer and amplifier of the S.P.E.L.
Fig 1. The experimental design for measuring the gastrointestinal myoelectric activity (n = 9 pigs). The diet of measuring days was identical to that of the preceding 5 days of adaptation. CTR: low level of crude fibre (29 g/kg as in feed), soybean- and maize-based feed; EXP: moderate level of crude fibre (49 g/kg as in feed), soybean- and maize-based feed + 4% Opticell (Agromed Austria GmbH, Kremsmu¨nster, Austria).
https://doi.org/10.1371/journal.pone.0257311.g001
Table 1. Ingredients and the analysed or calculated nutrient and energy content of the control and experimental diets.
Ingredient (kg) Control (CTR) Experimental (EXP)
Wheat 307.70 295.40
Maize 256.50 247.00
Barley 200.00 192.00
Extracted soybean meal (46% CP) 188.00 181.00
Pig vitamin and mineral premix1 12.50 12.50
Plant oil2 12.00 11.20
Limestone 10.50 10.05
MCP 6.50 6.20
L-lysine-HCl (78%) 4.80 4.60
DL-methionine (99%) 0.64 0.62
L-threonine (99%) 0.64 0.62
L-tryptophan (98.5%) 0.22 0.21
Fibre source3 - 38.60
Chemical composition (as in feed, %)
DM4 88.90 89.10
CP4 17.20 16.70
EE4 3.30 3.30
CF4 2.90 4.90
NDF4 11.86 14.70
ADF4 4.89 7.50
ADL4 0.73 0.70
A4 4.20 4.30
Ca5 0.66 0.64
P5 0.55 0.48
Na5 0.20 0.20
SID Lys5 1.05 1.01
SID Met+Cys5 0.66 0.64
SID Thr5 0.70 0.68
SID Trp5 0.21 0.20
DEs5(MJ/kg as in feed) 14.17 13.67
MEs5(MJ/kg as in feed) 13.60 13.12
1Supplied per kilogram of diet: vitamin A: 16,000 IU; vitamin D: 2500 IU; vitamin E: 80.0 mg; vitamin K: 2.0 mg;
thiamine: 2.0 mg; riboflavin: 6.0 mg; niacin: 30.0 mg; pantothenic acid: 14.0 mg; pyridoxine: 4.0 mg; folic acid: 1.0 mg; vitamin B12: 0.03 mg; I: 0.7 mg (calcium iodate); Se: 0.4 mg (sodium selenite); Zn: 120.0 mg (metal
polysaccharide complexes of zinc sulphate); Fe: 90.0 mg (iron(II)-carbonate); Mn: 50.0 mg (manganese sulphate); Cu:
95.0 mg (copper sulphate).
2Bonafarm-Ba´bolna Ltd., Nagyigma´nd, Hungary.
3Opticell C5 concentrated fibre source: crude fibre: 660 g/kg DM, NDF: 854 g/kg DM, ADF: 725 g/kg DM, ADL: 82 g/kg DM (Agromed Austria GmbH, Kremsmu¨nster, Austria).
4analysed (DM—dry matter; CP—crude protein; EE—ether extract; CF—crude fibre; NDF—neutral detergent fibre;
ADF—acid detergent fibre; ADL—acid detergent lignin; A = ash).
5calculated (Ca—calcium; P—total phosphorous; Na—sodium; SID Lys—standardised ileal digestible lysine; SID Met + Cys—standardised ileal digestible methionine + cysteine, SID Thr—standardised ileal digestible threonine; SID Trp
—standardised ileal digestible tryptophan; DEs—digestible energy for swine; MEs—metabolisable energy for swine).
https://doi.org/10.1371/journal.pone.0257311.t001
Fig 2. The positioning of the smooth muscle electromyography equipment on the right (A) and left (B) side of a standing animal, and a photo of the left side (C). 1: belt; 2: halter part; 3: cable for the electrode(s); 4: standard electrode; 5: neutral electrode.
https://doi.org/10.1371/journal.pone.0257311.g002
Advanced ISOSYS Data Acquisition System (MDE GmbH, Walldorf, Germany). SMEMG sig- nals were amplified using a custom-made amplifier (MDE GmbH, Walldorf, Germany). A double-filter system was used to reduce the artefacts. All analogue signals were pre-filtered with a first-order Bessel-type low-pass filter and were converted to digital signals at a sample rate of 2 Hz with a slope of 80 dB/decade. The prefiltered myoelectric signals were then filtered further by Bessel-type bandpass filters with a frequency of 0–30 cycles per minute with a slope of 140 dB/decade. Each filter was a digital infinite impulse response (IIR) filter. The recorded signals were analysed with fast Fourier transformation (FFT). The frequency of the electric activity was expressed in cycles per minutes (cpm), and the magnitude of the activity was described as the maximum power spectrum density (PsDmax). Based on Szűcs et al. [18], the electromyographic signals during FFT analysis were filtered for the following cpms: 1–3 for the large intestine, 3–5 for the stomach and 20–25 for the small intestine.
Statistical analysis
The maximum power spectrum density (PsDmax) values were determined and compared sta- tistically (t-test) using the computer program Prism 5.0. (GraphPad Software, USA). In all pro- cedures, the significance level wasP�0.05.
Results and discussion
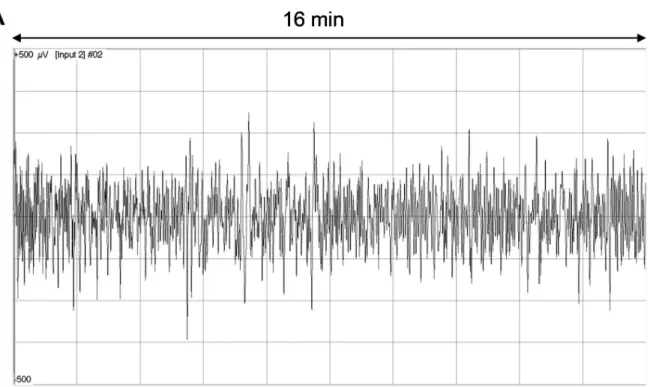
The activities of the different GI segments were detected by FFT spectrum analysis of the SMEMG records (S1 File,Fig 3A). The peaks of 1–3, 3–5 and 20–25 cpms refer to the contrac- tile responses of the large intestine, stomach and small intestine, respectively (Fig 3B). The absolute values of PsDmax(mV2) varied in the different segments of the GIT (the stomach, small intestine and large intestine) and the different feeds (CTR and EXP), indicating changes in the intensity of the GIT smooth muscle contractions.Table 2shows the results of mean val- ues of the maximum of power spectrum density (PsDmax, mV2) changes for each individual animal (pig 1–9). The means and standard deviations of the PsDmax values of the control and experimental animals (n = 9) examined in the test are shown inFig 4.
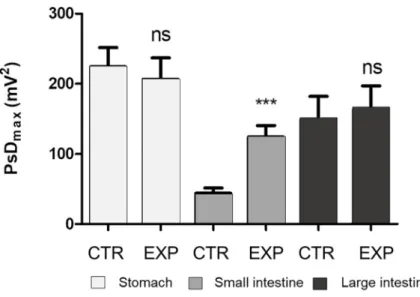
The PsDmaxmeasured when feeding the EXP diet differed from that measured when feed- ing the CTR diet by the individual animals. These changes were neither consistent nor signifi- cant in the stomach or large intestine. The PsDmax(mV2) when feeding the CTR feed varied between 101.3 (animal 6) and 350.3 (animal 1) for the stomach, between 20.4 (animal 5) and 67.2 (animal 4) for the small intestine, and between 44.0 (animal 7) and 362.9 (animal 4) for the large intestine. As a result of the EXP feed, the PsDmax(mV2) varied between 102.8 (animal 4) and 355.6 (animal 9) for the stomach, between 26.4 (animal 4) and 174.2 (animal 7) for the small intestine, and between 64.8 (animal 4) and 385.8 (animal 5) for the large intestine. A sig- nificant increase (CTR vs. EXP) in the PsDmaxvalues were found only for the small intestine in the case of all individuals (n = 9) (P�0.001) (Fig 4).
Earlier experiments demonstrated that SMEMG is reliable and feasible for use in anaesthe- tised pigs, especially for examination of the stomach (EGG) [10,21,22]. Although animal SMEMG methods are promising, it cannot be guaranteed that the recorded signals originate solely from the GI tracts. The signals contain slow and fast waves of the GIT along with
“noises”, such as respiratory and motion artefacts [23]. Many studies have highlighted that the frequencies outside the normal frequency are defined as a type of arrhythmia [24]. The possi- bility of slow-wave myoelectric signal interference, or even masking with fast-wave signals from the brain, cardiac muscle or skeletal muscle, is very high, but there is an opportunity to reduce this through the special design of the sensors [25]. There are no unequivocal data con- cerning the frequency parameters of specific myoelectric signals of the main segments of the
Fig 3. The primary myoelectric signal of the gastrointestinal tract in a non-anaesthetised, free-moving pig (A), and the specific spectra (B) gained by fast Fourier transformation (FFT) showing three dominant peaks particularly notable between 1–3, 3–5 and 20–25 cpms for the large intestine, stomach and small intestine, respectively. The heights of the peaks are the PsDmaxvalues that were compared to characterise the changes in the intensities of the given GIT segments caused by the different fibre contents of the feeds.
https://doi.org/10.1371/journal.pone.0257311.g003
GIT (the stomach, small and large intestine) for pigs; however, Tacheci et al. [22] defined the normal range for gastric myoelectric activity in anesthetised experimental pigs at 2.3–3.5 cpm.
Varayil et al. [21] also worked with anesthetised pigs but in fasting conditions and measured nor- mal dominant frequencies for the empty stomach at 3.3±0.5 cpm. The identified dominant cpms of each experiment were inside the cpm value range of the stomach obtained in our experi- ment (3.00–5.00 cpm). These values were in accordance with earlier findings in humans [26–28].
In our recent study, the same recording and analysis software as those used by Szűcs et al.
[18] in rats were adopted together with digital filters to separate the slow waves of smooth
Table 2. The effect of the control and experimental diets on the absolute value of the maximum of power spectrum density (PsDmax, mV2) in the different seg- ments of the gastrointestinal tract (n = 9 pigs).
Absolute value for PsDmax(mV2)
Stomach (3–5 cpm) Small intestine (20–25 cpm) Large intestine (1–3 cpm)
Animal No. CTR EXP CTR EXP CTR EXP
1 350.3 349.0 66.2b 153.7a 211.5 249.5
2 191.3 174.4 43.2b 163.6a 86.6 140.7
3 269.8 223.3 22.6b 133.0a 178.2 126.5
4 306.6 102.8 67.2a 26.4b 362.9 64.8
5 208.3 169.2 20.4b 168.8a 56.6 385.8
6 101.3 182.3 22.3b 121.3a 137.4 120.6
7 116.5 106.4 20.5b 174.2a 44.0 89.9
8 225.2 196.0 65.9b 92.6a 179.9 123.6
9 250.2 355.6 66.5b 82.9a 84.0 178.2
Values with different superscripts differ atP�0.001.
CTR: low level of crude fibre (29 g/kg as in feed), soybean- and maize-based feed.
EXP: moderate level of crude fibre (49 g/kg as in feed), soybean- and maize-based feed + 4% Opticell (Agromed Austria GmbH, Kremsmu¨nster, Austria).
https://doi.org/10.1371/journal.pone.0257311.t002
Fig 4. The differences of the absolute values of the maximum of power spectrum density (PsDmax, mV2) for the stomach, small intestine and large intestine caused by being fed CTR or EXP diets (n = 9 pigs). ns: non-significant difference between the PsDmaxvalues of the CTR and EXP feeding periods;���: significant (P<0.001) difference between the PsDmaxvalues of the CTR and EXP feeding periods; CTR: low level of crude fibre (29 g/kg as in feed), soybean- and maize-based feed; EXP: moderate level of crude fibre (49 g/kg as in feed), soybean- and maize-based feed + 4% Opticell (Agromed Austria GmbH, Kremsmu¨nster, Austria).
https://doi.org/10.1371/journal.pone.0257311.g004
To the best of our knowledge, there is no previous publication on SMEMG measurements performed in free-moving, awake pigs. The applicability and performance of the applied tech- nology were tested during feeding diets with different concentrations of crude fibre. While fibre-induced motility and transit time changes have been widely studied, the effect of the fibre content of a diet on the transit time in the small intestine is not clear. Wenk et al. [29] sug- gested that fibre stimulates peristaltic action, and that it also reduces the transit time in the small intestine. Similarly, as a result of being fed a high-fibre diet, the presence of bulk exerted a direct physical action in the small and large intestine, which increased the peristaltic action and stimulated propulsive colonic motility, as reported by Laplace [30] using cannulated ani- mals fed a diet with markers. Jorgensen et al. [31] reported a five- to six-fold increase in the digestive flow through the terminal ileum of pigs fed a high-fibre diet. On the other hand, van Leeuwen et al. [32] did not observe any effect of fibre on GIT activity or on the results of transit time in the small intestine.
In our study, the rat SMEMG measurement parameters were translated to pigs, and PsDmax
values for different parts of GIT were collected. The change in the maximum power spectrum density (PsDmax) of the stomach and small and large intestine was measured, which represents the change in the myoelectrical activity of the different segments of the GIT. A significant increase (P<0.001) was observed in the absolute value of the PsDmaxof the small intestine as a consequence of the elevated dietary CF level. Based on the PsDmaxvalues, the contractions of the small intestine smooth muscle were more intense when the EXP diet was fed than when the CTR diet was fed. Such a change in the motility may have an impact on the transit time;
thus, the results are in accordance with previous findings on the effect of increased fibre con- tent in pig diets [30,31].
Conclusions
A durable SMEMG device was successfully tested as a portable tool for the non-invasive moni- toring of gastrointestinal myoelectrical activity in awake, free-moving, growing pigs. The method is proven to be useful for the in vivo measurement of the altered myoelectric activity of the stomach and small and large intestine as a result of feeding diets with different fibre con- tents. The increased fibre content of the feed induced an increase in the PsDmax, indicating stronger GIT motility, especially in the small intestine. The applied method is useful to detect the influence of different feedstuffs on the GIT functions of pigs without anaesthesia.
Supporting information
S1 File. Smooth muscle electromyography records of the stomach, small intestine and large intestine of the investigated pigs (n = 9) acquired during the whole experiment (Fig 1). CTR: control, EXP: experimental, T1: beginning of analysed time interval, T2: end of ana- lysed time interval, CPM: cycle per minute, PS: power spectrum.
(XLSX)
Acknowledgments
The authors are grateful to the employees of Hungarian University of Agricultural and Life Sci- ences, Kaposva´r Campus, Institute of Animal Physiology and Nutrition, Department of
Animal Nutrition, and Sze´chenyi University, Faculty of Agricultural and Food Science, Department of Animal Nutrition for their contributions and technical support.
Author Contributions
Conceptualization: Katalin Nagy, Tama´s To´th.
Data curation: Katalin Nagy.
Formal analysis: Ro´bert Ga´spa´r, Ka´lma´n Ferenc Szűcs.
Methodology: Ro´bert Ga´spa´r, Ka´lma´n Ferenc Szűcs.
Resources: Gyo¨rgy Grosz, Tama´s To´th.
Software: Gyo¨rgy Grosz.
Supervision: Hedvig Fe´bel, Tama´s To´th.
Validation: Ro´bert Ga´spa´r, Ka´lma´n Ferenc Szűcs.
Visualization: George Bazar, Ka´lma´n Ferenc Szűcs.
Writing – original draft: Katalin Nagy.
Writing – review & editing: Katalin Nagy, Hedvig Fe´bel, George Bazar, Ro´bert Ga´spa´r, Ka´l- ma´n Ferenc Szűcs, Tama´s To´th.
References
1. Le Goff G, Noblet J. Comparative total tract digestibility of dietary energy and nutrients in growing pigs and adult sows. J Anim Sci. 2001; 79: 2418–2427.https://doi.org/10.2527/2001.7992418xPMID:
11583429
2. Lahaye L, Ganier P, Thibault JN, Sève B. Technological processes of feed manufacturing affect protein endogenous losses and amino acid availability for body protein deposition in pigs. Anim Feed Sci Tech- nol. 2004; 113: 141–156.https://doi.org/10.1016/j.anifeedsci.2003.07.005
3. Noblet J, Shi XS. Effect of body weight on digestive utilization of energy and nutrients of ingredients and diets in pigs. Livest Prod Sci. 1994; 37: 323–338.https://doi.org/10.1016/0301-6226(94)90126-0 4. Solà-Oriol D, Torrallardona D, Gasa J. Role of dietary fibre source and meal size on the ileal transit of
digesta in growing pigs. Livest Sci. 2010; 133: 67–69.https://doi.org/10.1016/j.livsci.2010.06.027 5. Sauvant D. Systematic modelling in nutrition. Reprod Nutr Dev. 1992; 32: 217–230.https://doi.org/10.
1051/rnd:19920301PMID:1449606
6. Usry J. L., Turner L. W., Stahly T. S., Bridges T. C., Gates R. S. GI tract simulation model of the growing pig. Trans ASAE. 1991; 34: 1879–1890.https://doi.org/10.13031/2013.31814
7. Bastianelli D, Sauvant D, Re´ rat A. Mathematical modeling of digestion and nutrient absorption in pigs. J Anim Sci. 1996; 74: 1873–1887.https://doi.org/10.2527/1996.7481873xPMID:8856442
8. Rivest J, Bernier JF, Pomar C. A dynamic model of protein digestion in the small intestine of pigs. J Anim Sci. 2000; 78: 328–340.https://doi.org/10.2527/2000.782328xPMID:10709923
9. Yin J, Chen JDZ. Electrogastrography: Methodology, Validation and Applications. J Neurogastroenterol Motil. 2013; 19: 5–17.https://doi.org/10.5056/jnm.2013.19.1.5PMID:23350042
10. Květina J, Kunesˇ M, Buresˇ J, Kopa´čova´ M, Tachecı´ I, Sˇ pelda S, et al. The use of wireless capsule enteroscopy in a preclinical study: a novel diagnostic tool for indomethacin-induced gastrointestinal injury in experimental pigs. Neuroendocrinol Lett. 2008; 29: 763–769. Available:www.nel.eduPMID:
18987574
11. Kopa´čova´ M, Tachecı´ I, Květina J, Buresˇ J, Kunesˇ M, Spelda S, et al. Wireless video capsule entero- scopy in preclinical studies: methodical design of its applicability in experimental pigs. Dig Dis Sci. 2010;
55: 626–630.https://doi.org/10.1007/s10620-009-0779-3PMID:19294508
12. Kunesˇ M, Květina J, Mala´kova´ J, Buresˇ J, Kopa´čova´ M, Rejchrt S. Pharmacokinetics and organ distri- bution of fluorescein in experimental pig: an input study for confocal laser endomicroscopy of the gastro- intestinal tract. Neuroendocrinol Lett. 2010; 31: 57–61. Available:www.nel.eduPMID:21187822
pigs treated with indomethacin and Escherichia coli Nissle. World J Gastroenterol. 2011; 17: 609–617.
https://doi.org/10.3748/wjg.v17.i5.609PMID:21350709
15. Bures J, Pejchal J, Kvetina J, Tichy´ A, Rejchrt S, Kunes M, et al. Morphometric analysis of the porcine gastrointestinal tract in a 10-day high-dose indomethacin administration with or without probiotic bacte- ria Escherichia coli Nissle. Hum Exp Toxicol. 2011; 30: 1955–1962.https://doi.org/10.1177/
0960327111403174PMID:21441285
16. Kararli TT. Comparison of the gastrointestinal anatomy, physiology, and biochemistry of humans and commonly used laboratory animals. Biopharm Drug Dispos. 1995; 16: 351–380.https://doi.org/10.
1002/bdd.2510160502PMID:8527686
17. Suenderhauf C, Parrott N. A physiologically based pharmacokinetic model of the minipig: data compila- tion and model implementation. Pharm Res. 2013; 30: 1–15.https://doi.org/10.1007/s11095-012-0911- 5PMID:23179779
18. Szűcs KF, Nagy A, Grosz G, Tiszai Z, Ga´spa´r R. Correlation between slow-wave myoelectric signals and mechanical contractions in the gastrointestinal tract: Advanced electromyographic method in rats. J Pharmacol Toxicol Methods. 2016; 82: 37–44.https://doi.org/10.1016/j.vascn.2016.07.005PMID:
27475721
19. Szűcs KF, Grosz G, Su¨le M, Sztojkov-Ivanov A, Ducza E, Ma´rki A, et al. Detection of stress and the effects of central nervous system depressants by gastrointestinal smooth muscle electromyography in wakeful rats. Life Sci. 2018; 205: 1–8.https://doi.org/10.1016/j.lfs.2018.05.015PMID:29746845 20. Horwitz W. Official Methods of Analysis of AOAC International. Gaithersburg, MD, USA: AOAC Inter-
national; 2006.
21. Varayil JE, Ali SM, Tachecı´ I, Květina J, Kopa´čova´ M, Kunesˇ M, et al. Electrogastrography in experi- mental pigs—Methodical design and initial experience. Folia Gastroenterol Haepatologica. 2009; 7: 98–
104. Available:http://www.pro-folia.org/files/1/2009/34/Varayil.pdf
22. Tachecı´ I, Květina J, Kunesˇ M, Pavlı´k M, Kopa´čova´ M,Černy´ V, et al. The effect of general anaesthesia on gastric myoelectric activity in experimental pigs. BMC Gastroenterol. 2013; 13: 1–6.https://doi.org/
10.1186/1471-230X-13-1PMID:23280118
23. Qin S, Ding W, Miao L, Xi N, Li H, Yang C. Signal reconstruction of the slow wave and spike potential from electrogastrogram. Biomed Mater Eng. 2015; 26: S1515–S1521.https://doi.org/10.3233/BME- 151450PMID:26405915
24. Murakami H, Matsumoto H, Ueno D, Kawai A, Ensako T, Kaida Y, et al. Current status of multichannel electrogastrography and examples of its use. J Smooth Muscle Res. 2013; 49: 78–88.https://doi.org/
10.1540/jsmr.49.78PMID:24662473
25. Prats-Boluda G, Garcia-Casado J, Martinez-de-Juan JL, Ye-Lin Y. Active concentric ring electrode for non-invasive detection of intestinal myoelectric signals. Med Eng Phys. 2011; 33: 446–455.https://doi.
org/10.1016/j.medengphy.2010.11.009PMID:21163682
26. Chen JDZ, Schirmer BD, McCallum RW. Serosal and cutaneous recordings of gastric myoelectrical activity in patients with gastroparesis. Am J Physiol—Gastrointest Liver Physiol. 1994; 266: G90–G98.
https://doi.org/10.1152/ajpgi.1994.266.1.G90PMID:8304462
27. Hocke M, Scho¨ne U, Richert H, Go¨rnert P, Keller J, Layer P, et al. Every slow-wave impulse is associ- ated with motor activity of the human stomach. Am J Physiol—Gastrointest Liver Physiol. 2009; 296:
G709–G716.https://doi.org/10.1152/ajpgi.90318.2008PMID:19095766
28. Obioha C, Erickson J, Suseela S, Hajri T, Chung E, Richards W, et al. Effect of body mass index on the sensitivity of magnetogastrogram and electrogastrogram. J Gastroenterol Hepatol Res. 2013; 2: 513–
519.https://doi.org/10.6051/j.issn.2224-3992.2013.02.244PMID:27077053
29. Wenk C. The role of dietary fibre in the digestive physiology of the pig. Anim Feed Sci Technol. 2001;
90: 21–33.https://doi.org/10.1016/S0377-8401(01)00194-8
30. Laplace JP. The transit of digesta in the different parts of the digestive tract of the pig. Prog Clin Biol Res. 1981; 77: 847–872. Available:https://agris.fao.org/agris-search/search.do?recordID=
US19830864906PMID:7335720
31. Jørgensen H, Zhao X-Q, Eggum BO. The influence of dietary fibre and environmental temoperature on the development of the gastrointestinal tract, digestibility, degree of fermentation in the hind-gut and energy metabolism in pigs. Br J Nutr. 1996; 75: 365–378.https://doi.org/10.1079/bjn19960140PMID:
8785211
32. van Leeuwen P, van Gelder A, de Leeuw J, van der Klis J. An animal model to study digesta passage in different compartments of the gastro-intestinal tract (GIT) as affected by dietary composition. Curr Nutr Food Sci. 2006; 2: 97–105. Available:https://insights.ovid.com/cnfs/200602010/01265997-200602010- 00011