This is an Accepted Manuscript, which has been through the Royal Society of Chemistry peer review process and has been accepted for publication.
Accepted Manuscripts are published online shortly after
acceptance, before technical editing, formatting and proof reading.
Using this free service, authors can make their results available to the community, in citable form, before we publish the edited article. We will replace this Accepted Manuscript with the edited and formatted Advance Article as soon as it is available.
You can find more information about Accepted Manuscripts in the Information for Authors.
Please note that technical editing may introduce minor changes to the text and/or graphics, which may alter content. The journal’s standard Terms & Conditions and the Ethical guidelines still apply. In no event shall the Royal Society of Chemistry be held responsible for any errors or omissions in this Accepted Manuscript or any consequences arising from the use of any information it contains.
Accepted Manuscript
JAAS
This article can be cited before page numbers have been issued, to do this please use: M. Bonta, H.
Lohninger, V. Laszlo, B. Hegedus and A. Limbeck, J. Anal. At. Spectrom., 2014, DOI:
10.1039/C4JA00245H.
Printed patterns on paper are presented as an alternative quantification method to matrix-matched tissue standards in LA-ICP-MS imaging experiments.
3 4 5 6 7 8 9 10 11 12 13 14 15 16 17 18 19 20 21 22 23 24 25 26 27 28 29 30 31 32 33 34 35 36 37 38 39 40 41 42 43 44 45 46 47 48 49 50 51 52 53 54 55 56 57 58 59
of Analytical Atomic Spectrometry Accepted Manuscript
Published on 29 August 2014. Downloaded on 03/09/2014 00:38:47.
Quantitative LA-ICP-MS imaging of platinum in chemotherapy treated human malignant pleural mesothelioma samples using printed patterns as standard
Maximilian Bonta1, Hans Lohninger1, Viktoria Laszlo2, Balazs Hegedus2,3, Andreas Limbeck1*
1Institute of Chemical Technologies and Analytics, Vienna University of Technology
2Department of Thoracic Surgery, Comprehensive Cancer Center, Medical University of Vienna
3MTA-SE Molecular Oncology Research Group, Hungarian Academy of Sciences, Budapest
*Corresponding author: Vienna University of Technology, Institute of Chemical Technologies and Analytics, Getreidemarkt 9/164-IAC, 1060 Vienna, Austria; Email:
andreas.limbeck@tuwien.ac.at
Abstract
LA-ICP-MS has often been applied for the analysis of trace elemental distributions in biological tissues. However, the strong matrix dependence of LA-ICP-MS analyses and highly variable matrix conditions aggravate reliable qualitative distribution analyses and thus for obtaining quantitative information elaborate quantification strategies have to be applied. In this work printed patterns on paper with gold thin-layers as pseudo-internal standard have been proposed as an alternative approach to the commonly used matrix-matched tissue standards. Besides a major reduction of the workload for standard preparation the presented method allows for compensation of instrumental drifts during measurement as well as a reduction of matrix related effects. The developed method has been verified using matrix- matched tissue standards (deviations from the actual metal content less than 5% with relative standard deviations of less than 7%) and applied to platinum imaging on human malignant pleural mesothelioma samples after administration of individuals with platinum containing cytostatic drugs.
Introduction
In clinical applications platinum containing drugs (e. g. cisplatin, carboplatin and oxaliplatin) are used to treat a large variety of cancer types. Being known since the beginning 1970s as cytostatic drugs 1-3 the mechanism of interaction during cell proliferation has been in detail described 4. However, the uptake and distribution of platinum drugs within the tumor tissue is still not fully understood. Due to major side effects of platinum containing drugs the dose
3 4 5 6 7 8 9 10 11 12 13 14 15 16 17 18 19 20 21 22 23 24 25 26 27 28 29 30 31 32 33 34 35 36 37 38 39 40 41 42 43 44 45 46 47 48 49 50 51 52 53 54 55 56 57 58 59 60
of Analytical Atomic Spectrometry Accepted Manuscript
Published on 29 August 2014. Downloaded on 03/09/2014 00:38:47.
View Article Online DOI: 10.1039/C4JA00245H
should be kept as low as possible 5 and therefore investigations on platinum uptake are of great medical value. Revealing platinum distributions in tumorous tissue of individuals treated with the aforementioned drugs can contribute to a better understanding of the processes of the therapeutic effect of these drugs. The ultra-trace capability of ICP-MS combined with laterally resolved analysis using laser ablation gives the possibility of depicting the distribution of major constituents as well as trace elements in biological tissues (bioimaging) but only a limited number of studies describe platinum distributions in tissues using LA-ICP- MS imaging after uptake of platinum containing drugs 6-9.
Due to the fact that LA-ICP-MS measurements are linked to a variety of problems concerning sample and measurement conditions even reliable qualitative analyses may need a correction of the monitored raw signals. The major concerns are compensation of instrumental drifts or matrix-related ablation differences within one sample mostly accomplished by internal standards. Often the use of sample inherent matrix elements such as carbon as internal standard has been reported in literature 10, 11. However, due to the strongly varying constitution of biological tissues even within single tissue sections the use of carbon as internal standard does not represent a suitable strategy for complete compensation of all possible changes in absolute signal intensity as changing structures within the tissue may exhibit changed carbon content. Additionally, due to the weak ionization behavior of carbon its use as internal standard does not seem to be an optimal choice. Furthermore, carbon may be transported both as particulate matter as well as in gaseous state. This may lead to altered transport behavior compared to the analytes of interest which are predominantly transported in the form of aerosol particles 12. Due to possible inhomogeneity of matrix elements leading to distortion of the resulting normalized image the use of layers applied on or beneath the sample for signal normalization has been proposed as a possible improvement for LA-ICP- MS measurements. Other approaches that recently have been proposed are additionally applied thin polymeric layers doped with metals 13 or metallic layers on the sample surface 14. The mentioned pseudo-internal standards have shown to compensate for matrix- or instrumentation-related variations in absolute signal intensity and can therefore considered being a major improvement in LA-ICP-MS imaging experiments.
Obtaining reliable quantitative information using LA-ICP-MS is a more challenging task and therefore in the past only a limited number of strategies for quantification have been described. The major problems for accurate quantification are matrix related ablation differences by the laser, varying transport efficiency of the transported material and changing
3 4 5 6 7 8 9 10 11 12 13 14 15 16 17 18 19 20 21 22 23 24 25 26 27 28 29 30 31 32 33 34 35 36 37 38 39 40 41 42 43 44 45 46 47 48 49 50 51 52 53 54 55 56 57 58 59 60
of Analytical Atomic Spectrometry Accepted Manuscript
Published on 29 August 2014. Downloaded on 03/09/2014 00:38:47.
View Article Online DOI: 10.1039/C4JA00245H
plasma conditions due to the uptake of varying sample material. Signal quantification often relies on the use of matrix-matched tissue standards. Tissues are homogenized, spiked with the elements of interest and frozen, respectively. The frozen tissue standards are cryo-cut to a few µm thick sections and the actual amount of analyte in the tissue is determined after digestion using ICP-MS 15-17. A crucial aspect in the preparation of matrix-matched standards is the homogeneity of the investigated analytes. However, the often highly variable sample conditions within single sections of the analyzed tissue are still a problem since homogenized standards cannot represent the varying tissue properties. Therefore alternative methods have been developed to overcome the limitations of matrix-matched standards and furthermore to ease the process of standard manufacturing. For example gelatin standards have been used as a replacement for matrix-matched standards 6, sol-gel standards have been produced 11 or tissues have been embedded in resins to obtain a matching of standard material and sample 18. In this work we present a novel approach for quantification of platinum in human malignant pleural mesothelioma (MPM) samples based on the use of gold layers as pseudo-internal standard in combination with printed patterns as alternative to matrix-matched standards for accurate and easy signal quantification in imaging experiments 19. Systematic optimization of the parameters has been carried out to yield best results in terms of achievable spatial resolution and measurement certainty. Using conventionally prepared matrix-matched tissue standards the validity of the proposed quantification approach was confirmed followed by an application to samples of unknown platinum content. The investigated samples are of high medical interest as MPM is a devastating malignancy with dismal prognosis and platinum based chemotherapy is the most widely used therapeutic modality 20. Unfortunately, MPM often shows therapy resistance and thus the analysis of intratumoral drug distribution is of outmost importance in this disease. However, there is no clinical data available which describe tissue platinum concentrations in MPM.
Experimental
Chemicals
For all experiments ultra pure water (resistivity 18.2 MΩ cm) dispensed from a Barnstead EASYPURE II water system (ThermoFisher Scientific, Marietta, OH) was employed. Conc.
HNO3 (p.a.), conc. HCl (p.a.) and 30% (v/v) H2O2 (p.a.) were supplied by Merck, Darmstadt, Germany. The liquid standards for ICP-MS measurements (platinum standard for ICP, 1 g L-1 in 5% (v/v) HCl and indium standard for ICP, 1 g L-1 in 5% (v/v) HNO3) were purchased
3 4 5 6 7 8 9 10 11 12 13 14 15 16 17 18 19 20 21 22 23 24 25 26 27 28 29 30 31 32 33 34 35 36 37 38 39 40 41 42 43 44 45 46 47 48 49 50 51 52 53 54 55 56 57 58 59 60
of Analytical Atomic Spectrometry Accepted Manuscript
Published on 29 August 2014. Downloaded on 03/09/2014 00:38:47.
View Article Online DOI: 10.1039/C4JA00245H
from Sigma-Aldrich, Buchs, Switzerland. For tuning of the instrument in liquid mode ‘Tune B’ solution supplied by Thermo Fisher Scientific, Bremen, Germany was employed. Printer ink for refill purposes was purchased from refill24, Vienna, Austria.
Instrumental
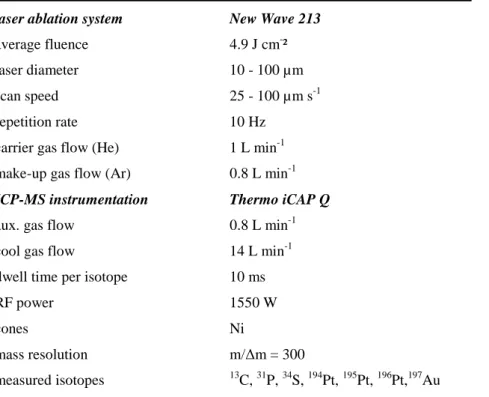
For the presented measurements quadrupole ICP-MS instrumentation (Thermo iCAP Qc, ThermoFisher Scientific, Bremen, Germany) was used. Qtegra software provided by the manufacturer was used for data acquisition. A commercially available laser ablation system (New Wave 213, ESI, Fremont, CA) with a frequency quintupled 213 nm Nd:YAG laser was employed for solid sampling experiments. The used washout cell is always held above the actual ablation site allowing for fast washout times below one second and avoiding the risk of signal distortions resulting from slowly washed out sample material. Helium was used as carrier gas for cell washout and was subsequently mixed with Argon make-up gas upon introduction into the plasma. The tune settings of the MS instrumentation were optimized using a sputtered gold layer for maximum 197Au signal prior to each experiment; typical parameters used for the measurements of solid samples are shown in Table 1.
Table 1: Typical parameters of the solid sampling experiments
laser ablation system New Wave 213
average fluence 4.9 J cm-²
laser diameter 10 - 100 µm
scan speed 25 - 100 µm s-1
repetition rate 10 Hz
carrier gas flow (He) 1 L min-1 make-up gas flow (Ar) 0.8 L min-1 ICP-MS instrumentation Thermo iCAP Q
aux. gas flow 0.8 L min-1
cool gas flow 14 L min-1
dwell time per isotope 10 ms
RF power 1550 W
cones Ni
mass resolution m/Δm = 300
measured isotopes 13C, 31P, 34S, 194Pt, 195Pt, 196Pt,197Au
The imaging experiments were carried out with laser beam diameters varying from 10 to 100 µm. For all experiments the used laser energy and firing rate were adjusted to the analyzed materials to yield complete but yet controlled ablation behaviour. The sample material was ablated using line scan patterns with adjoining lines while each line was ablated in the same
3 4 5 6 7 8 9 10 11 12 13 14 15 16 17 18 19 20 21 22 23 24 25 26 27 28 29 30 31 32 33 34 35 36 37 38 39 40 41 42 43 44 45 46 47 48 49 50 51 52 53 54 55 56 57 58 59 60
of Analytical Atomic Spectrometry Accepted Manuscript
Published on 29 August 2014. Downloaded on 03/09/2014 00:38:47.
View Article Online DOI: 10.1039/C4JA00245H
direction. Before firing the laser onto the sample surface it was allowed to warm up for 20 s.
After placing the sample in the laser ablation device the sample chamber was purged with Helium at a flow of 1 L min-1 for 20 min before measurement.
Besides three platinum isotopes (195Pt was used for data evaluation, the signals for the other isotopes were used for data verification and always showed comparable patterns) and 197Au as pseudo-internal standard the intensities of the isotopes 13C, 31P and 34S were recorded to correlate the obtained distribution information with medical knowledge and morphological structures (data not shown).
Sample introduction for ICP-MS measurements was performed employing a peltier cooled spray chamber equipped with a concentric quartz glass nebulizer; an ESI SC-2DX autosampler (Elemental Scientific, Inc., Omaha, NE) was used for automated sample introduction. The instrumental parameters were optimized for maximum 115In and signal and a
140Ce16O/140Ce ratio below 1.9% on a daily basis using a standard tuning solution. The amount of doubly charged ions was measured by the 137Ba++/137Ba+ ratio which was below 3% for all performed experiments. Measurements were carried out employing the standard measurement parameters recommended by the manufacturer.
Preparation of printed standards
For the preparation of printed patterns conventional black printer ink used for refill purposes was spiked with platinum to a final concentration of 25 mg L-1. The required amount of platinum standard solution was filled into a PE falcon tube and the solvent was allowed to evaporate using careful heating to 80°C for one hour. After complete evaporation of the solvent and cooling of the tube a defined amount of black ink was added and mixed thoroughly. Using a syringe the original inkjet cartridge was filled with the prepared platinum containing ink. Several cycles of filling and depleting the cartridge were performed to obtain uniform distribution of platinum containing ink within the cartridge.
Squares of 1 x 1 cm in black colour and print density settings ranging from 20 to 100% were designed in Microsoft PowerPoint 2007 (Microsoft Corp, Redmond, WA). The patterns were printed on high gloss photo paper (280 g m-2; Office Depot Europe B.V., Venlo, The Netherlands) using an HP deskjet 4200D office inkjet printer (Hewlett-Packard, Palo Alto, CA) equipped with the modified black cartridge at five different concentration levels. Print resolution was set to 600 x 600 dpi to obtain the highest possible lateral resolution of the printed patterns. All other printing parameters were optimized to yield optimal reproducibility
3 4 5 6 7 8 9 10 11 12 13 14 15 16 17 18 19 20 21 22 23 24 25 26 27 28 29 30 31 32 33 34 35 36 37 38 39 40 41 42 43 44 45 46 47 48 49 50 51 52 53 54 55 56 57 58 59 60
of Analytical Atomic Spectrometry Accepted Manuscript
Published on 29 August 2014. Downloaded on 03/09/2014 00:38:47.
View Article Online DOI: 10.1039/C4JA00245H
of the prints. The used patterns were all printed subsequently and with a new inkjet cartridge to avoid problems concerning reproducibility due to clogging of the print head or other technical issues.
Preparation of matrix matched standards
Matrix matched tissue standards were prepared as described by Hare et al. 13. The procedure was slightly altered to obtain maximum compatibility of the method with the used tissue types. Porcine liver, kidney and brain (Sus scofra domestica) were obtained at a local market.
After homogenization of the organs using a hand-held blender (AEG, Frankfurt am Main, Germany) 10, 20 and 40 µL of platinum standard solution for ICP (1 g L-1 Pt in 5% (v/v) HCl purchased from Sigma-Aldrich, Buchs, Switzerland) were added to three portions of 5 g of each tissue to reach nominal platinum amounts of 5, 10 and 20 µg g-1 in the homogenized tissue; the mixtures were thoroughly homogenized for optimal distribution of the standard within the tissue. One additional portion of each tissue was not spiked allowing for blank correction. The homogenized matrix-matched tissue standards each were shock-frozen by dropping amounts of approx. 100 mg into liquid nitrogen. Until further analysis the standards were stored at -70°C to prevent material degradation.
Preparation of samples for LA-ICP-MS measurements
The frozen pellets were attached to a sample holder using Shandon Cryomatrix (Thermo Scientific, Cat. No: 6769006) and 10 µm sections were cut using a cryotome (Leica CM3050 S) at -20°C. The sections were collected on Superfrost ULTRA Plus glass slides (Thermo Scientific, Cat. No:1014356145) and dried at room temperature. After attaching the tissue sections on glass slides the samples were sputtered with a thin gold layer used as pseudo- internal standard for LA-ICP-MS analysis.The coating process was performed using an Agar B7340 sputter coater (Agar Scientific Limited, Essex, UK) equipped with a gold sputtering target. Distance from sample to the gold target was adjusted to 4 cm before every sputtering process. Time required for metallization was optimized in prior experiments and kept constant for every experiment to obtain comparability of different analyses. The sputtering current was set to 10 mA and before sputtering the sample cell was evacuated to a pressure of exactly 0.1 mbar. A sputtering time of 10 s (timer controlled) was used for the prepared samples.
Reproducibility of the prepared gold layers has been demonstrated recently 19.
Pieces of the printed patterns approximately 5 x 2 mm in size were cut out using ceramic scissors to prevent for metallic contaminations and attached to microscopic glass slides using
3 4 5 6 7 8 9 10 11 12 13 14 15 16 17 18 19 20 21 22 23 24 25 26 27 28 29 30 31 32 33 34 35 36 37 38 39 40 41 42 43 44 45 46 47 48 49 50 51 52 53 54 55 56 57 58 59 60
of Analytical Atomic Spectrometry Accepted Manuscript
Published on 29 August 2014. Downloaded on 03/09/2014 00:38:47.
View Article Online DOI: 10.1039/C4JA00245H
double sided tape for LA-ICP-MS measurements. Metallization with gold thin layers was performed in the same manner as described above for the tissue samples.
Sample pretreatment for ICP-MS measurements
To accurately determine the concentrations of platinum in the tissue standards and in the printed pattern samples digestion and ICP-MS measurement of the samples was performed.
Frozen pellets of the matrix-matched tissue standards (approx. 100 mg each) were allowed to thaw, weighed and completely digested in PE sample tubes with 1 mL of conc. HNO3 and 30% H2O2 mixed in a ratio of 4:1 (v/v) in the presence of 100 µL conc. HCl to aid complexation of platinum. After a reaction time of 2 h at 40°C in an ultrasonic bath the mixture was diluted to an overall volume of 9 mL with ultra pure water resulting in clear solutions. Aliquots of 250 µL of each sample were mixed with 250 µL conc. HCl and diluted to 9 mL using 1% HNO3 to be measured using ICP-MS.
The platinum amounts on the printed patterns were determined by digesting printed squares of 1 x 1 cm in 2 mL of conc. HNO3 and 30% H2O2 mixed at a ratio of 4:1 (v/v) and 200 µL conc. HCl. Sonication at room temperature of the samples was used to aid the digestion process. After the reaction time of 2 h 500 µL conc. HCl were added to the mixture and it was diluted to an overall volume of 9 mL using ultra pure water. Aliquots of 1 mL were diluted with 1% HNO3 to 9 mL for ICP-MS measurements. The concentration determination was carried out in five replicates of sample preparation for every concentration level on the one hand to minimize errors made by sample preparation and on the other hand to demonstrate the reproducibility of the printing process. Indium standard solution was added to all measured samples for use as internal standard to a final concentration of 1 ppb. Aqueous platinum calibration standards in the range of 0.1 to 2 ppb were used for signal quantification.
Immunohistochemistry
The tissue sections were prepared from a snap frozen surgical tumor specimen. The 61 year old male MPM patient received three cycles of cisplatin-pemetrexed chemotherapy prior to the operation. The surgery was performed 26 days after the last cisplatin treatment. Informed consent was obtained from the patient and all procedures were approved by the lnstitutional Ethics Committee (EK #904/2009).
Air-dried section was washed in phosphate buffered saline (PBS), blocked with Ultra V Block solution for 10 minutes, then incubated with monoclonal mouse anti-CD34 antibody (IMGENEX; clone: ICO-115) for 1 hour at room temperature. After washing with PBS,
3 4 5 6 7 8 9 10 11 12 13 14 15 16 17 18 19 20 21 22 23 24 25 26 27 28 29 30 31 32 33 34 35 36 37 38 39 40 41 42 43 44 45 46 47 48 49 50 51 52 53 54 55 56 57 58 59 60
of Analytical Atomic Spectrometry Accepted Manuscript
Published on 29 August 2014. Downloaded on 03/09/2014 00:38:47.
View Article Online DOI: 10.1039/C4JA00245H
specific antibody binding was visualized by Ultravision LP Detection System (Thermo Scientific, Cat. No: TL-125-HL) and Liquid DAB+ Substrate Chromogen System (Dako, Cat.
No: K3468), according to the manufacturer`s instructions. The section was counterstained with Gill`s hematoxylin (Merck, Cat. No: 1051740500), dehydrated and embedded in Entellan (Merck, Cat No: 107960). Finally the slide was scanned with Tissue FAXSi plus system (Tissue Gnostics).
All optical images were made using a Leica DM2500M microscope (Leica Microsystems, Wetzlar, Germany) in reflective-light mode.
Results and discussion
Optimization of measurement conditions
To obtain high quality images using LA-ICP-MS a careful optimization of the measurement parameters is required. As described by Lear et al. 21 two crucial parameters are quadrupole dwell time and laser scan speed.
For an optimal compromise between image quality and acquisition time the scan speed employed at a certain laser beam diameter is a critical parameter. The effect of laser scan speed on image quality has been studied using a line pattern printed with platinum containing ink. The pattern consisted of five lines with 500 µm width and 500 µm spaces between the lines. Laser scan speeds of 25, 50 and 100 µm s-1 have been investigated and evaluated in terms of cell washout and related image blurring effects. A constant laser beam diameter of 50 µm was employed. Representative signal/time plots of 195Pt are summarized in Figure 1.
Interpreting the derived results it has to be considered that slight signal changes on the plateaus result from the printing process as indicated in the first row of the figure showing a microscopic image of the print pattern.
3 4 5 6 7 8 9 10 11 12 13 14 15 16 17 18 19 20 21 22 23 24 25 26 27 28 29 30 31 32 33 34 35 36 37 38 39 40 41 42 43 44 45 46 47 48 49 50 51 52 53 54 55 56 57 58 59 60
of Analytical Atomic Spectrometry Accepted Manuscript
Published on 29 August 2014. Downloaded on 03/09/2014 00:38:47.
View Article Online DOI: 10.1039/C4JA00245H
Figure 1: Printed line pattern measured with different laser scan speeds at constant laser beam diameter
The vertical dashed lines at every line series indicate the nominal width of one printed line i.e.
the distance of 500 µm covered by the laser beam in the corresponding time frame for each scan speed. The patterns at 25 and 50 µm s-1 exhibit nearly optimal correlation of the platinum peak widths with the nominal line widths whereas a scan speed of 100 µm leads to significant broadening of the printed line. Considering this line being a feature in a real sample it would appear larger than it actually is. Furthermore the platinum signal does not decrease to background level between the printed lines as it does at 25 and 50 µm s-1. This fact may lead to wrongly assumed concentrations and blurred images. Considering the blurring effect due to the cell washout time and the ‘broadening’ of actual features a scan speed of 50 µm s-1 seems to be the most appropriate corresponding to a 1:1 ratio of laser beam diameter and scan speed for other laser beam diameters. Lower scan speeds than 50 µm s-1 do not seem reasonable due to longer measurement time and no major improvement of the resulting data quality.
3 4 5 6 7 8 9 10 11 12 13 14 15 16 17 18 19 20 21 22 23 24 25 26 27 28 29 30 31 32 33 34 35 36 37 38 39 40 41 42 43 44 45 46 47 48 49 50 51 52 53 54 55 56 57 58 59 60
of Analytical Atomic Spectrometry Accepted Manuscript
Published on 29 August 2014. Downloaded on 03/09/2014 00:38:47.
View Article Online DOI: 10.1039/C4JA00245H
The second crucial parameter for image quality and reliability of the obtained data is the quadrupole dwell time. Shorter quadrupole dwell times will lead to an increased number of acquired data points per pixel in an image; on the other hand longer dwell times will cause better signal stability. Therefore the optimal dwell time needed to be evaluated for the performed experiments. For critical assessment of the quadrupole dwell time a printed area on paper with platinum containing ink was employed; for each evaluated dwell time five lines of 60 s in length were measured. A laser scan speed of 50 µm s-1 at 50 µm laser beam diameter was used for the experiments. For evaluation of the optimal quadrupole dwell time the relative standard deviation (RSD) of the absolute signal intensities during one second were calculated as the signal acquired during one second would be averaged for image construction.
Minimizing the signal RSDs will result in an increased reliability of the resulting data and thus allow to even differentiate between regions with similar intensity; at higher RSDs the signal intensity of one measured point may not be significantly different from the one of another point even if the measured averages may suggest so. At dwell times from 1 to 50 ms the relative standard deviation (RSD) of the absolute signal for 195Pt was calculated. The average signal RSDs varied between 31.1% for 1 ms dwell time and 16.6% for 10 ms dwell time with standard deviations of the mean values between 1.0 and 1.5% (n=60). Dwell times below and higher than 10 ms exhibited higher signal RSDs than the minimum value at 10 ms.
Lower dwell times offer more data points per second but higher RSDs due to increased fluctuations in signal acquisition and at higher dwell times the number of data points acquired during the evaluation time of one second is decreased again resulting in higher RSD values.
At 10 ms dwell time the number of data points acquired for every of the seven isotopes is 12 being a sufficient value for good statistical significance of the calculated averages as in the final image one second of acquired signal will be averaged for every pixel value.
Calibrations for signal quantification using the printed patterns on paper
Application of the printed pattern approach for signal quantification requires knowledge of the amount of deposited platinum on the printed patterns. As the actual amount of deposited ink on the printed patterns is unknown the platinum concentrations had to be determined via acid digestion of the patterns and ICP-MS measurement of the derived solutions. As platinum is only deposited on the surface of the print patterns the concentration of platinum cannot be determined as a mass per mass concentration (µg g-1). The alternative notation of the platinum concentration being suitable for the printed patterns is mass per area (ng cm-2).
3 4 5 6 7 8 9 10 11 12 13 14 15 16 17 18 19 20 21 22 23 24 25 26 27 28 29 30 31 32 33 34 35 36 37 38 39 40 41 42 43 44 45 46 47 48 49 50 51 52 53 54 55 56 57 58 59 60
of Analytical Atomic Spectrometry Accepted Manuscript
Published on 29 August 2014. Downloaded on 03/09/2014 00:38:47.
View Article Online DOI: 10.1039/C4JA00245H
The liquid determination of deposited platinum on the printed patterns showed low relative standard deviations of less than 5% for each concentration level. Considering that this value also reflects variations from sample preparation and ICP-MS measurement the low variance of the repetitive sample measurements indicates a good reproducibility of the printing process.
Thus, also equality of the ink deposition on the different patterns can be declared and the concentration determined by ICP-MS measurements will be representative for the solid sampling measurements. The obtained signal intensities were between 100,000 and 1,000,000 cps for the lowest to the highest concentration level with a platinum signal of around 400 cps for blank samples resulting in a limit of detection (LOD) of 2 ng L-1 in the solutions and 0.01 ng cm-2 on the printed patterns, respectively. The derived concentrations for the printed standards were between 2 and 20 ng cm-2 platinum on the patterns.
The signals obtained from the LA-ICP-MS analysis of the same print patterns should correlate linearly with the concentrations of platinum determined using ICP-MS. For the measurements of the printed standards a laser energy setting of 50% at 50 µm laser beam diameter, 50 µm s-1 scan speed and a repetition rate of 10 Hz were applied to ensure controlled ablation behavior as well as complete ablation of the applied ink. As platinum is only contained in the ink and not in the paper not the whole sample material needed to be ablated to reach quantitative results. To ensure that all platinum containing material had been ablated in the first ablation cycle the pattern was ablated a second time on the same position resulting in platinum signals at baseline level for all monitored platinum isotopes. To overcome instrumental drifts, matrix related ablation differences and day-to-day signal variations normalization of the analyte signals to the pseudo-internal standard gold was applied. The raw signal for 195Pt was between 5,000 and 50,000 cps for the standards printed on paper with 200 cps for the background signal resulting in a normalized signal of 0.001 and 0.01 units, respectively. The average normalized platinum concentrations showed a RSD below 5% (n=5) for every concentration level resulting in statistically significant differences between the signals of the different concentrations. A linear regression with the 195Pt signals normalized to the 197Au signals obtained from five replicate measurements and the platinum amount per area of the printed patterns was obtained (R²=0.9996). The calibration function has a negligible offset on the y- axis underlining the quality of the calibration.
Characterization of matrix-matched tissue standards
The applicability of the proposed quantification method using printed patterns was verified using in-house prepared matrix-matched standards of three different tissue types (porcine
3 4 5 6 7 8 9 10 11 12 13 14 15 16 17 18 19 20 21 22 23 24 25 26 27 28 29 30 31 32 33 34 35 36 37 38 39 40 41 42 43 44 45 46 47 48 49 50 51 52 53 54 55 56 57 58 59 60
of Analytical Atomic Spectrometry Accepted Manuscript
Published on 29 August 2014. Downloaded on 03/09/2014 00:38:47.
View Article Online DOI: 10.1039/C4JA00245H
brain, liver and kidney) exhibiting distinct differences in their composition and tissue properties.
Before LA-ICP-MS measurements the exact concentration of platinum in the prepared liver, brain and kidney tissue samples was determined using ICP-MS. The measurements were carried out in five separately prepared replicates for every concentration level to minimize variations due to sample preparation and measurement uncertainty. The observed signals were in the order of 400 cps for non spiked blank samples and between 200,000 and 2,000,000 for all tissue digests. Signal quantification was performed using external calibration with aqueous standards resulting in a LOD of 2.0 ng L-1 in the liquid samples and 1.6 ng g-1 in the matrix- matched tissues. The relatively small relative standard deviations of the replicates less than 4.1% for every sample state that not only the sample preparation was very reproducible but also that the homogeneity of the bulk concentrations is sufficient. The concentrations determined for the matrix-matched standards are in good agreement with the expected platinum concentrations in the real samples 6 ranging from 3.09 µg g-1 for the lowest to 27.14 µg g-1 for the highest platinum concentration.
Furthermore, homogenous distribution of the questioned analytes within the material is imperative to ensure that the results of laser ablation measurements are representative for the bulk concentration in the tissue samples. To prove the equal distribution of platinum on single slices of the matrix-matched tissue spot measurements were performed. A pattern consisting of nine neighboring spots with 50 µm laser beam diameter was measured on five positions distributed across the whole tissue slice. Dwell time per spot was 2 s to ensure complete ablation of the sample material. A firing rate of 10 Hz and a laser energy setting of 50% were chosen for the measurements. The patterns were placed nearby the left, right, upper and lower edge and in the middle of the tissue slice, respectively to yield information about the distribution of platinum.
To test if the distribution of platinum was even on the whole tissue section the average signals of the nine spots on each of the five different locations across the tissue slice were compared using one-way ANOVA (analysis of variances). Statistical analyses were carried out using the software package DataLab (v.3.530, Epina GmbH, Pressbaum, Austria). 22 Slices of all different tissue types and at the three chosen concentration levels were tested; the ANOVA for each of the nine data sets (three tissue types with three concentration levels each) do not indicate a significant difference between the compared means at a 95% level of significance.
Prior to ANOVA Levene’s test (p < 0.2) was used to check for homogeneity and equality of
3 4 5 6 7 8 9 10 11 12 13 14 15 16 17 18 19 20 21 22 23 24 25 26 27 28 29 30 31 32 33 34 35 36 37 38 39 40 41 42 43 44 45 46 47 48 49 50 51 52 53 54 55 56 57 58 59 60
of Analytical Atomic Spectrometry Accepted Manuscript
Published on 29 August 2014. Downloaded on 03/09/2014 00:38:47.
View Article Online DOI: 10.1039/C4JA00245H
variances of each processed data set as a prerequisite for ANOVA. Results of the statistical analyses indicate that the platinum distribution within one slice is homogenous. Furthermore gold normalization did not show to affect the results of the statistical analyses proving that also the gold deposition within one sample is homogenous.
In addition to the measurements on one tissue slice the equality of the platinum signals on consecutive tissue slices was tested. Not only can the homogeneity of the platinum distribution within the tissue but also possibly differing sample thicknesses be investigated using this experiment. Patterns of nine single spots with the same laser settings as described before were drawn on four different tissue slices of the same tissue and the same bulk concentration each. 195Pt as well as the gold normalized platinum signal was considered for data analysis. The mean values for every tissue slice were also compared using one-way ANOVA as described above. The statistical analysis does not indicate a difference in the four means in each of the three concentration levels and three tissue types at a 95% level of significance for both normalized and non-normalized data. The results of the statistical analysis point out that the platinum distribution on different tissue sections does not differ with any statistical significance.
Measuring tissue slices using LA-ICP-MS the results are in a mass per area unit when using the printed pattern calibration approach for signal quantification. To compare the concentrations determined by LA-ICP-MS with the bulk concentrations of platinum in the tissues the units need to be converted. Using the density of the investigated tissues the mass per area concentration of platinum on the printed patterns standards can be changed into a mass per mass concentration for the tissue slices at a known tissue thickness. The density of the matrix matched tissue standards was determined based on the protocol by DiResta et al. 23 using a pycnometric method. The determined densities are 1.0505 ± 0.0036 g cm-3 for kidney, 1.0220 ± 0.0109 g cm-3 for liver and 0.9508 ± 0.0152 g cm-3 for brain.
Variation of the laser beam diameter for investigation of the effect of altered plasma load to the platinum signal
Varying material intake and changing particle size distributions in the plasma may change ionization efficiency of the analytes 24. Higher matrix load of the plasma can potentially lead to delayed ionization resulting in effectively decreased analyte detection. To investigate the applicability of this effect on the investigated tissue samples matrix-matched liver tissue has been analyzed applying different laser beam diameters. Six different laser beam diameters ranging from 10 to 100 µm have been used and the platinum signal as well as the gold signal
3 4 5 6 7 8 9 10 11 12 13 14 15 16 17 18 19 20 21 22 23 24 25 26 27 28 29 30 31 32 33 34 35 36 37 38 39 40 41 42 43 44 45 46 47 48 49 50 51 52 53 54 55 56 57 58 59 60
of Analytical Atomic Spectrometry Accepted Manuscript
Published on 29 August 2014. Downloaded on 03/09/2014 00:38:47.
View Article Online DOI: 10.1039/C4JA00245H
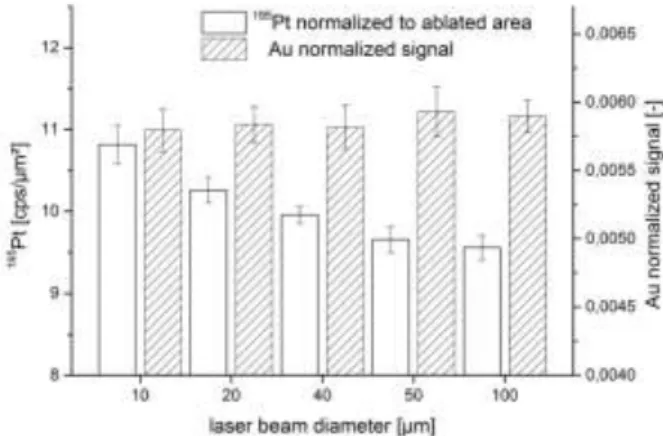
has been recorded for data evaluation. The expected outcome is that with an increased laser beam diameter the detected signal should constantly increase due to a higher amount of analyte transported into the plasma. Normalizing the raw platinum signal to the ablated area should result in equal analyte signals when no effects of the altered plasma load to the ionization behavior would appear. Figure 2 shows the platinum raw signals normalized to the ablated area. Due to matrix effects linked with the aforementioned delayed ionization of the analytes the area normalized platinum signal decreases. The same effect of decreasing signal is reflected in the area normalized signal of the sputtered gold layer. As a consequence, when normalizing the platinum to the gold signal the differences between the laser beam diameters are reduced as the ionization of platinum and gold as pseudo-internal standard have shown to be affected in the same manner by the described matrix effects.
Figure 2: Platinum raw signals normalized to the ablated area and gold normalized platinum signals on platinum spiked liver measured with different laser beam diameters
The results underline the suitability of gold thin layers for signal normalization showing that gold normalization can compensate changed ionization behavior due to altered material intake into the plasma. Furthermore it could be shown that laser beam diameters can be easily varied in a certain range without needing new calibrations for more flexible analyses in terms of accessible lateral resolutions.
Applicability of printed patterns for signal quantification on matrix-matched tissue standards
To test the applicability of the printed pattern approach to tissue samples the set of matrix- matched standards characterized before was analyzed using LA-ICP-MS and quantified using the printed pattern calibration. The signals of three adjacent lines each 2 mm in length were averaged for signal quantification to reduce the effect of random signal fluctuations. For each
3 4 5 6 7 8 9 10 11 12 13 14 15 16 17 18 19 20 21 22 23 24 25 26 27 28 29 30 31 32 33 34 35 36 37 38 39 40 41 42 43 44 45 46 47 48 49 50 51 52 53 54 55 56 57 58 59 60
of Analytical Atomic Spectrometry Accepted Manuscript
Published on 29 August 2014. Downloaded on 03/09/2014 00:38:47.
View Article Online DOI: 10.1039/C4JA00245H
concentration level and tissue type the described line patterns were measured on three different positions on the tissue to calculate a measurement uncertainty.
Calculating regressions from the platinum intensities before gold normalization showed that the slopes for the three tissue types varied significantly between 863.4 arbitrary units for brain over 706.3 arbitrary units for kidney to 494.1 arbitrary units for liver indicating large matrix differences between the tissue types. After gold normalization the slopes have comparable values not differing in more than 5% from their mean value. Thus, the effectiveness of gold layers as pseudo-internal standard is proved. Gold has thereby shown to compensate not only matrix related ionization differences (see previous item) but also ablation and transport related alterations in absolute signal intensity derived from changed matrix conditions.
Using the regression function obtained from the measurement of the printed pattern calibration amount-per-area concentrations of platinum on the tissue slices were calculated.
Derived findings were in the order of 3 to 30 ng cm-2.
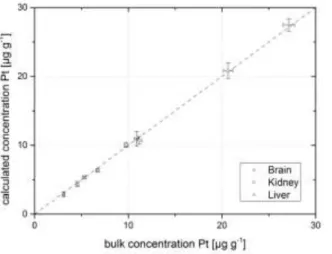
Using the determined material densities of the matrix-matched standards an amount-per-mass concentration was calculated using the known tissue thickness of 10 µm. The calculated concentrations in the non spiked tissue samples were always below the limit of detection of 0.1 µg g-1. The determined bulk concentrations were found in the range between 2.9 and 27.5 µg g-1 with good relative standard deviations around 5% for three replicate measurements of every sample. A comparison of the bulk values determined by ICP-MS and the values determined by laser ablation measurements is presented in Figure 3 demonstrating the applicability of the proposed quantification method for tissue samples with unknown platinum concentration.
Figure 3: Comparison of platinum bulk concentrations and results from LA measurements with quantification from 3
4 5 6 7 8 9 10 11 12 13 14 15 16 17 18 19 20 21 22 23 24 25 26 27 28 29 30 31 32 33 34 35 36 37 38 39 40 41 42 43 44 45 46 47 48 49 50 51 52 53 54 55 56 57 58 59 60
of Analytical Atomic Spectrometry Accepted Manuscript
Published on 29 August 2014. Downloaded on 03/09/2014 00:38:47.
View Article Online DOI: 10.1039/C4JA00245H
Measurement of human malignant pleural mesothelioma tissue sections
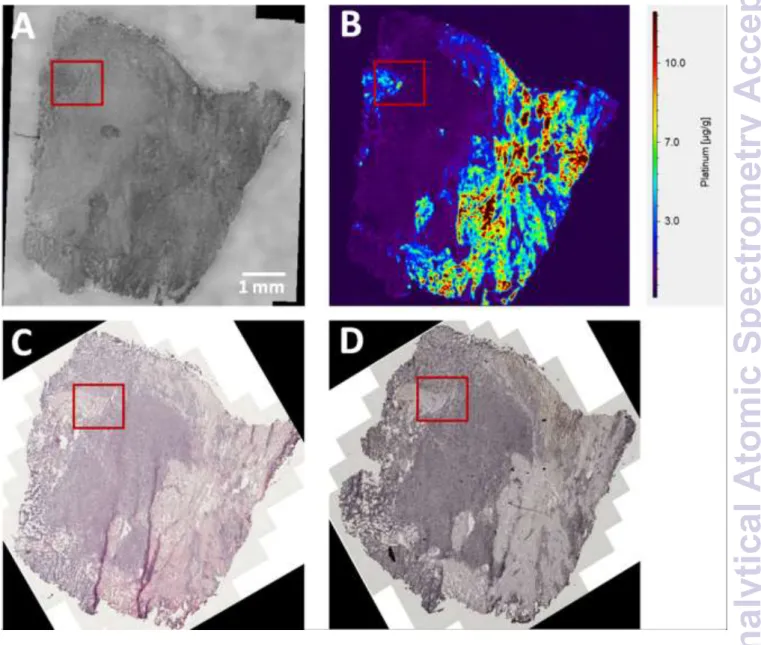
Imaging of the human malignant pleural mesothelioma sections was performed using a laser beam diameter of 40 µm to increase the obtained lateral resolution of the resulting image. A scan speed of 40 µm s-1 was chosen to keep the scan speed at an equal value as the laser beam diameter; ImageLab 25 (v.0.40, Epina GmbH, Pressbaum, Austria) was used for image processing. Figure 4 shows the analyzed tissue section with images of consecutively cut sections after immunohistochemical staining.
Figure 4: The analyzed MPM tissue section. (A) Light microscopy image of the LA-ICP-MS analyzed section prior to the measurement. (B) The quantitative platinum distribution based on the printed pattern calibration. (C) A consecutive section stained with hematoxylin and eosin. (D) The next section was stained for blood vessels (anti-CD34 antibody) and counterstained with hematoxylin. Note the similar overall tissue structure in the consecutive sections that makes possible the accurate alignment of sections with different imaging information. The area magnified in Figure 5 is marked in the images.
3 4 5 6 7 8 9 10 11 12 13 14 15 16 17 18 19 20 21 22 23 24 25 26 27 28 29 30 31 32 33 34 35 36 37 38 39 40 41 42 43 44 45 46 47 48 49 50 51 52 53 54 55 56 57 58 59 60
of Analytical Atomic Spectrometry Accepted Manuscript
Published on 29 August 2014. Downloaded on 03/09/2014 00:38:47.
View Article Online DOI: 10.1039/C4JA00245H
In the image differences of the platinum concentration of more than one order of magnitude can be identified. While some areas of the tissue section exhibit only platinum concentrations of below 1 µg g-1 on other areas more than 10 µg g-1 of platinum in the tissue can be found.
The patterns of the platinum distribution correlate well with the results from the staining. In order to correlate the obtained platinum distribution with the intratumoral heterogeneity of blood vessel density and with the distribution of viable tumor cells a higher magnification area is presented in Figure 5.
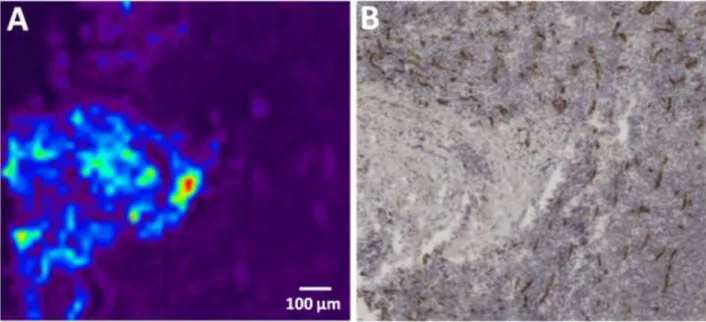
Figure 5: Magnification of the marked area in Figure 4 for intratumoral distribution analysis of platinum and tumor vasculature. (A) The high lateral resolution of platinum imaging provides the opportunity to characterize the platinum concentrations in small clusters of cells. (B) Note the same area in the CD31 labeled and hematoxylin counterstained high magnification microscopy field.
The high platinum concentration overlaps with the regions where there no viable tumor cells left. In contrast viable tumor cell (blue nuclei) and blood vessel (brown stain) rich regions do not contain any platinum.
Our initial comparative analysis of platinum distribution and immunohistochemical markers in MPM tissue sections demonstrates that the proposed methodology is robust enough to investigate the high resolution intratumoral heterogeneities in biological parameters and platinum concentrations. This is a pivotal step in understanding the parameters that influence therapeutic sensitivity of MPM tumors in platinum based chemotherapy.
Conclusions
3 4 5 6 7 8 9 10 11 12 13 14 15 16 17 18 19 20 21 22 23 24 25 26 27 28 29 30 31 32 33 34 35 36 37 38 39 40 41 42 43 44 45 46 47 48 49 50 51 52 53 54 55 56 57 58 59 60
of Analytical Atomic Spectrometry Accepted Manuscript
Published on 29 August 2014. Downloaded on 03/09/2014 00:38:47.
View Article Online DOI: 10.1039/C4JA00245H