Application of BisANS fluorescent dye for developing a novel protein assay
Zsolt DatkiID1‡*, Zita Olah1‡, Lilla MacsaiID1, Magdolna Pakaski1, Bence Galik2, Gabor Mihaly1, Janos Kalman1
1 Department of Psychiatry, Faculty of Medicine, University of Szeged, Szeged, Hungary, 2 Department of Clinical Molecular Biology, Medical University of Bialystok, Bialystok, Poland
‡ These authors are co-first authors on this work.
*datkizsolt@gmail.com,datki.zsolt@med.u-szeged.hu
Abstract
In many biology- and chemistry-related research fields and experiments the quantification of the peptide and/or protein concentration in samples are essential. Every research environ- ment has unique requirements, e.g. metal ions, incubation times, photostability, pH, prote- ase inhibitors, chelators, detergents, etc. A new protein assay may be adequate in different experiments beyond or instead of the well-known standard protocols (e.g. Qubit, Bradford or bicinchoninic acid) in related conceptions. Based on our previous studies, we developed a novel protein assay applying the 4,40-Dianilino-1,10-binaphthyl-5,50-disulfonic acid dipotas- sium salt (BisANS) fluorescent dye. This molecule has several advantageous properties related to protein detection: good solubility in water, high photostability at adequate pH, quick interaction kinetics (within seconds) with proteins and no exclusionary sensitivity to the chelator, detergent and inhibitor ingredients. The protocol described in this work is highly sensitive in a large spectrum to detect protein (100-fold diluted samples) concentrations (from 0.28 up to more than 100μg/mL). The BisANS protein assay is valid and applicable for quantification of the amount of protein in different biological and/or chemical samples.
Introduction
Accurate peptide and/or protein quantification is essential in a multitude of research topics.
Different methods were developed to measure the amount of proteins originating from various types of biological samples. A majority of them are fluorescence- (e.g. Qubit) or absorbance- based assays, such as the traditional Coomassie blue G-250 dye-binding [1] (Bradford) and the bicinchoninic acid (BCA) [2] assay. Both the Bradford and the BCA assays are based on color change in the visible spectrum as a response to the presence of proteins. The color formation observed in the Bradford assay is a result of complex formation between proteins and the Coo- massie blue G-250 dye through electrostatic and hydrophobic interactions, where the anionic blue form of the dye is stabilized and could be measured [3]. The BCA assay is based on the reduction of Cu2+to Cu1+by protein in an alkaline medium. Cu1+forms a complex with BCA, resulting a colored water-soluble chelate [2]. The intensity of the color change by these assays a1111111111
a1111111111 a1111111111 a1111111111 a1111111111
OPEN ACCESS
Citation: Datki Z, Olah Z, Macsai L, Pakaski M, Galik B, Mihaly G, et al. (2019) Application of BisANS fluorescent dye for developing a novel protein assay. PLoS ONE 14(4): e0215863.https://
doi.org/10.1371/journal.pone.0215863 Editor: Aldrin V. Gomes, University of California, Davis, UNITED STATES
Received: December 18, 2018 Accepted: April 9, 2019 Published: April 19, 2019
Copyright:©2019 Datki et al. This is an open access article distributed under the terms of the Creative Commons Attribution License, which permits unrestricted use, distribution, and reproduction in any medium, provided the original author and source are credited.
Data Availability Statement: All relevant data are within the manuscript and its Supporting Information files.
Funding: This research was supported by the European Union and the State of Hungary, co- financed by the European Social Fund in the framework of EFOP-3.6.1-16-2016-00008 to ZD and JK. The funders had no role in study design, data collection and analysis, decision to publish, or preparation of the manuscript.
Competing interests: The authors have declared that no competing interests exist.
is measured by absorbance photometry at 595 nm and 562 nm for the Bradford and BCA assays respectively [4]. Both methods allow the detection of proteins inμg/mL range. However, every assay has its own specific limitation and unique requirements (different incubation times, stabilizations, metal ions, pH, photosensitivity, chelator- and detergent sensitivity) [5].
Several different fluorescent dyes are capable of measuring total protein content like 3- (4-carboxybenzoyl)quinoline-2-carboxaldehyde (CBQCA). Moreover, the CBQCA is well suited for accurate quantitation in the presence of lipids, membrane fractions and for lipopro- teins and small peptides [6]. Based on their applications and high sensitivity standardized assays are commercially available. Other fluorescent dyes, such as 8-Anilino-1-naphthalenesul- fonic acid and its dimeric analogue 4,40-Dianilino-1,10-binaphthyl-5,50-disulfonic acid dipotas- sium salt (BisANS) are applied in various fields of protein analysis e.g. to assess surface hydrophobicity [7]; to probe active sites of enzymes [8]; to monitor unfolding and refolding processes [9]; to characterize neurodegenerative-related protein aggregates formation [10–11]
or fibrillation [12] and to monitor tubulin assembly [13]. Fu et al. (2005) [14] revealed a chap- erone-like activity for BisANS in preventing protein aggregation and in partially attenuating the heat-inactivation of enzymes. In our previous study we described a novel application of BisANS, which is capable of labelling damaged live/degenerated neurons and neuroblastoma cells [15]. Additionally, we usedin vivodetection of exogenic peptide aggregates (e.g. beta- amyloid) in an invertebrate bdelloid rotifer model [16].
The fluorescence properties of BisANS strongly depend on its interaction with protein mol- ecules similar to other protein specific dyes [17], causing changes of polarity and viscosity of the environment [18]. This non-covalent dye binds to non-specifically at multiple sites of many proteins [19] through its hydrophobic and electrostatic interactions [18]. The main advantages of BisANS are the high fluorescent intensity and great sensitivity, since it lacks an aspecific background resulted by different wavelength ranges of excitation (380–410 nm) and emission (510–530 nm) [15]. All these characteristics of the dye enable the application of the BisANS in a greater variety of protein research.
Thus, our aim was to develop a novel, fluorescence-based protein quantification method with applying BisANS dye in absence or in presence of chelator, detergent and protease inhibitors.
Material and methods Protein preparations
In order to validate our novel protein assay, different protein samples were used. The samples and the BisANS dye (Sigma-Aldrich, MO, USA) were dissolved in distilled water (DW; Milli- pore type, ultra-pure, demineralized) based calcium and magnesium free basic medium (con- tent in mM: NaCl 115, KCl 3, HEPES 25, D-Glucose 10, pH 6.5; ingredients were obtained from Sigma-Aldrich, MO, USA). We tested a pure protein (bovine serum albumin, BSA;
Sigma-Aldrich, MO, USA) and a complex blood sample without isolation (newborn calf serum; NCS; Sigma-Aldrich, MO, USA;Fig 1) or samples derived from a bdelloid rotifer and yeast. They were isolated in lysis buffer, where the basic medium was supplemented with the chelator ethylenediaminetetraacetic acid (EDTA, 2 mM; Sigma-Aldrich, MO, USA), the deter- gent sodium dodecyl sulfate (SDS, 0.2%; Aldrich, MO, USA) and inhibitors (10μM/mL leu- peptin hydrochloride and 1μg/mL pepstatin A; Sigma-Aldrich, MO, USA) in order to test the tolerance of our assay (Fig 2). The source of protein was the bdelloid rotifer and yeast samples.
The isolation steps were the following: the intact animals or the yeast cells were centrifuged at 3000 x g, at room temperature for 10 minutes. The supernatants were discarded, and the pellets were resuspended in lysis buffer (2x10⁵animals/ mL or 106yeast cells/mL). The samples were
frozen to -75˚C for 60 minutes. After thawing, they were ultrasonicated (45 Hz, Emmi-40 HC, EMAG AG, Mo¨rfelden-Walldorf, Germany) for 10 minutes. The isolates were centrifuged at 1500 x g for 5 minutes to eliminate the exoskeletons or cell debris from the homogenates. The BSA stock solution (10 mg/mL) was diluted by basic medium (Fig 1) or lysis buffer (Fig 2) to set up the calibration curves. The concentrations were from 1 to 10 mg/mL, with 1 respective unit steps (n = 3 wells per each dose, triplicated). According to the current ethical regulations, no specific ethical permission was needed. Our experiments were carried out in accordance with globally accepted norms: Animals (Scientific Procedures) Act, 1986, associated guidelines,
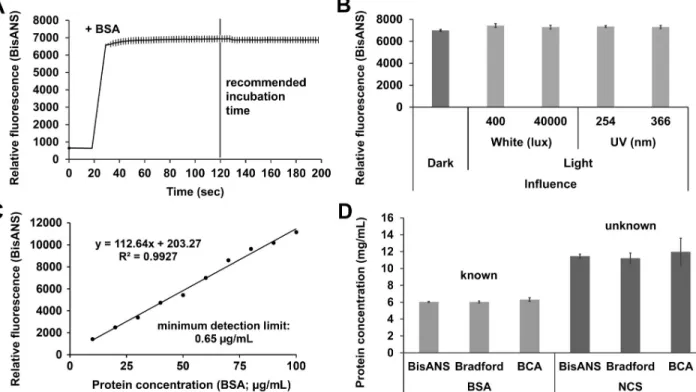
Fig 1. Characterization, application and validation of BisANS assay in basic medium. (A) Saturation curve of fluorescent signal after BisANS–BSA interaction. (B) Stability and protein binding capability of BisANS after various light influences. (C) Calibration curve formed by gradual BSA doses detected by BisANS. (D) Application and validation of BisANS-based assay to measure known (BSA) and unknown (NCS) protein concentrations. The mean is presented and the error bars show the S.E.M. For statistical analysis, one-way ANOVA was used followed by the Bonferronipost hoctest.
https://doi.org/10.1371/journal.pone.0215863.g001
Fig 2. Application and validation of the BisANS assay on protein samples prepared and isolated in lysis buffer. (A) Calibration curve formed by gradual BSA doses (dissolved in lysis buffer) detected by BisANS. (B) Application of BisANS assay simultaneously with Qubit assay on isolated protein samples from a bdelloid rotifer or yeast. The means are presented by the columns and the error bars show the S.E.M. For statistical analysis, one-way ANOVA was used followed by the Bonferronipost hoctest.
https://doi.org/10.1371/journal.pone.0215863.g002
EU Directive 2010/63/EU for animal experiments, and the National Institutes of Health guide for the care and use of Laboratory animals (NIH Publications No. 8023, revised 1978). Animal studies comply with the ARRIVE guidelines. The BSA solutions were ultrasonicated for 10 minutes to dissolve the coagulations. In all protein assays the respective medium was used as a blank and the BisANS in itself served as the unspecific background. In all cases 0.5μL of pro- tein samples were added to the each well where the working volume was 50μL/well (1:100 dilution). Measurements were carried out in a 96-well microplate with half-area (Cornig Inc., NY, USA).
BisANS assay
The BisANS was diluted in basic medium (pH 6.5), the working concentration was 50μM, using BMG NOVOstar plate reader (BMG Labtech, Ortenberg, Germany). The extinction/
emission was 405/520 nm and the number of flash per well and cycle was 30. Orbital shaking was applied before the first cycle, the shaking time was 3 sec and the plate-rounds per minutes were 600. The gain adjustment was set to both medium and dye background. The medium readings were normalized to the dye background, and they were averaged with the dye read- ings. During the saturation measurement (Fig 1A) and the light influence tests (Fig 1B) 6 mg/
mL BSA stock solution was used (n = 18 wells, respectively). The saturation was recorded for 200 sec. After 20 sec background recording, 0.5μL BSA stock solution was added automatically by the plate reader-inserted pipettor and the final volume of protein-dye content was 50μL per well. To determine the light stability of BisANS, different aliquots (50μM) in 0.2 mL PCR tubes (Thermo Fisher Scientific, MA, USA) were illuminated by various intensity of light for five minutes before the measurements. We tested white (400 and 40,000 lux) and UV light (254 and 366 nm). Based on the results of saturation experiments, 6 mg/mL BSA solution was measured after 2 minutes at room temperature incubation in darkness. The light stability mea- surements were recorded and calculated similarly to the elements of the calibration curve (Fig 1C). To validate our assay 6 mg/mL BSA solution (n = 12 wells) and NCS (n = 12 wells) were determined by BisANS assay parallel with Bradford and BCA assays (Fig 1D).
Bradford assay
The commercially available Bradford reagent (Sigma-Aldrich, MO, USA) was used in 1:5 dilution with basic medium (Fig 1D). The plate was incubated in darkness for 30 minutes; the colorimet- ric change was detected by microplate reader (SpectraMax Plus 384, Molecular Devices, LLC., CA, USA) set at 592 nm. The readings were normalized to the Bradford reagent background.
BCA protein assay
The commercially obtainable BCA Protein Assay kit [20] (Merck & Co., Inc., NJ, USA) was used (Fig 1D). The protocol given by the manufacturer was followed. Briefly, 4% cupric sul- phate was diluted by 20-fold in BCA Solution (BCA, sodium carbonate, sodium tartrate, and sodium bicarbonate with 0.1 M NaOH, pH 11.25) as working solution. The plate was incu- bated for 30 minutes at 37˚C in darkness. The absorbance was measured by microplate reader (SpectraMax Plus 384, Molecular Devices, LLC., CA, USA) set at 562 nm. The standardized results were normalized to the working solution background.
Qubit assay
The commercially available Qubit Assay kit [21] (Thermo Fisher Scientific, MA, USA) was used (Fig 2B). The protocol given by the manufacturer was applied (n = 12, PCR Eppendorf
tubes). Briefly, 1μL dye was diluted in 199μL buffer, then the 1μL rotifer or yeast isolates were added to 199μL mix. The reaction mix was incubated in dark for 15 minutes and the readings were obtained by the Qubit Fluorometer 2.0 (Thermo Fisher Scientific, MA, USA).
The final concentration of the samples was calculated by its own reader.
Statistics
All raw data is provided as supplementary information (S1 Dataset). We presented the mean, and the error bars showed the standard error of the mean (S.E.M.). The one-way ANOVA was used for the comparison, followed by the Bonferronipost hoctest with GraphPad Prism 7.0b software (GraphPad Software Inc., CA, USA).
Results and discussion
Different methods are used to quantify the total amount of protein in a multitude of research topics; however, each assay has its own limitations (e.g. sensitivity to chelators and detergents).
Due to the development of high throughput proteomic screening, there is an increasing demand for developing new, easy-to-use approaches. The BisANS fluorescent dye has been introduced in several fields of protein analysis. To characterize our novel BisANS-based pro- tein quantification assay we tested it with protein samples prepared in basic medium (Fig 1) or in lysis buffer (Fig 2). First of all, we recommended an optimal incubation time and environ- ment for this assay using BSA as standard in chelator, detergent and inhibitor free basic medium. To reach the highest reliability, the relative fluorescence intensity, and the recom- mended incubation time were indicated (Fig 1A). We suggest subjectively 120 sec incubation time for saturation of fluorescent signal; however, we believe that it is unnecessary to wait any longer. The photostability of the BisANS was tested under different light conditions: dark, white (400 and 40,000 lux) and ultraviolet (UV; 254 and 366 nm) ones (Fig 1B). No significant changes were observed. The concentration range and minimum detection limit were evaluated by BSA standard ranging from 0 to 100μg/mL, and the correlation coefficient (R2= 0.9927;
y = 112.64x + 203.27) was calculated (Fig 1C). The minimum detection limit was 0.65μg/mL.
To validate our assay, Bradford and BCA methods were used, paralelly measuring known (BSA) and unknown (NCS) protein concentrations. We found that the BisANS assay proved to be the most accurate (Fig 1D).
To test the compatibility of our BisANS assay with interfering agents, we supplemented the basic medium with chelator (EDTA), detergent (SDS) and protease inhibitors such as leupep- tin and pepstatin A, thus forming a lysis buffer. The calibration curve was well-fitted in this environment (R2= 0.9903; y = 75.036x + 33.789;Fig 2A). The absolute fluorescence intensities decreased approximately by 35% compared to the corresponding data measured in the basic medium. The minimum detection limit was 0.28μg/mL. Since the previously applied Bradford and BCA methods are sensitive to the additional ingredients (EDTA, SDS and inhibitors), Qubit assay was used to validate our readings. The protein samples originated from living organisms, such as a bdelloid rotifer(Philodina acuticornis)and yeast(Saccharomyces cerevi- siae). These biological samples were isolated in the lysis buffer and their protein contents were measured both with Qubit and BisANS (Fig 2B). No significant difference was detected between the data measured by our assay and the Qubit.
In our experiments, we were the first to present the new application of the BisANS dye, as a basis of total protein quantification method besides or instead of another equivalent technique.
This dye has high photostability; therefore, no special care during incubation is necessary (unlike in the case of other fluorescent dyes, e.g. CBQCA) [6]. We demonstrated the advan- tages of BisANS-based assay, namely: good solubility in water, short incubation time, high
protein affinity and no exclusionary sensitivity to EDTA, SDS and protease inhibitors applied in our experimental settings with optimized concentrations; reliability and repeatability in broad spectrum of protein content with very low minimal and relatively high maximal detec- tion limit in comparison to other analog methods [1,2,21,22,23].
In summary, we have successfully developed and characterized a novel, BisANS-based total protein quantification method (S1 Graphical Abstract), with numerous advantages, which could be useful in many areas of protein science.
Supporting information
S1 Dataset. Raw data. All raw data from the study is provided in the RAW data.zip supple- mentary information.
(ZIP)
S1 Graphical Abstract. The BisANS has advantageous properties in protein detection: high photostability, quick interaction kinetics; no sensitivity to chelator, detergent and inhibi- tors.
(TIF)
Acknowledgments
The authors wish to thank Anna Szentgyorgyi, MA (Institute of English and American Studies, University of Szeged, Szeged, Hungary) for her valuable contribution in proofreading the manuscript.
Author Contributions
Conceptualization: Zsolt Datki, Zita Olah.
Formal analysis: Bence Galik, Gabor Mihaly.
Funding acquisition: Zsolt Datki, Magdolna Pakaski, Janos Kalman.
Investigation: Zsolt Datki, Zita Olah, Gabor Mihaly.
Methodology: Zsolt Datki, Zita Olah.
Project administration: Zsolt Datki.
Resources: Zsolt Datki.
Supervision: Zsolt Datki.
Validation: Zsolt Datki, Zita Olah, Lilla Macsai.
Visualization: Zsolt Datki, Bence Galik.
Writing – original draft: Zsolt Datki, Zita Olah, Lilla Macsai.
Writing – review & editing: Zsolt Datki, Zita Olah, Lilla Macsai.
References
1. Bradford MM. A rapid and sensitive method for the quantitation of microgram quantities of protein utiliz- ing the principle of protein-dye binding. Anal Biochem. 1976; 72(1–2):248–54. PMID:942051.
2. Smith PK, Krohn RI, Hermanson GT, Mallia AK, Gartner FH, Provenzano MD, et al. Measurement of protein using bicinchoninic acid. Anal Biochem. 1985; 150(1):76–85. PMID:3843705.
3. Georgiou CD, Grintzalis K, Zervoudakis G, Papapostolou I. Mechanism of Coomassie brilliant blue G- 250 binding to proteins: a hydrophobic assay for nanogram quantities of proteins. Anal Bioanal Chem.
2008; 391(1):391–403. Epub 2008/03/08.https://doi.org/10.1007/s00216-008-1996-xPMID:
18327568.
4. Brady PN, Macnaughtan MA. Evaluation of colorimetric assays for analyzing reductively methylated proteins: Biases and mechanistic insights. Anal Biochem. 2015; 491:43–51. Epub 2015/09/03.https://
doi.org/10.1016/j.ab.2015.08.027PMID:26342307; Pubmed Central PMCID: PMC4631703.
5. Campion EM, Loughran ST, Walls D. Protein Quantitation and Analysis of Purity. In: Walls D, Loughran S, editors. Protein Chromatography. Humana Press; 2017. pp 229–258.
6. You WW, Haugland RP, Ryan DK, Haugland RP. 3-(4-Carboxybenzoyl)quinoline-2-carboxaldehyde, a reagent with broad dynamic range for the assay of proteins and lipoproteins in solution. Anal Biochem.
1997; 244(2):277–82.https://doi.org/10.1006/abio.1996.9920PMID:9025944.
7. Cardamone M, Puri NK. Spectrofluorimetric assessment of the surface hydrophobicity of proteins. Bio- chem J. 1992; 282(2):589–93.http://dx.doi.org/10.1042/bj2820589%5CnPMID:1546973; Pubmed Central PMCID: PMC1130822.
8. Takashi R, Tonomura Y, Morales MF. 4,4’-Bis (1-anilinonaphthalene 8-sulfonate) (bis-ANS): a new probe of the active site of myosin. Proc Natl Acad Sci U S A. 1977; 74(6):2334–8. PMID:267928;
Pubmed Central PMCID: PMC432165.
9. Acharya P, Rao NM. Stability studies on a lipase from Bacillus subtilis in guanidinium chloride. J Protein Chem. 2003; 22(1):51–60.https://doi.org/10.1023/A:1023067827678PMID:12739898.
10. Younan ND, Viles JH. A Comparison of Three Fluorophores for the Detection of Amyloid Fibers and Prefibrillar Oligomeric Assemblies. ThT (Thioflavin T); ANS (1-Anilinonaphthalene-8-sulfonic Acid); and bisANS (4,4’-Dianilino-1,1’-binaphthyl-5,5’-disulfonic Acid). Biochemistry. 2015; 54(28):4297–306.
Epub 2015/07/10.https://doi.org/10.1021/acs.biochem.5b00309PMID:26087242.
11. Cordeiro Y, Lima LMTR, Gomes MPB, Foguel D, Silva JL. Modulation of prion protein oligomerization, aggregation, and beta-sheet conversion by 4,4’-dianilino-1,1’-binaphthyl-5,5’-sulfonate (bis-ANS). J Biol Chem. 2004; 279(7):5346–52. Epub 2003/11/21.https://doi.org/10.1074/jbc.M312262200PMID:
14634010.
12. Lindgren M, So¨rgjerd K, Hammarstro¨m P. Detection and characterization of aggregates, prefibrillar amyloidogenic oligomers, and protofibrils using fluorescence spectroscopy. Biophys J. 2005; 88 (6):4200–12. Epub 2005/03/11.https://doi.org/10.1529/biophysj.104.049700PMID:15764666;
Pubmed Central PMCID: PMC1305650.
13. Horowitz P, Prasad V, Luduena RF. Bis(1,8-anilinonaphthalenesulfonate). A novel and potent inhibitor of microtubule assembly. J Biol Chem. 1984; 259(23):14647–50. Available from:http://www.ncbi.nlm.
nih.gov/pubmed/1391609. PMID:6548750.
14. Fu X, Zhang X, Chang Z. 4,40-Dianilino-1,10-binaphthyl-5,50-sulfonate, a novel molecule having chaper- one-like activity. Biochem Biophys Res Commun. 2005; 329(3):1087–93.https://doi.org/10.1016/j.bbrc.
2005.01.164PMID:15752765.
15. Mozes E, Hunya A, Toth A, Ayaydin F, Penke B, Datki ZL. A novel application of the fluorescent dye bis-ANS for labeling neurons in acute brain slices. Brain Res Bull. 2011; 86(3–4):217–21. Epub 2011/
07/18.https://doi.org/10.1016/j.brainresbull.2011.07.004PMID:21782906.
16. Datki Z, Olah Z, Hortobagyi T, Macsai L, Zsuga K, Fulop L, et al. Exceptional in vivo catabolism of neu- rodegeneration-related aggregates. Acta Neuropathol Commun. 2018; 6(1):6.https://doi.org/10.1186/
s40478-018-0507-3PMID:29378654; Pubmed Central PMCID: PMC5789616.
17. Olson BJ, Markwell J. Assays for determination of protein concentration. Curr Protoc Protein Sci. 2007 May;Chapter 3:Unit 3.4.https://doi.org/10.1002/0471140864.ps0304s48PMID:18429326.
18. Hawe A, Sutter M, Jiskoot W. Extrinsic fluorescent dyes as tools for protein characterization. Pharm Res. 2008; 25(7):1487–99. Epub 2008/01/03.https://doi.org/10.1007/s11095-007-9516-9PMID:
18172579; Pubmed Central PMCID: PMC2440933.
19. Chakraborty S, Sarkar N, Bhattacharyya B. Nucleotide-dependent bisANS binding to tubulin. Biochim Biophys Acta—Protein Struct Mol Enzymol. 1999; 1432(2):350–5.https://doi.org/10.1016/S0167-4838 (99)00110-7PMID:10407156.
20. Keller RP, Neville MC. Determination of total protein in human milk: comparison of methods. Clin Chem.
1986; 32(1 Pt 1):120–3. PMID:3940691.
21. Vergauwen G, Dhondt B, Van Deun J, De Smedt E, Berx G, Timmerman E, et al. Confounding factors of ultrafiltration and protein analysis in extracellular vesicle research. Sci Rep. 2017; 7(1):2704.https://
doi.org/10.1038/s41598-017-02599-yPMID:28577337; Pubmed Central PMCID: PMC5457435.
22. Grintzalis K, Georgiou CD, Schneider YJ. An accurate and sensitive Coomassie Brilliant Blue G-250- based assay for protein determination. Anal Biochem. 2015; 480:28–30. Epub 2015/03/30.https://doi.
org/10.1016/j.ab.2015.03.024PMID:25837770.
23. Bainor A, Chang L, McQuade TJ, Webb B, Gestwicki JE. Bicinchoninic acid (BCA) assay in low volume.
Anal Biochem. 2011; 410(2):310–2. Epub 2010/11/13.https://doi.org/10.1016/j.ab.2010.11.015PMID:
21078286.