Contents lists available atScienceDirect
Photoacoustics
journal homepage:www.elsevier.com/locate/pacs
Research article
Photoacoustic detection based permeation measurements: Case study for separation of the instrument response from the measured physical process
Zoltán Bozóki
a,b,⁎, Tibor Guba
b, Tibor Ajtai
a,b, Anna Szabó
a, Gábor Szabó
baMTA-SZTE Research Group on Photoacoustic Spectroscopy, Dóm tér 9, H-6720 Szeged, Hungary
bDepartment of Optics and Quantum Electronics, University of Szeged, Dóm tér 9, H-6720 Szeged, Hungary
A R T I C L E I N F O Keywords:
Membrane permeability Instrument response function Residence time distribution analysis Photoacoustic detection
A B S T R A C T
In a carrier flow based permeation system the measured permeation curve is the convolution of two processes:
the intrinsic permeation process and the transfer of the permeated molecules through the measuring system. The latter one is quantified by the instrument response function (IRF). The possibility of calculating the IRF from permeation curves measured at various volumetric flow rates of the carrier gas is examined. The results are in partial agreement with preliminary expectations: the dependency of the calculated IRF on the volumetric flow rate of the carrier gas indeed follows roughly the expected tendency; however it is not completely independent from the physical properties of the measured membrane sample. This discrepancy can most probably be at- tributed to the imperfect design of the applied permeation cell. Overall it is expected that the proposed method for determining the instrument transfer function is a valuable tool for improving the design of permeation measuring systems.
1. Introduction
1.1. Carrier flow based permeation measurements
A carrier flow based gas permeation system (Fig. 1) [1] consists of a diffusion cell (marked with the abbreviation DC in Fig. 1), which is divided into two chambers, the feed and receiving chamber, which are hermetically separated by the measured membrane sample. The op- eration of the system has two phases. During the purging phase the entire inner volume of the gas handling of the system is purged by the carrier gas (i.e. high purity nitrogen in the present case). During the measurement phase, which is initialised by electronically controlled switching of the magnetic valve (marked as MV in Fig. 1) the feed chamber is purged with the feed gas (either pure carbon-dioxide or methane in the present case) while the receiving chamber is purged with the carrier gas. Molecules permeated through the membrane from the feed chamber into the receiving chamber are swept into a detection unit, i.e. in our case a photoacoustic cell (marked as PAC inFig. 1) by the carrier gas flow controlled by a mass flow controller (marked as MFC inFig. 1).
In order to differentiate the permeated molecules from the mole- cules of the carrier gas the applied detection method has to be selective.
Among the possible methods Beer-Lambert law based optical absorp- tion measurement techniques are fairly popular [2], as well as
photoacoustic (PA) detection, which is a special type of optical ab- sorption method that already has been applied successfully in per- meation measurements [3–5]. Previous research has shown that a properly optimised PA system outperforms conventional optical ab- sorption detection techniques as far as the minimum detectable con- centration and the response time is concerned [6].
A permeation curve (marked in the following ascM(t)) describes the dependence of concentration of the permeating molecules measured within the detection unit as a function of time elapsed since the start of the feed gas purging. By applying a numerical fitting method on the experimentally determined cM(t), the permeation parameters of the measured membrane (D, SandPi.e. the diffusivity, the solubility and the permeability, respectively) can be calculated [7]. For this, one could fit either the entire permeation curve or only its late, steady state part.
The latter, referred to as time-lag method, is mathematically a much simpler procedure and therefore it is widely applied [8]. On the other hand, the full curve fitting was already shown to be less influenced by measurement errors and artefacts [5], therefore it is preferable.
1.2. Distortion of the permeation curve due to the measuring system It is important to emphasise that from the theory of diffusion (see e.g. [7]) one cannot deduce an exact mathematical expression forcM(t) but rather for the theoretical curvejT(t), which is the temporal variation
https://doi.org/10.1016/j.pacs.2018.08.001
Received 9 June 2018; Received in revised form 25 July 2018; Accepted 2 August 2018
⁎Corresponding author at: MTA-SZTE Research Group on Photoacoustic Spectroscopy, Dóm tér 9, H-6720, Szeged, Hungary.
E-mail address:zbozoki@physx.u-szeged.hu(Z. Bozóki).
Available online 08 August 2018
2213-5979/ © 2018 The Authors. Published by Elsevier GmbH. This is an open access article under the CC BY-NC-ND license (http://creativecommons.org/licenses/BY-NC-ND/4.0/).
T
of the permeation flux of the molecules through unit area of the membrane. For simple permeation processes the latter one can be written as [7]:
= +
=
j t P p
l e
( ) 1 2 ( 1)
T
n
n n D t
l 0
2 2 2
(1) where P=D⋅S, pis the partial pressure of the feed gas maintained within the feed chamber andlis the thickness of the membrane sample.
Therefore, a phenomenological relationship should be introduced, which relates the theoretically calculated jT(t)to the experimentally measuredcM(t):
=
c t A
Q j t h Q ( ) ( ( )* ( , ))
M c T c (2)
whereAis the surface area of the membrane andQcis the volumetric flow rate of the carrier gas.Qcappears in the denominator in Eq.(2) because the carrier gas flow not only transfers the permeated molecules from the receiving chamber to the detection cell but it actually also dilutes their concentration and the degree of dilution at first approx- imation is inversely proportional toQc. The functionh(Qc,τ), which can be seen as an instrument response function [9], represents the influence of the measuring system on the measured permeation curve. In Eq.(2) the mathematical operator of convolution (convolution and deconvo- lution are marked with the sign of * and1*, respectively) expresses the fact that the two processes (i.e. the permeation through the membrane and the transport of the permeated molecules to the point of detection) are separable, which also means that under ideal conditions jT(t) is independent of Qc andh(Qc,τ) is independent of the material para- meters (i.e.D, S, Pandl) of the measured membrane. The outstanding importance of Eq. (2)is that once h(Qc,τ)is determined and if it is proven to be independent from the measured membrane sample and the feed gas, then there is the possibility of calculating back from the measured permeation curve (cM(t)) the permeation flux though the membrane (jT(t)) as:
= j t Q
A c t h Q
( ) ( )1
* ( , )
T c
M c (3)
and thus the distorting effect of the measuring system can be eliminated and from the deduced jT(t) curve the permeation parameters of the measured membrane can be determined accurately.
The measuring system can influence the measured permeation curve in several ways, i.e.h(Qc,τ)is dependent on several factors:
•
First of all, there is a delay time (marked in the following asτ)during which the permeated molecules from the receiving chamber are transported into the detection cell by the carrier gas. This delay time can be approximated as [10]:
V Q
D
c (4)
whereVDis the total volume of the detection part of the permeation measuring system i.e. the sum of the volumes of the receiving chamber, the detection unit and the gas handling in-between them.
•
Adsorption/desorption effects, resulting from the interaction of the permeated molecules with the inner surfaces of the measuring system influences bothτandh(Qc,τ)[11]. Careful selection of ma- terials of the system’s components (e.g. in many cases stainless steel) and the application of special coating on the inner surfaces can help to reduce the effect of adsorption/desorption. Nevertheless in practice adsorption/desorption effects can never be completely eliminated.•
Additionally the permeation measuring system might leak to the ambient, and the permeated molecules might diffuse into the o-rings used for sealing. These are possible construction deficiencies, which can also influence h(Qc,τ) but they can be eliminated by careful optimisation of the permeation system (as implemented for the case of the measuring system reported here).In principle these effects can be incorporated into ah(Qc,τ)function.
However, for an improperly designed permeation system, the processes of permeation and measurement might not be separable at all, i.e. Eqs.
(2) and (3) are not applicable, and therefore permeation measurements with such systems are burdened with inaccuracy. Indeed recently Verwolf et al. performed permeation measurements with various com- mercially available permeation instruments and found large variations in the deduced permeation parameters [12]. Based on their work it can be assumed that the operation of these instruments lacks a method with which first the instrument response function can be determined and then the measured permeation curve can be corrected withh(Qc,τ)in accordance with Eq.(3). Furthermore based on their results Verwolf et al. pointed out the importance of the performance based optimisation of the design of the permeation cell, which should primary target the homogenisation of the temperature and the carrier gas flow distribution within the receiving chamber [12]. However they did not suggest a method for verifying the appropriateness of a permeation cell design, which is the subject of the presented work.
The usual technical solution in permeation measurements for the suppression of the effect ofh(Qc,τ)oncM(t)is to increaseQcuntilcM(t) becomes practically independent of Qc. This tendency of cM(t)is in- terpreted in a way that for permeation measurements executed at high Qcvalues the effect of the measurement system oncMis suppressed. The underlying assumption can be expressed mathematically as:
=
h Q( c , ) 1 (5)
On one hand, the validity of Eq.(5)is a plausible assumption, which is supported by the fact that in a series of permeation measurements it was indeed observed that by increasing Qc the deduced permeation parameters converge to limiting values, which are actually independent of Qc[4]. On the other hand, performing permeation measurements with highQcvalues is not always feasible because, as it follows from Eq.
(2), there is an overall inverse proportionality betweenQc and the concentration of the permeated molecules in the detection cell.
Therefore by increasingQcthe signal to noise ratio (S/N) of the con- centration measurement decreases and parameters can be calculated only from noise permeation curves with large uncertainty, especially in case of low permeability samples. Indeed in our recent publication [5]
it was shown that the S/N of the concentration measurement has to be kept above 50 at least during the late, quasi steady-state part of the permeation process otherwise there will be a considerable uncertainty Fig. 1.Schematic of the carrier gas and photoacoustic detection unit based
membrane permeation measurement system. The following abbreviations are used: MV: magnetic valve, MFC: mass flow controller, DC: diffusion cell, DL:
diode laser light source, PAC: photoacoustic detection cell.
(more than 10% relative error) in the deduced permeation parameters especially when the full curve fitting method is applied. Consequently, in order to maintain the required S/N low permeability membranes can only be measured with lowQcvalues for which the limit given by Eq.
(5)is not approached and thus the distortion effect ofh(Qc,τ)cannot be disregarded.
2. The proposed method for the determination ofh(Qc,τ) The basic idea of the reported work is to determineh(Qc,τ)from permeation measurements performed on membrane samples, which have permeability high enough so they can be measured both in the low and highQcranges. These two ranges are defined in a way that in the former rangecM(t)hasQcdependence while in the latter rangecM(t) becomes Qc independent [4] (except that the measured permeation curve becomes noisier with increasingQcvalues). In the following su- perscripts, low and high indicates whether the measurement is per- formed in the former or latter range, respectively. Eq.(3)can be written for either case and by taking into account the fact that jT(t)is in- dependent from the actual value ofQcone gets:
=
h Q h Q Q
Q c t Q c t Q
( , )1
* ( , ) ( )(@ )1
* ( )(@ )
clow
chigh clow
chigh M clow
M chigh
(6) Furthermore ifQchighis high enough that the limit set by Eq.(5)is approached then Eq.(6)simplifies to:
= =
h Q Q
Q c t Q c t Q RTD Q
( , ) ( )(@ )1
* ( )(@ ) ( )
clow clow
chigh M clow
M chigh
clow
(7) Based on Eq.(7)one can characterise a permeation measurement system by calculating its h(Qc,τ)function from permeation measure- ments performed with test samples both in the low and high ranges of Qcvalues. Clearly this procedure is applicable only if the deducedh (Qc,τ)function is found to be independent from the actual test mem- brane and feed gas. On the other hand, once a sample independenth (Qc,τ)function is generated it facilitates accurate determination of the permeation parameters (by Eq.(3)) even for samples with low perme- ability, which are measurable only with lowQcvalues. Furthermore Eq.
(7) can also be used to determine the Residence Time Distribution (RTD) of the permeation measuring system too, which is the probability distribution of the amount of time that a molecule spends within the measuring system after permeating through the membrane [10]. Var- ious order central moments of the RTD function can be calculated helping the better understanding of the transport processes within the measuring system.
In the following, the applicability of the proposed method for the determination of the instrument response function is investigated by reanalysing previously measured permeation curves of a photoacoustic detection based permeation measuring instrument.
3. Experimental data for reanalysis
The present work is based on measurement results from our pre- vious publication [4]. In the following the measurement set-up of a carrier flow based permeation system using a PA detection unit is briefly described while further details are given in the original pub- lication [4]. The feed gas was either methane (99.995% purity) or carbon-dioxide (99.9995% purity). The carrier gas was nitrogen (99.9995% purity). The minimum detectable concentration (MDC) by the PA detection unit is 0.5 ppm and 50 ppm for methane and carbon- dioxide, respectively. Various polymer samples were measured with variousQcvalues, which however never exceeded 500 sccm (standard cm3per minute) as above this limit gas flow through the PA cell gen- erates excessive acoustic noise, which increases considerably the MDC of the system. There is a set of samples (namely the polyethylene and the silicone rubber sample with thickness of 0.06 mm and 2.5 mm,
respectively) for which the measured permeation curves and deduced permeation parameters becomeQcindependent already whenQcis well below 500 sccm, while for the other set this is not the case (see Fig. 3 in Reference [4]). These latter set is excluded from the forthcoming ana- lysis as the prevailingQcdependency indicates the inapplicability of Eq.
(5)for these samples in case ofQc≤ 500 sccm. Therefore in the fol- lowing only the former set of measured samples is considered. The deduced permeation parameters of the analysed samples are shown in Table 1together withQcmax, which is the largest volumetric flow rate of the carrier gas at which the permeation measurements are performed and at which the listed permeation parameters are determined.Qcmaxis also used asQchighwhenever Eq.(7)is applied forh(Qc,τ)determina- tion.
On the permeation curves measured for these samples and feed gases deconvolution was performed in accordance with Eq.(7)and the Qcdependent transfer functions and residence time distributions were determined.
4. Results and discussion
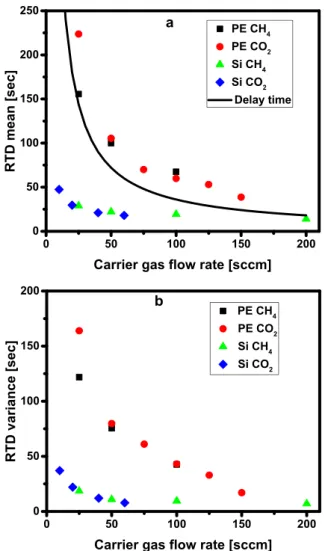
InFig. 2 the calculated residence time distributions for the per- meation measurements in case of CO2 feed gas and polyethylene membrane sample can be seen for variousQcvalues.Fig. 3shows the dependence of the various RTD moments i.e. the mean (3a) and the variance (3b.) calculated for various membranes (PE – polyethylene, Si – silicone rubber) and permeating analytes (CH4 – methane, CO2– carbon dioxide).Fig. 3also indicates the calculated delay time (τ) as defined by Eq.(4)by taking account thatVD≈60 cm3for the present system.
Fig. 2shows that the calculated RTD functions become narrower and shift toward the y-axis i.e. they converge toward a Dirac-delta function asQcis increasing. Indeed mathematically the deconvolution of two identical functions is a Dirac-delta function. Accordingly the Table 1
Summary of the results of permeation measurements.
Sample Feed gas D
Diffusivity [m2/s]
SSolubility [1/Pa]
Qcmax
Carrier gas flow rate at which these parameters were determined [sccm]
Polyethylene CH4 1.78 × 10⁻¹¹ 1.07 × 10⁻⁶ 400 Polyethylene CO2 3.06 × 10⁻¹¹ 2.32 × 10⁻⁶ 300 Silicone rubber CH4 1.68 × 10⁻⁹ 5.11 × 10⁻⁶ 400 Silicone rubber CO2 1.85 × 10⁻⁹ 1.75 × 10⁻⁵ 200
Fig. 2.Calculated residence time distributions for CO2permeation measure- ments on the polyethylene membrane sample.
RTD moments converge to zero as well (Fig. 3a and b). However, as QclowapproachesQcmax, artificial oscillations in theh(Qclow,τ)function calculated with the help of Eq.(7)occur. This is a well-known artefact of deconvolution [13], which is caused by the increasing similarity of the two functions on which deconvolution is applied. Due to this effect only thoseQclowvalues are shown inFigs. 2 and 3for which oscillation does not occur. Due to these artificial oscillations no further insight can be gained about the wayh(Qclow,τ)approaches to a Dirac-delta function wheneverQclow→Qcmax.
Fig. 3a illustrates that RTD mean values loosely follow the delay time curve. However, while RTD mean (and also RTD variance) values show only very slight dependence on the feed gas, they are clearly in- fluenced by the measured membrane sample. From this it can be con- cluded that for the studied permeation system it is not possible to se- parate the permeation process and the response of the actual permeation measuring system, i.e. the design of the system has to be improved.
Fig. 3a shows that for samples with high permeability (i.e. silicone rubber membrane) the measured RTD points are well below the delay time curve, while for lower permeability sample (i.e. polyethylene membrane) these points are fairly close to the curve. One can give a speculative explanation for this observation, which is in agreement with the conclusions of Verwolf et al. [12]. Most probably due to the im- proper design of the receiving chamber of the permeation cell there are dead volumes in it, which are not purged effectively by the carrier gas.
Therefore those permeating molecules arriving into these dead volumes
are trapped there for a time much longer than the characteristic delay time of the system calculated by Eq. (4). For membranes with low permeability the permeation process is slow therefore there is sufficient time for those trapped molecules to diffuse out from the dead volumes into the flow channels of the carrier gas through the receiving chamber, which is however not the case for high permeability membranes. This effect can be interpreted as an apparent reduction of the volume of the receiving chamber. Actually from the measured data it can be inter- preted that about half of the volume of the receiving chamber acts as a dead volume in case of a highly permeable sample. Obviously those parts of the membrane, which are right above these dead volumes, give a reduced contribution to the permeation process, which means that in accordance with Eq. (2)the deduced permeation parameters are in- accurate too. These findings clearly indicate the importance of the proper permeation cell design as suggested by Verwolf et al. [12].
5. Conclusion and outlook
The instrument response function is a critical parameter of a per- meation measuring system. It influences the measured permeation curves (see Eq.(2)) and can be used to correct the results of permeation measurements whenever the measurement can be performed only with insufficiently high carrier gas volumetric flow rates (see Eqs. (3) and (7)). Therefore there is a clear need for a method with whichh(Qc,τ) can be determined. This work proposes a method for this purpose, which is based on the permeation measurement in a wide range ofQc
values using Eq.(7). Furthermore based on Eq.(7)residence time dis- tribution functions can be calculated and the various order central moments of this function gives a better insight into the transfer prop- erties of the measuring system. However, it turns out that the proposed method for the separation of the instrument response is applicable only if the determinedh(Qc,τ)is independent from the measured membrane sample and the feed gas, while the opposite case most probably in- dicates the improper design of the permeation system. Consequently the proposed method can be used to improve and verify permeation cell design too. Indeed the results of the presented analysis indicate that our currently used permeation cell has to be re-designed in order to elim- inate or at least minimise dead volumes in its receiving chamber and to homogenise the flow pattern of the carrier gas in it as much as possible.
After re-designing the permeation cell the presented analysis is planned to be executed once again by using a larger number of membrane samples. It is expected that with the re-designed permeation cell the instrument response function will become independent from the mea- sured membrane samples (or at least the dependency will be largely suppressed), i.e. the accuracy of the deduced permeation parameters will be considerably improved. Furthermore the design of the PA de- tection unit is under modification too in order to surpass the 500 sccm limit on the applicable volumetric flow rate of the carrier gas, which currently excludes many types of membrane samples from the analysis.
Finally once there is a permeation measuring system for whichh (Qc,τ)is known accurately, this opens up the possibility to study un- conventional (non-Fickian) permeation processes too.
Conflict of interest
The authors declare that there are no conflicts of interest.
Acknowledgements
This work was supported by the GINOP-2.3.2-15-2016-00036, by the European Union, co-financed by the European Social FundEFOP- 3.6.1-16-2016-00014 and by the János Bolyai Research Scholarship of the Hungarian Academy of Science.
Fig. 3.Mean (3a.) and variance (3b.) of the residence time distributions for various samples and feed gases. The calculated delay time (see Eq.(4)) is also shown on 3a.
References
[1] ISO 15105-2, Plastics – Film and Sheeting – Determination of Gas-transmission Rate – Part 2: Equal-pressure Method, (2003).
[2] ISO 15106-2, Plastics – Film and Sheeting – Determination of Water Vapour Transmission Rate – Part 2: Infrared Detection Sensor Method, (2005).
[3] Z. Filus, T. Ajtai, Z.L. Horváth, Z. Bozóki, G. Pap, T. Nagy, T. Katona, G. Szabó, A novel apparatus based on a photoacoustic gas detection system for measuring permeation parameters of polymer samples, Polym. Test. 26 (2007) 606–613.
[4] Z. Filus, N. Tóth, G. Gulyás, T. Guba, G. Szabó, Z. Bozóki, Carrier gas flow ar- rangement based photoacoustic detection method for measuring gas permeability of polymer membranes, Polym. Test. 32 (2013) 1099–1104.
[5] T. Guba, Z. Filus, K.A. Simon, G. Szabó, Z. Bozóki, Comparison of the accuracy of curve-fitting methods for the determination of gas permeability parameters of sheet polymer samples, Polym. Test. (2015) 59–64.
[6] Z. Bozóki, Á. Mohácsi, G. Szabó, Z. Bor, M. Erdélyi, W. Chen, F.K. Tittel, Near infrared diode laser based spectroscopic detection of ammonia: a comparative study of photoacoustic and direct optical absorption methods, Appl. Spectrosc. 56 (2002) 715–719.
[7] J. Crank, The Mathematics of Diffusion, 2nd ed., Clarendon Press, 1975.
[8] B. Flaconneche, J. Martin, M.H. Klopffer, Transport properties of gases in polymers:
experimental methods, Oil Gas Sci. Technol. 56 (2001) 245–259.
[9] J.P. Hespanha, Linear System Theory, 2nd ed., Princeton university press, 2018.
[10] S. Li Feng, X. Lin Li, Reaction Engineering, Elsevier, 2017.
[11] A. Schmohl, A. Miklós, P. Hess, Effects of adsorption-desorption processes on the response time and accuracy of photoacoustic detection of ammonia, Appl. Opt. 40 (2001) 2571–2578.
[12] A. Verwolf, S.O. Farwell, Z. Cai, P. Smith, Performance-based design of permeation test cells for reliable evaluation of chemical protective materials, Polym. Test. 28 (2009) 437–445.
[13] S.W. Smith, Digital Signal Processing: A Practical Guide for Engineers and Scientists, Technical Publishing, California, 1997.
Zoltán Bozókireceived his MSc, PhD and DSc degrees in physics in 1989, 1997 and 2012, respectively. He has been working at the University of Szeged from 1994 to present, since 2013 as a professor. He also at the Research Group on Photoacoustic Spectroscopy jointly operated by the Hungarian Academy of Sciences and the University of Szeged. His primary research activity is the development of the photoacoustic detection method for various applica- tions including industrial process monitoring and environ- mental monitoring. Zoltán Bozóki is the CEO of Hilase Ltd., a company, which develops and commercialises photo- acoustic instruments for various applications and the chief scientific adviser of Hobré Laser Technology Ltd., which sells photoacoustic instrument for the oil and natural gas industry. In 2017 he received the Gábor Dénes Price for his innovations in the field of photoacoustics.
Tibor Guba(born 1988) is a predoctoral student at the University of Szeged. He began his graduate studies in 2007 and achieved MSc degree in physics in 2013. Majoring subjects: Optics and Material Sciences. His PhD studies began in 2013 at The MTA-SZTE Research Group on Photoacoustic Spectroscopy. His research topics include numerical simulations, diffusion, gas detection, systems theory.
Tibor Ajtaireceived his MSc and PhD in physics in 2001, 2012 respectively. He has been working at the University of Szeged from 2001 to present. He also the member of Research Group on Photoacoustic Spectroscopy jointly operated by the Hungarian Academy of Sciences and the University of Szeged. His primary research activity is the development of the special light sources for practical applications, aerosol and gas phase spectroscopies techniques, investigation of dispersed nanostructures.
Anna Szabóreceived her MS and pH.D. degrees in physics from University of Szeged, Hungary, in 2010 and 2016, respectively. She is a research fellow at Research Group on Photoacoustic Spectroscopy jointly operated by the Hungarian Academy of Sciences and the University of Szeged. Her current research interests include development of photoacoustic spectroscopy based gas measuring systems for medical research and industrial process monitoring.