Received: July 28, 2017; Revised: December 19, 2017; Accepted: February 2, 2018
© The Author(s) 2018. Published by Oxford University Press. All rights reserved. For Permissions, please email: journals.permissions@oup.com.
doi:10.1093/carcin/bgy018
Advance Access publication February 23, 2018 Original Article
Original Article
FGF2 and EGF induce epithelial–mesenchymal
transition in malignant pleural mesothelioma cells via a MAPKinase/MMP1 signal
Karin Schelch
1,2, Christina Wagner
1, Sonja Hager
1, Christine Pirker
1, Katharina Siess
1, Elisabeth Lang
1, Ruby Lin
2,3, Michaela B.Kirschner
2, Thomas Mohr
1, Luka Brcic
4, Brigitte Marian
1, Klaus Holzmann
1,
Bettina Grasl-Kraupp
1, Georg Krupitza
5, Viktoria Laszlo
6,7, Thomas Klikovits
6, Balazs Dome
6,8,9, Balazs Hegedus
6,10,11, Tamas Garay
10, Glen Reid
2,12,
Nico van Zandwijk
2,12, Walter Klepetko
6, Walter Berger
1, Michael Grusch
1,* and Mir Alireza Hoda
61
Institute of Cancer Research, Department of Medicine I, Comprehensive Cancer Center Vienna, Medical University of Vienna, 1090 Vienna, Austria,
2Asbestos Diseases Research Institute (ADRI), Sydney, NSW 2139, Australia,
3School of Medical Sciences, University of New South Wales, Sydney, NSW 2052, Australia,
4Institute of Pathology, Medical University of Graz, 8010 Graz, Austria,
5Department of Clinical Pathology, Medical University of Vienna, 1090 Vienna, Austria,
6Translational Thoracic Oncology Laboratory, Division of Thoracic Surgery, Department of Surgery, Comprehensive Cancer Center Vienna and
7Department of Biomedical Imaging and Image-guided Therapy, Medical University of Vienna, 1090 Vienna, Austria,
8
Department of Tumor Biology, National Koranyi Institute of Pulmonology, 1085 Budapest, Hungary,
9Department of Thoracic Surgery, National Institute of Oncology and Semmelweis University, 1122 Budapest, Hungary,
10MTA-SE Molecular Oncology Research Group, Hungarian Academy of Sciences, 1051 Budapest, Hungary,
11Department of Thoracic Surgery, Ruhrlandklinik, University Clinic Essen, University of Duisburg-Essen, 45239 Essen, Germany and
12School of Medicine, University of Sydney, NSW 2006, Australia
*To whom correspondence should be addressed. Tel: +43 (0)1 40160 57556; Fax: +43 (0)1 40160 957555; Email: michael.grusch@meduniwien.ac.at
Abstract
Malignant pleural mesothelioma (MPM), an aggressive malignancy affecting pleural surfaces, occurs in three main histological subtypes. The epithelioid and sarcomatoid subtypes are characterized by cuboid and fibroblastoid cells, respectively. The biphasic subtype contains a mixture of both. The sarcomatoid subtype expresses markers of epithelial–
mesenchymal transition (EMT) and confers the worst prognosis, but the signals and pathways controlling EMT in MPM are
not well understood. We demonstrate that treatment with FGF2 or EGF induced a fibroblastoid morphology in several cell
lines from biphasic MPM, accompanied by scattering, decreased cell adhesion and increased invasiveness. This depended
on the MAP-kinase pathway but was independent of TGFβ or PI3-kinase signaling. In addition to changes in known EMT
markers, microarray analysis demonstrated differential expression of MMP1, ESM1, ETV4, PDL1 and BDKR2B in response to
both growth factors and in epithelioid versus sarcomatoid MPM. Inhibition of MMP1 prevented FGF2-induced scattering
and invasiveness. Moreover, in MPM cells with sarcomatoid morphology, inhibition of FGF/MAP-kinase signaling induced a
more epithelioid morphology and gene expression pattern. Our findings suggest a critical role of the MAP-kinase axis in the
morphological and behavioral plasticity of mesothelioma.
Introduction
Malignant pleural mesothelioma (MPM) is a very aggressive malignancy arising from the mesothelial cells lining the pleural cavity (1). Inhalation of asbestos fibers is the main cause of MPM.
Industrial use of asbestos has led to a rise in incidence during the second half of the 20th century (2). A further global increase is expected due to continued mining and use of asbestos in many countries and the long latency period between asbestos exposure and clinical manifestation of MPM (3).
Histologically, MPM is classified as either epithelioid, sarco- matoid or biphasic (also termed mixed). The median survival of patients is between 9 and 17 months (4). However, the epithelioid subtype confers better prognosis than the biphasic or sarcoma- toid subtype and may also show a more favorable response to therapy (5,6). Current first-line chemotherapy for MPM usually consists of a combination of cisplatin and pemetrexed, and pro- longs median survival by several months (7). In selected patients with early-stage disease, multimodality therapy combining sur- gery, chemotherapy and radiation is feasible and is likely to fur- ther prolong survival (8). Local tumor spread and invasion into surrounding tissue in combination with resistance to radiation and chemotherapy often cause rapid tumor recurrence leaving limited treatment options (9,10).
Several studies have suggested that the different histological subtypes of MPM may reflect the occurrence of epithelial–mes- enchymal transition (EMT) (11–13), a cellular program by which epithelial cells acquire the morphology and behavioral char- acteristics of mesenchymal, fibroblast-like cells (14). EMT not only plays a fundamental role during embryogenesis but also contributes to tumor progression by promoting cell migration and invasion. Some prototypical EMT markers like E-cadherin, Snail or ZEB1 are differentially expressed between epithelioid and sarcomatoid MPM (11,12), and a genome-wide expression study demonstrated an EMT signature in a subgroup of MPM cases, which was associated with a worse prognosis (15). These data suggest that EMT plays an important role in a subset of MPM patients and may critically affect prognosis and therapy response. However, the triggering signals and associated sig- nal transduction pathways of EMT in MPM cells are not well understood.
In this study, we investigate growth factor-induced EMT in MPM and characterize the underlying pathways and target genes in cell models and tissue specimens. Moreover, we describe the possibility for reversal of mesenchymal/sarcomatoid features by inhibition of specific pathways.
Materials and methods
Cell culture
Cell lines were cultivated in growth medium containing 10% heat-inac- tivated fetal bovine serum (FBS) in a humidified atmosphere (37°C, 5%
CO2). Growth media and information on all cell lines used are listed in Supplementary Table 1, available at Carcinogenesis Online. Unless stated
lines were authenticated by array comparative genomic hybridization or STR profiling, and experiments were performed within <10 passages after authentication and <15–20 passages after establishment or receipt from collaborators or commercial suppliers.
Cytokines and drugs
All inhibitors, their target molecules and the commercial suppliers of all cytokines and inhibitors used are listed in Supplementary Tables 2 and 3, available at Carcinogenesis Online. FGF2, EGF and other cytokines were used at 10 ng/ml except for adhesion assays (20 ng/ml) and invasion and soft agar assays (50 ng/ml) where higher cytokine concentrations were used to account for the initially unattached cell state and protein degradation during prolonged incubation, respectively.
Morphology analysis
MPM cells (1 × 10⁵) were seeded into six-well plates and treated the next day with FGF2, FGF18, EGF, HGF, PDGF-AB, TGFβ1 or BMP2 at a concentra- tion of 10 ng/ml in medium with 10% FBS or serum-free medium. For com- bination treatment, the FGFR inhibitors PD-166866 (10 µM) and BGJ-398 (0.5 µM), the mulitkinase (including FGFR) inhibitors nintedanib (0.5 µM) and ponatinib (0.5 µM), the EGFR inhibitor erlotinib (10 µM), the AKT inhibi- tor MK-2206 (10 µM), the PI3K inhibitor LY-294002 (20 µM), the MEK inhibi- tors UO-126 (10 µM) and selumetinib (10 µM), the TGFβ-receptor inhibitor SB-431542 (20 µM), the focal adhesion kinase (FAK) inhibitor BI-853520 (1 µM), the NFκB inhibitor BAY-11–7082 (1 µM), the MMP inhibitor GM6001 (5 µM) and the ETS family inhibitor YK4-279 (1 µM) were added 1 h before cytokines. Concentrations were chosen following literature reports and did not induce cytotoxicity over the duration of analysis. Microscopic images were taken 24 h later using a Nikon microscope (Eclipse Ti300) and a Nikon DS Fi1c camera. Aspect ratio (major axis/minor axis) and cir- cularity [4π (area/perimeter)2] of about 120 individual cells, and area and perimeter of cell clusters were analyzed with ImageJ or Adobe Photoshop CS4. To quantitate the degree of cell scattering, a key characteristic of EMT in cultured cells (16), the numbers of contiguous cell clusters (cell islands with cell–cell contacts) per microscopic image of at least three independ- ent experiments were counted using ImageJ and defined as ‘scatter score.’
Immunoblots
MPM cells (1 × 10⁵) were seeded into six-well plates in medium with 10%
FBS and incubated with FGF2, EGF or vehicle (phosphate-buffered saline).
Cells were harvested in lysis buffer (150 mM NaCl, 50 mM HEPES, 10%
glycerol, 1 mM EDTA, 0.5 mM Na3VO4, 10 mM NaF, 1% Triton X100, 1.5 mM MgCl2), proteins (15–30 µg) were separated by SDS-PAGE and electroblot- ted onto polyvinylidene difluoride membranes. Immunoblots were per- formed as described previously (17). Briefly, membranes were stained with Ponceau S to control for equal sample loading, blocked in tris-buffered saline with Tween 20 and 5% skim milk powder or bovine serum albumin (dependent on recommendations of the antibody suppliers) and incu- bated in primary antibodies at 4°C overnight. Primary antibodies used, their suppliers, IDs and dilutions are listed in Supplementary Table 4, available at Carcinogenesis Online. After washing, membranes were incu- bated with horseradish peroxidase-coupled secondary antibodies (Dako, Glostrup, Denmark, 1:10,000) for 1 h at ambient temperature. Signals were developed with the Immun-Star Western C Chemiluminescence kit (Biorad, Hercules, CA).
Adhesion assays
For quantification of adhesion, cells stably expressing green fluorescent protein (GFP) after retroviral transduction were used. The GFP cDNA was subcloned into the retroviral vector pQCXIP (Clontech Mountain View, CA) as described previously (18). Viral particles were generated with the Clontech Retro-X Universal Packaging System according to the manufac- turer’s instructions. MPM cell lines stably expressing GFP were established by incubating the MPM cells with viral particles in the presence of 8 µg/
ml polybrene overnight followed by selection with puromycin (0.8 µg/
ml) for 2 weeks. For analysis, 1 × 10⁴ cells were seeded in quadruplicates into 96-well plates in medium with 10% FBS containing FGF2 or EGF. For measuring the impact on attachment speed, the medium was changed
EMT epithelial–mesenchymal transition
FAK focal adhesion kinase
FBS fetal bovine serum
FGFRs fibroblast growth factor receptors
GFP green fluorescent protein
MPM malignant pleural mesothelioma
qPCR quantitative real-time PCR;
TLDAs TaqMan low-density arrays.
30–120 min after seeding to remove non-attached cells and the plates were scanned on a Typhoon Trio imager (488 nm, 526/30 nm bandpass filter). To determine resistance to detachment, cells were scanned 1 day after seeding, washed with PBS (3×) and scanned again (19). The degree of cell loss was calculated using ImageJ.
Invasion assay
Cells (4 × 10⁴) were seeded into collagen-coated (50 µl, 1:12 in PBS, overnight at 37°C) Boyden chambers (8 µm pore size, 24-well format) in medium with 10% FBS and treated with FGF2 or EGF. After 72 h, filters were washed with PBS, fixed with methanol/acetic acid (3:1), and cells on the upper side of the membrane were removed. Cells on the underside of the membrane were stained with crystal violet that was subsequently solubilized in 2%
SDS. Absorbance was read at 562 nm on a Synergy HT microplate reader.
Soft agar assay
Anchorage-independent growth was assessed by soft agar assay. Briefly, a bottom layer of 1.5 ml growth medium containing 0.6% agar was poured into six-well plates. The next day, 5 × 10³ cells were suspended in 1.5 ml medium (with 10% FBS) containing 0.3% agar, treated with FGF2 or EGF and added as top layer. Plates were incubated for 17–19 days. Colonies were counted microscopically (cut-off: 100 µm diameter).
TaqMan low-density array
Expression of 760 microRNAs was assessed using TaqMan Array Human MicroRNA A+B Cards Set v3.0. Cells were seeded and treated with FGF2 for 24 h, harvested, and total RNA was extracted using TRIZOL (Thermo Fisher Scientific, Waltham, MA). cDNA synthesis was conducted using Megaplex RT Primers Human Pool Set v3.0 (Thermo Fischer Scientific) according to the manufacturer’s instructions. TaqMan low-density arrays (TLDAs) were run on a ViiA7 thermocycler, and data were analyzed as described (20).
Gene expression microarrays
To compare cell lines established from different histological MPM sub- types, cells were grown to 60–80% confluence in their respective growth media with 10% FBS before RNA isolation. For analysis of expression changes in response to growth-factor treatment, 1 × 10⁵ cells were seeded into six-well plates in medium with 10% FBS and treated the next day with FGF2 or EGF for 24 h. RNA from two biological replicas each was isolated using TRIZOL and checked on an Agilent 2100 Bioanalyzer. Genome-wide mRNA expression analysis was performed using 4 × 44 whole genome gene expression arrays (Agilent Technologies, Santa Clara, CA) follow- ing the manufacturer’s instructions. Arrays were scanned on an Agilent G2505B microarray scanner. Differential gene expression was analyzed using GeneSpring version 13.0.4 GX.
Pathway analysis
For both microRNA target genes and gene array (fold change >3) datasets, pathway enrichment analysis was carried out. The microRNA dataset was derived from target gene extraction (TargetScan v6.2) of differen- tially expressed microRNAs (fold change >10) based on Fisher’s exact test.
Similarly, differentially expressed genes (fold change >3) from the tran- scriptome dataset were used. Enriched pathways were built based on the Kyoto Encyclopedia of Genes and Genomes (KEGG) database (Partek Genomics Suite v6.5, St Louis, MO).
PCR analysis
Cells (1 × 10⁵) were seeded in medium with 10% FBS and treated as described in the Morphology analysis section. RNA was isolated with TRIZOL 24 h after cytokine treatment and reverse transcribed with M-MLV reverse transcriptase (Thermo Fisher Scientific) and random hexamer primers. The resulting cDNAs were analyzed using TaqMan gene expression assays or SYBR-based quantitative real-time PCR (qPCR) (Thermo Fisher Scientific) on an Applied Biosystems 7500 Fast Real-Time PCR System. TaqMan assay IDs and primer sequences are listed in Supplementary Tables 5 and 6, available at Carcinogenesis Online. Changes in gene expression are shown as log2 of 2−ΔΔCt compared with the respective untreated controls and normalized to GAPDH as reference gene.
Transfection with siRNAs
SiRNAs (10 nM, scrambled (D001810-15-05, GE Dharmacon), MMP1 (SC- 41552), ESM1 (SC-40543), Santa Cruz Biotechnology, Dallas, TX) and Lipofectamine (RNAiMAX, Thermo Fisher Scientific) were mixed with serum-free RPMI medium in six-well plates and incubated for 30 min before 5-fold volumes of medium (with 10% FBS) containing 1 × 10⁵ cells per well were added. The next day, cells were treated with FGF2 or vehicle.
Pictures were taken 48 h later and analyzed using ImageJ.
Immunohistochemistry
Formalin-fixed, paraffin-embedded tissue specimens (n = 13) from MPM as well as two normal pleura controls were immunostained as described previously (21). Briefly, tissue sections (cut at 4 µM) were deparaffinized and rehydrated. Antigen retrieval was performed for 10 min in 10 mM cit- rate buffer (pH 6.0), and sections were incubated overnight at 4°C with primary antibodies for pERK (#4370, Cell Signaling, Danvers, MA, 1:200) and MMP1 (EP1247Y, Abcam, Cambridge, UK, 1:100). Antibody binding was detected by means of the UltraVision LP detection system (Lab Vision Corporation, Fremont, CA). Representative images (×40) were taken using the Pannoramic Viewer software and a Midi Slide Scanner (Brightfield mode, auto settings, ×40, 3DHistech, Budapest, Hungary). Results were evaluated by an experienced pathologist, and H-scores were calculated as the product percentage of positive tumor cells and staining intensity (0–3).
Statistical analysis
Data are presented as means ± SEM of at least three independent experi- ments performed in duplicates. Statistical significance was calculated with Prism5.0 (GraphPad, San Diego, CA). A P-value of <0.05 was consid- ered significant.
Results
Treatment with FGF2 or EGF induces scattering and morphology changes in MPM cell lines
We have previously observed that FGF2 treatment induced increased MPM cell proliferation and migration, promoted scat- tering and produced a spindle-shaped morphology in M38K and SPC212 cells within 24 h (17). Here, we confirm the phenotypical alterations in three additional cell lines established from biphasic MPM (Figure 1A). We further characterized these morphological alterations in M38K and found significant changes in aspect ratio, circularity of single cells and in the area/circumference ratios of cell clusters, reflecting the elongated, fibroblastoid cell shape and the scattering upon FGF2 treatment, respectively (Figure 1B). We also used the number of contiguous cell clusters per image that we termed ‘scatter score.’ We found that treatment with FGF2 for 5 min is sufficient for scattering and morphology changes to be observable 24 h later (Figure 1C). Similar results were obtained using a recently established light-controlled FGFR1 (Opto- mFGFR1), demonstrating that activation of FGFR1 alone is suffi- cient to induce a shift in cell morphology (Supplementary Figure 1, available at Carcinogenesis Online) (18). FGF2-induced changes occurred in both medium with 10% FBS and serum-free medium (Supplementary Figure 2, available at Carcinogenesis Online).
When additional cytokines previously linked to induction of EMT in other cell types were tested, only EGF but not FGF18, HGF, PDGF, TGFβ or BMP2 induced scattering and comparable morphological alterations in M38K and SPC212 cells (Figure 1D, Supplementary Figure 3, available at Carcinogenesis Online).
The MAPK pathway, but not the PI3K/AKT pathway or TGFβ receptor signaling, is required for scattering and morphology changes
To identify the signaling pathways required for the observed
effects, we pretreated the cells with inhibitors of EMT-related
pathways. As expected, FGFR inhibitors prevented the effects of FGF2 but not those of EGF and vice versa (Figure 1E). Inhibitors of the downstream MAPK pathway prevented effects induced by
FGF2 or EGF, whereas inhibitors of the PI3K/AKT pathway had no effect. Also inhibition of TGFβ receptors, NFκB and FAK did not prevent FGF2-induced effects (Figure 1F). Immunoblotting
Figure 1. FGF2 and EGF induce scattering and morphology changes. (A) Morphology of MPM cell lines 24 h after treatment with FGF2 or vehicle (Co). Scale bar = 100 µm.(B) Quantification of aspect ratio, circularity and ratio between area and circumference of M38K cells with and without FGF2. (C) Scatter score (number of contiguous cell clusters per image) of M38K cells determined 24 h after treatment with FGF2 for the indicating times. (D) Scatter score of M38K cells treated with the indicated cytokines for 24 h. (E) Scatter score of M38K cells treated with the FGFR inhibitors PD166866 (PD), ponatinib (Pon) or nintedanib (Nin) or the EGFR inhibitor erlotinib (Erlo) or DMSO (D) in combination with FGF2 or EGF. Controls (Co) received neither growth factors nor inhibitors. (F) Scatter score of M38K cells treated with the MEK inhibitors UO-126 (UO) or selumetinib (Sel), the AKT inhibitor MK-2206 (MK), the PI3K inhibitor LY-294002 (LY), the TGFβ-receptor inhibitor SB-431542 (SB), the NFκB inhibitor BAY11-7082 (BAY), the FAK inhibitor BI-853520 (BI) or DMSO (D) in combination with FGF2 or EGF. Controls (Co) received neither growth factors nor inhibitors. *P < 0.05, **P < 0.01,
***P < 0.001, treated versus control, one-way ANOVA with Dunnett’s post-test.
confirmed stimulation of ERK phosphorylation by FGF2 and pre- vention by inhibitors of FGFR or MEK (Supplementary Figure 4, available at Carcinogenesis Online).
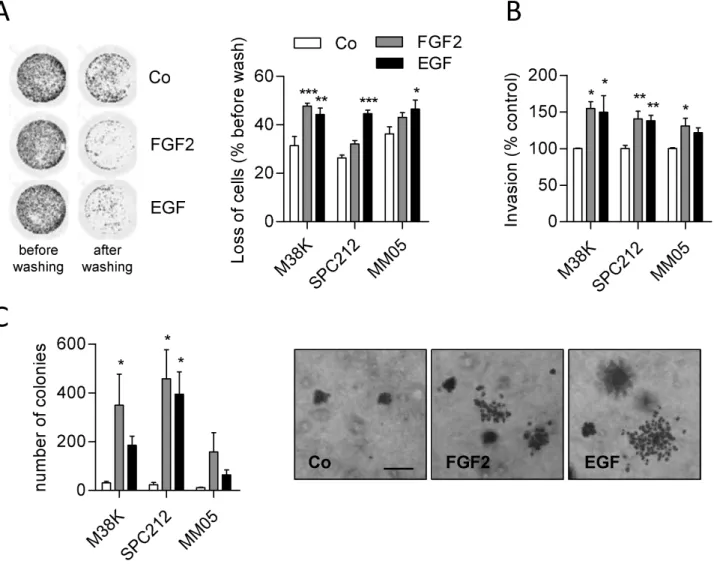
FGF2 or EGF treatment increases invasion and decreases adhesion
Fibroblastoid cell morphology is often accompanied by migra- tory and invasive cell behavior and decreased adhesion (22,23).
Fittingly, FGF2 stimulates migration of M38K and SPC212 cells (17), and we next tested the impact on adhesion to the sub- stratum. Indeed, FGF or EGF led to reduced connection to cul- ture plates 24 h after treatment (Figure 2A) and slowed down the attachment of cells to the plate surface when seeded in growth factor-containing medium (SPC212 and MM05 cells, Supplementary Figure 5, available at Carcinogenesis Online).
Moreover, FGF2 and EGF stimulated invasion through a colla- gen matrix (Figure 2B) and anchorage-independent growth in soft agar (Figure 2C). In SPC212, clones in soft agar also had a more scattered appearance when treated with FGF2 or EGF (Figure 2C).
FGF2 or EGF treatment induces gene expression changes reflecting EMT and histological subtypes of MPM
To investigate gene expression programs underlying the observed morphological and behavioral changes, we used whole genome gene expression microarrays of M38K and SPC212 cells treated with FGF2 or EGF. The expression of 39 genes was regulated (>3-fold) in both cell models by FGF2 and 33 by EGF (Figure 3A). Nineteen genes overlapped all four groups. Changes in microRNA expression were assessed with TLDAs in FGF2- treated M38K and SPC212 cells. Twelve microRNAs were com- monly regulated (>10-fold) in both cell models (Figure 3B).
Categories identified by pathway enrichment analysis to contain multiple regulated genes included transcriptional misregulation in cancer, complement and coagulation cascades and ECM–
receptor interaction (Figure 3C, Supplementary Table 7, available at Carcinogenesis Online). Targets of FGF2-regulated microRNAs were connected to MAPK, Wnt and Hippo signaling and to focal adhesion and tight junctions (Figure 3C, Supplementary Table 8, available at Carcinogenesis Online). In line with the morphological
Figure 2. FGF2 and EGF decrease adhesion and increase invasion and anchorage-independent growth. (A) GFP-expressing M38K, SPC212 and MM05 cells were treated with FGF2 or EGF or vehicle (Co) for 24 h. Cells were washed, and representative images of M38K before and after washing (left) and calculated loss of attached cells (right) are shown. (B) MPM cells were seeded into collagen-coated transwell chambers and treated with FGF2, EGF or vehicle (Co). Cells on the underside of the mem- brane were stained with crystal violet and quantified photometrically. (C) MPM cells were seeded in soft agar and treated with FGF2, EGF or vehicle (Co). The number of colonies was counted (left) and representative images of SPC212 are shown (right). *P < 0.05, **P < 0.01, ***P < 0.001, treated versus control, one-way ANOVA with Dunnett’ post-test. Scale bar = 200 µm.
changes, genes regulated by FGF2 or EGF included several clas- sic EMT markers (Figure 3D). A list of core EMT genes from a meta-analysis of EMT signatures across multiple cell mod- els (24) contained 14 up- and 24 downregulated genes match- ing our microarray data in both M38K and SPC212 cells treated with FGF2 and EGF (Supplementary Tables 9 and 10, available at
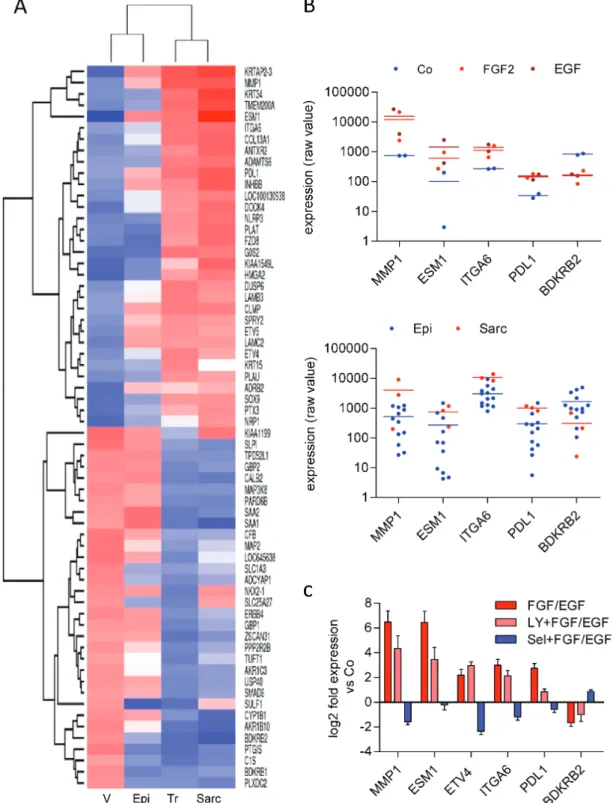
Carcinogenesis Online).Next, we compared the grouped gene signature of all treated samples and their vehicle-treated controls with grouped expres- sion array data of cell lines established from epithelioid (n = 15) and sarcomatoid (n = 3) MPM. In unsupervised clustering, the treated group clustered with the sarcomatoid group and the control group with the group of epithelioid cell lines (Figure 4A).
Genes that were affected by growth factor treatment (>3-fold
Figure 3. Gene expression changes induced by FGF2 and EGF. (A) Venn diagram of genes with >3-fold change in M38K and SPC212 cells treated with FGF2 or EGF for 24 h compared with vehicle-treated controls according to whole genome gene expression microarray data. Genes upregulated by both cytokines in both cell lines are shown in red, genes downregulated are shown in blue. (B) Venn diagram of differentially expressed micro-RNAs (>10-fold) in response to FGF2 in M38K and SPC212 cells compared with vehicle-treated controls according to TLDA data. Micro-RNAs upregulated in both cell lines are shown in red, micro-RNAs downregulated are shown in blue. (C) Biological categories connected to FGF/EGF-induced morphology changes according to pathway enrichment analysis. Categories in the upper part were calcu- lated from differentially expressed genes (P < 0.05, fold change >3) of the gene expression microarray data and overlapping categories in the top 30 from each group are shown. Categories in the lower part were calculated from predicted targets of the microRNAs affected in both cell lines (P < 0.05, fold-change >10) and a selection from the top 30 is shown. (D) Expression changes of the EMT markers LAMC2, ZEB1, VIM and CDH1 were analyzed by qPCR in M38K and SPC212 in response to treatment with FGF2 or EGF compared with vehicle-treated controls. Data were normalized to GAPDH, and means of both cell lines are shown.and
P < 0.05) and, in addition, showed differential expressionbetween epithelioid and sarcomatoid cell lines included brady- kinin receptor B2 (BDKRB2), matrix metalloproteinase 1 (MMP1), integrin subunit alpha 6 (ITGA6), endocan (ESM1) and the
immune checkpoint protein programmed death ligand 1 (PDL1,
CD274) (Figure 4B). Regulation of selected genes by FGF2 or EGFand dependency on downstream pathways was further ana- lyzed in M38K by qPCR. MAPK inhibition resulted in complete
Figure 4. FGF2 and EGF shift gene expression from an epithelioid to a sarcomatoid pattern. (A) Grouped expression profiles of M38K and SPC212 cells treated with FGF2 and EGF (Tr, n = 8) or vehicle (V, n = 4) were subjected to unsupervised clustering with grouped expression profiles of cell lines established from epithelioid (Epi, n = 15) and sarcomatoid (Sarc, n = 3) MPM. The gene list was derived from differentially expressed genes (fold-change >3) of the FGF2 and EGF-treated samples versus vehicle-treated controls. (B) Individual values of selected genes in M38K and SPC212 in the controls and in response to FGF2 or EGF (upper panel) and in cell lines from epithelioid (Epi) and sarcomatoid (Sarc) MPM (lower panel). (C) Expression changes of the indicated genes were analyzed by qPCR in M38K cells treated with FGF2 or EGF alone or in combination with the PI3K inhibitor LY-294002 (LY) or the MEK inhibitor selumetinib (Sel). Data were normalized to GAPDH, and bars represent pooled data of FGF2- and EGF-treated samples versus the respective vehicle-treated controls.
(Figure 4C, Supplementary Figure 6, available at Carcinogenesis Online). Conversely, PI3K inhibition had either minor or similar effects compared with the growth factors themselves.
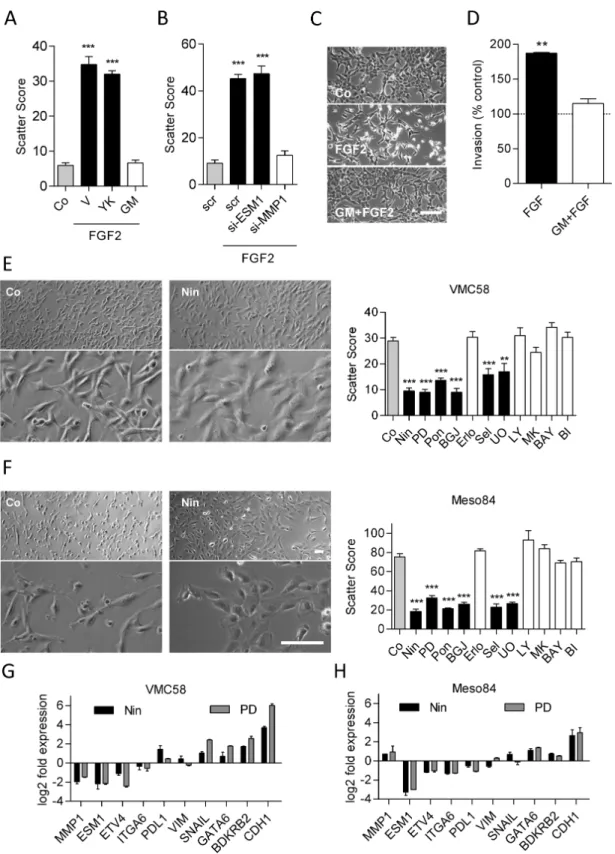
Inhibition or silencing of MMP1 but not of ESM1 or Ets-family transcription factors prevents FGF2- induced scattering
Since MMP1, ESM1 and the Ets-family transcription factor ETV4 were all strongly upregulated concurrent with the morphologi- cal and behavioral changes (Figure 4C, Supplementary Figure 7, available at Carcinogenesis Online), we tested their functional rel- evance in this respect. The pan-MMP inhibitor GM6001 as well as MMP1-targeting siRNA prevented FGF2-induced morphological changes and scattering, while the Ets-family inhibitor YK4-279 or ESM1-targeting siRNA had no effect (Figure 5A–C). GM6001 also prevented FGF2-mediated invasion (Figure 5D).
Inhibition of FGF receptors or the MAPK pathway induces transition to epithelioid cell morphology Since treatment with FGF2 or EGF shifted cell morphology to a more sarcomatoid phenotype, we reasoned that cell lines with fibroblastoid/sarcomatoid morphology in the untreated state might in turn be shifted to a more epithelioid morphology by inhibition of the respective pathways. Fittingly, inhibition of the FGFR axis caused an epithelioid-like shift in VMC58 (biphasic;
Figure 5E) and Meso84 (sarcomatoid; Figure 5F). Similar changes were induced by MEK inhibitors but not by inhibition of PI3K/
Akt, EGFR, NFκB or FAK (Figure 5E and F). The FGFR inhibitor- induced shift towards epithelioid morphology was accompa- nied by strong upregulation of the epithelial marker CDH1 and downregulation of ESM1 and (in VMC58) MMP1, whereas other markers were affected to a lesser degree (Figure 5G and H). The shift toward a more epithelioid morphology in response to FGFR inhibitors was confirmed in Meso62 and Meso 80, two additional cell lines from sarcomatoid MPM (Supplementary Figure 8, avail- able at Carcinogenesis Online).
Sarcomatoid appearance is associated with MAPK- regulated gene expression in MPM cell lines and tissue specimens
To further explore the regulation of gene expression in the context of epithelioid versus sarcomatoid morphology, we compared the response to FGF2, EGF and FGFR inhibitors in cell lines with different morphologies. Generally, mRNAs that were upregulated by growth factors (MMP1, ESM1, ETV4) were strongly repressed by FGFR inhibitors, whereas downregulated mRNAs (BDKRB2, CDH1) were upregulated by FGFR inhibition (Figure 6A). Aligning cells based on aspect ratios revealed that the sarcomatoid phenotype was associated with higher basal ERK phosphorylation (Figure 6B and C) as well as increased lev- els of MMP1, ESM1, ETV4, ITGA6 and PDL1 and decreased lev- els of BDKRB2 (Figure 6D, Supplementary Figure 9, available at
Carcinogenesis Online).We further investigated ESM1/endocan protein expression in human serum samples (n = 32) via ELISA. However, no dif- ferential expression was observed compared with healthy controls or between subtypes (Supplementary Figure 10, avail- able at Carcinogenesis Online). Immunohistochemical analysis of pERK and MMP1 in MPM tissue specimen (n = 13) also revealed no significant difference between histological subtypes due to high heterogeneity of staining between individual samples (data not shown). However, in the four biphasic tumors of that panel,
MMP1 expression in the sarcomatoid compartments compared with the epithelioid compartments (Figure 6E). Normal pleura (n = 2) was weakly positive for MMP1 and negative for pERK (Supplementary Figure 11, available at Carcinogenesis Online).
Finally, when the grouped gene expression profiles of growth factor-treated samples versus the respective vehicle-treated counterparts were compared with published gene expression profiles of tissue samples from sarcomatoid and epithelioid MPM (25), the group of sarcomatoid tumors clustered with the group of growth factor-treated samples, whereas the group of epithelioid tumors clustered with the group of vehicle-treated controls (Supplementary Figure 12, available at Carcinogenesis Online).
Discussion
EMT is a complex cellular program, which can be triggered in a context-dependent way by different signals. The most promi- nent inducers of EMT are TGFβ and additional members of the TGFβ family like BMPs, as well as ligands for receptor tyrosine kinases including EGF, FGFs, HGF or PDGFs (26,27). Cytokine con- centrations inducing EMT in cultured cells (28,29) usually exceed those found in human plasma. However, these cytokines act in a paracrine or autocrine fashion, and active concentrations at the cell surface in vivo are likely to be higher than plasma levels.
In the cell lines from biphasic MPM described here, only FGF2 and EGF, but not TGFβ or BMP2, induced a transition of cell mor- phology and behavior resembling EMT. Moreover, blocking TGFβ receptors did not prevent FGF2- or EGF-induced changes, indi- cating that a contribution from autocrine TGFβ signaling is not required for EMT in these MPM cell lines.
Mesothelial cells originate from the mesoderm, and although they are organized in an epithelioid fashion to form the meso- thelium, they express epithelial as well as mesenchymal pro- teins (30). Transition to a fibroblastoid phenotype, accompanied by changes in gene expression, has been observed in mesothe- lial cells under conditions of tissue damage and repair (30–33).
Consistent with expression of mesenchymal markers in mes- othelial cells, some typical mesenchymal genes like vimentin were expressed in the epithelioid state of our cell lines and showed only minor upregulation during the transition to a sar- comatoid morphology. Likewise, comparison with a list of EMT genes from a meta-analysis of predominantly TGFβ-driven EMT models (24) revealed only a partial overlap with our data. This may be explained by the lack of FGF/EGF-induced EMT models in that list or be due to the mesodermal origin of mesothelial cells.
Cells of the sarcomatoid subtype of MPM (and the sarcoma- toid part in biphasic tumors) have fibroblastoid features, and indeed, immunohistochemical analysis has shown that sarco- matoid MPM displays mesenchymal protein expression patterns, while epithelioid MPM expresses epithelial-like proteins (11–13).
Sarcomatoid MPM confers worse prognosis and is more resistant to therapy (13,34). This suggests that EMT-like reprogramming occurs in sarcomatoid and biphasic MPM and may contribute to a dismal prognosis. The underlying mechanisms, however, have remained largely unexplored so far. Consistent with the changes in cell shape and behavior, pathway enrichment analysis based on our transcriptomic and microRNA screens indicated involve- ment of pathways related to cell–cell and cell–matrix adhesion, cytoskeleton remodeling and growth factor signaling along the MAPK and PI3K pathway. Nevertheless, blocking of the PI3K/
Akt, NFκB and FAK pathways did not prevent EMT induction in
contrast to, for instance, A549 lung adenocarcinoma cells, where
Figure 5. Pathway dependency of the sarcomatoid phenotype. Scatter scores were determined in M38K cells that (A) were treated with the Ets inhibitor YK4-279 (YK), the pan-MMP inhibitor GM6001 (GM) or vehicle (V) in combination with FGF2 and (B) were transfected with siRNAs targeting ESM1, MMP1 or control siRNA (scr) on the day before FGF2 treatment. (C) Representative micrographs of M38K cells treated with GM6001 and FGF2. (D) M38K cells were seeded into collagen-coated transwell chambers, treated with GM6001 (GM) in combination with FGF2 and allowed to invade through the collagen and the porous membrane for 72 h. Morphology (left) of (E) VMC58 cells and (F) Meso84 cells treated with the FGFR inhibitor nintedanib (Nin). Scatter scores (right) of the same cell lines treated with the FGFR inhibitors nin- tedanib, PD-166866 (PD), ponatinib (Pon) or BGJ-398 (BGJ), the EGFR inhibitor erlotinib (Erlo), the MEK inhibitors selumetinib (Sel) and UO-126 (UO), the AKT inhibitor MK-2206 (MK), the PI3K inhibitor LY-294002 (LY), the NFκB inhibitor BAY11-7082 (BAY), the FAK inhibitor BI-853520 (BI) or DMSO as control (Co) for 48 h. VMC58 (G) and Meso84 (H) cells were treated with nintedanib (Nin) or PD-166866 (PD) for 48 h, and expression of the indicated genes was analyzed by qPCR in comparison with vehicle- treated controls. Data were normalized to GAPDH. *P < 0.05, **P < 0.01, ***P < 0.001, treated versus control, one-way ANOVA with Dunnett’s post-test. Scale bar = 100 µm.
TGFβ-induced EMT was blocked by inhibiting the PI3K or the MAPK pathway (35). NFκB and FAK were previously shown to be required for transition to a mesenchymal phenotype in endothe- lial cells (36) and for IGF1R-induced mesenchymal morphology and EMT marker expression in triple negative breast cancer cells (37). Of note, reversal of the fibroblastoid morphology of VMC58
and Meso84 cells was possible only with FGFR/MAPK inhibition,
suggesting that neither EGFR nor PI3K signals contribute to sus-
taining fibroblastoid morphology in these cells. Nintedanib, an
inhibitor of FGFR, VEGFR and PDGFR under clinical evaluation in
MPM (e.g. NCT02568449, NCT02856425), was recently shown to
reverse EMT in an ovarian cancer cell line (38). Another FGFR1
Figure 6. FGF/MAPK-dependent gene expression correlates with sarcomatoid morphology. (A) M38K, SPC212, MM05, VMC58 and Meso84 cells were treated with FGF2, EGF, PD-166866 (PD) or nintedanib (Nin), and gene expression was analyzed by qPCR in comparison with vehicle-treated controls. Data were normalized to GAPDH. (B) Cell lines were ordered with respect to morphology, and aspect ratios were calculated. (C) Basal levels of phospho-ERK, ERK and β-actin in MPM cell lines were ana- lyzed by immunoblotting. (D) Expression of MMP1 was analyzed by qPCR and normalized to GAPDH. (E) H-scores and representative pictures of immunohistochemical stainings of pERK (upper panels) and MMP1 (lower panels) of epithelioid (left) and sarcomatoid (right) compartments in MPM tissue specimens of biphasic MPM. Scale bar = 200 µM.inhibitor, PD173074, induced a shift from spindle- to cobble- stone-like cell morphology in head and neck squamous cell car- cinoma cells (39).
Mesothelioma can also arise from other mesothelial mem- branes, most notably the peritoneal mesothelium. Although rarer than MPM, peritoneal mesothelioma shares the distribu- tion of histological subtypes and their impact on prognosis with its pleural counterpart, thus suggesting that similar mecha- nisms regulating epithelial–mesenchymal plasticity might apply (40). Moreover, inhibition of EMT is considered a promis- ing strategy to combat invasion and metastasis in many addi- tional tumor types including breast and lung cancer, and indeed, several inhibitors that were shown to block or reverse EMT in tumor models are currently evaluated in clinical settings (41).
Notably, genes up- or downregulated by FGF2/EGF showed a clear association with the expression signatures of cell lines and tissue samples from sarcomatoid MPM. This suggests that cell lines established from different histological subtypes of MPM maintain distinct expression profiles in culture and iden- tifies novel gene candidates possibly connected to different subtypes of MPM. Mutations responsible for the differentiation into distinct histological subtypes of MPM during carcinogen- esis are unknown, although recent data suggest that a muta- tion of the TERT promoter is more frequent in sarcomatoid MPM (42). Of note, all cell lines showing morphological altera- tions in response to treatment with FGF2 or EGF in our study originated from non-epithelioid MPM. The other MPM cell lines of our panel did not show EMT-like morphology changes upon FGF2 treatment (Supplementary Figure 13 and Table 11, avail- able at Carcinogenesis Online) despite the presence of fibroblast growth factor receptors (FGFRs) and growth- and migration- promoting effects of FGF2 in some of these cell lines (17). This indicates that stimulation of proliferation, migration and mor- phology changes by FGF2 can occur independently, which is in line with a previous report showing no correlation between proliferation and migration in MPM cell lines (43). Due to lack of genetic traits, it is currently impossible to trace from which compartment of a biphasic tumor-specific cell lines originate.
Our data suggest that cells from non-epithelioid MPM—per- haps by some genetic difference—have higher phenotypic plasticity than cells from epithelioid MPM. It is possible that stimulation with different cytokines or simultaneous stimula- tion with several cytokines would be required to induce EMT in epithelioid cells. This is supported by the observation that two epithelioid cell lines of our panel showed a moderate EMT-like response to TGFβ treatment (Supplementary Table 11, available at Carcinogenesis Online).
Factors linked to EMT and histological subtype in our models included MMP1, ESM1, and ETV4. In line with a previous study (44), we demonstrate MMP1 expression in MPM and suggest that MMP1 causally contributes to sarcomatoid morphology and increased invasiveness. ESM1, which encodes the secreted proteoglycan endocan, is expressed by endothelial cells and was found overexpressed in a number of tumor entities (45). ESM1 was linked to tumor aggressiveness and described as a serum marker in non-small cell lung cancer (46). Despite its obvious regulation by the FGFR/MAPK axis in MPM cell lines, ESM1 was not required for EMT, nor upregulated in the circulation of MPM patients, irrespective of histological subtype. ETV4 is a transcrip- tion factor of the ETS family and was recently linked to EMT and poor prognosis in prostate cancer via the regulation of uroki- nase plasminogen activator (uPA), its receptor (uPAR) and the metalloproteinases MMP2 and MMP9 (47). While ETV4 showed
a clear correlation with sarcomatoid morphology in MPM cell models, inhibition of ETS-family transcription factors alone was unable to block the FGF2-induced morphology transition.
Notably, one of the genes most strongly upregulated by both FGF2 and EGF and repressed by inhibition of the MAPK axis was PDL1, which is the target of immune checkpoint modula- tors (48). In MPM, PDL1 is associated with sarcomatoid histol- ogy and gene expression signature (49,50). Consequently, FGFR/
EGFR/MAPK dependency of PDL1 expression should be kept in mind when considering therapies that combine MAPK pathway inhibitors with immune checkpoint modulators targeting the PD1/PDL1 axis.
In summary, our data shed new light on the phenotypic plas- ticity of MPM cells and suggest MAPK/MMP1 signals as impor- tant drivers of sarcomatoid morphology and gene expression in MPM.
Supplementary material
Supplementary Tables 1–11 and Figures 1–13 can be found at
Carcinogenesis online.Funding
This work was supported by the Anniversary Fund (No. 14574 to M.A.H., No. 16912 to M.G.) of the Austrian National Bank (OeNB), the Fund of the City of Vienna for Innovative Interdisciplinary Cancer Research (M.A.H., M.G.), the Hans and Blanca Moser Foundation (M.A.H.), the Herzfelder Foundation (M.A.H., M.G.) and the ‘Initiative Krebsforschung’ of the Medical University of Vienna (W.B., M.G.).
Acknowledgements
We thank B. Peter-Vörösmarty for excellent technical assis- tance, M. Eisenbauer and A. Wagner for help with establishing VMC and Meso cell lines, R. Stahel for SPC111 and SPC212 cells, K. Grankvist for P31, A. Catania for I2, V.L. Kinnula for M38K and the University of Queensland Thoracic Research Centre (The Prince Charles Hospital, Brisbane, Australia) for MM05 cells.
Conflict of Interest Statement: None declared.
References
1. Jaurand, M.C. et al. (2005) Pathogenesis of malignant pleural mesothe- lioma. Respirology, 10, 2–8.
2. Stayner, L. et al. (2013) The worldwide pandemic of asbestos-related diseases. Annu. Rev. Public Health, 34, 205–216.
3. Robinson, B.M. (2012) Malignant pleural mesothelioma: an epidemio- logical perspective. Ann. Cardiothorac. Surg., 1, 491–496.
4. Tsao, A.S. et al. (2009) Malignant pleural mesothelioma. J. Clin. Oncol., 27, 2081–2090.
5. Curran, D. et al. (1998) Prognostic factors in patients with pleural meso- thelioma: the European Organization for Research and Treatment of Cancer experience. J. Clin. Oncol., 16, 145–152.
6. Meyerhoff, R.R. et al. (2015) Impact of mesothelioma histologic subtype on outcomes in the Surveillance, Epidemiology, and End Results data- base. J. Surg. Res., 196, 23–32.
7. Fennell, D.A. et al. (2008) Advances in the systemic therapy of malig- nant pleural mesothelioma. Nat. Clin. Pract. Oncol., 5, 136–147.
8. de Perrot, M. et al. (2009) Trimodality therapy with induction chemo- therapy followed by extrapleural pneumonectomy and adjuvant high- dose hemithoracic radiation for malignant pleural mesothelioma. J.
Clin. Oncol., 27, 1413–1418.
9. Doi, T. et al. (2011) MT1-MMP plays an important role in an invasive activity of malignant pleural mesothelioma cell. Exp. Mol. Pathol., 90, 91–96.
mesothelioma. Cancer Treat. Rev., 37, 543–558.
11. Fassina, A. et al. (2012) Epithelial-mesenchymal transition in malignant mesothelioma. Mod. Pathol., 25, 86–99.
12. Kobayashi, M. et al. (2013) Snail expression is associated with a poor prognosis in malignant pleural mesotheliomas. Ann. Thorac. Surg., 95, 1181–1188.
13. Schramm, A. et al. (2010) Prognostic significance of epithelial- mesenchymal transition in malignant pleural mesothelioma. Eur.
J. Cardiothorac. Surg., 37, 566–572.
14. Lamouille, S. et al. (2014) Molecular mechanisms of epithelial-mesen- chymal transition. Nat. Rev. Mol. Cell Biol., 15, 178–196.
15. de Reyniès, A. et al. (2014) Molecular classification of malignant pleural mesothelioma: identification of a poor prognosis subgroup linked to the epithelial-to-mesenchymal transition. Clin. Cancer Res., 20, 1323–1334.
16. Grotegut, S. et al. (2006) Hepatocyte growth factor induces cell scatter- ing through MAPK/Egr-1-mediated upregulation of Snail. EMBO J., 25, 3534–3545.
17. Schelch, K. et al. (2014) Fibroblast growth factor receptor inhibition is active against mesothelioma and synergizes with radio- and chemo- therapy. Am. J. Respir. Crit. Care Med., 190, 763–772.
18. Grusch, M. et al. (2014) Spatio-temporally precise activation of engi- neered receptor tyrosine kinases by light. EMBO J., 33, 1713–1726.
19. Zipin, A. et al. (2004) Tumor-microenvironment interactions: the fucose-generating FX enzyme controls adhesive properties of colorec- tal cancer cells. Cancer Res., 64, 6571–6578.
20. Reid, G. et al. (2013) Restoring expression of miR-16: a novel approach to therapy for malignant pleural mesothelioma. Ann. Oncol., 24, 3128–3135.
21. Hoda, M.A. et al. (2011) Temsirolimus inhibits malignant pleural meso- thelioma growth in vitro and in vivo: synergism with chemotherapy. J.
Thorac. Oncol., 6, 852–863.
22. Yilmaz, M. et al. (2009) EMT, the cytoskeleton, and cancer cell invasion.
Cancer Metastasis Rev., 28, 15–33.
23. Laszlo, V. et al. (2015) Epigenetic down-regulation of integrin α7 increases migratory potential and confers poor prognosis in malignant pleural mesothelioma. J. Pathol., 237, 203–214.
24. Gröger, C.J. et al. (2012) Meta-analysis of gene expression signatures defining the epithelial to mesenchymal transition during cancer pro- gression. PLoS One, 7, e51136.
25. De Rienzo, A. et al. (2013) Sequential binary gene ratio tests define a novel molecular diagnostic strategy for malignant pleural mesothe- lioma. Clin. Cancer Res., 19, 2493–2502.
26. Lee, K. et al. (2012) New insights into the regulation of epithelial-mes- enchymal transition and tissue fibrosis. Int. Rev. Cell Mol. Biol., 294, 171–221.
27. Tiwari, N. et al. (2012) EMT as the ultimate survival mechanism of can- cer cells. Semin. Cancer Biol., 22, 194–207.
28. Buonato, J.M. et al. (2015) EGF augments TGFβ-induced epithelial-mes- enchymal transition by promoting SHP2 binding to GAB1. J. Cell Sci., 128, 3898–3909.
29. Sakuma, K. et al. (2012) Transcription factors c-Myc and CDX2 medi- ate E-selectin ligand expression in colon cancer cells undergoing EGF/
bFGF-induced epithelial-mesenchymal transition. Proc. Natl. Acad. Sci.
USA, 109, 7776–7781.
30. Mutsaers, S.E. (2004) The mesothelial cell. Int. J. Biochem. Cell Biol., 36, 9–16.
in tissue engineering. Int. J. Biochem. Cell Biol., 36, 621–642.
32. Yanez-Mo, M. et al. (2003) Peritoneal dialysis and epithelial-to-mesen- chymal transition of mesothelial cells. N. Engl. J. Med., 348, 403–413.
33. Karki, S. et al. (2014) Wilms’ tumor 1 (Wt1) regulates pleural mesothelial cell plasticity and transition into myofibroblasts in idiopathic pulmo- nary fibrosis. FASEB J., 28, 1122–1131.
34. Pass, H.I. (2001) Malignant pleural mesothelioma: surgical roles and novel therapies. Clin. Lung Cancer, 3, 102–117.
35. Chen, X.F. et al. (2012) Transforming growth factor-β1 induces epithe- lial-to-mesenchymal transition in human lung cancer cells via PI3K/
Akt and MEK/Erk1/2 signaling pathways. Mol. Biol. Rep., 39, 3549–3556.
36. Maleszewska, M. et al. (2013) IL-1β and TGFβ2 synergistically induce endothelial to mesenchymal transition in an NFκB-dependent man- ner. Immunobiology, 218, 443–454.
37. Taliaferro-Smith, L. et al. (2015) FAK activation is required for IGF1R- mediated regulation of EMT, migration, and invasion in mesenchymal triple negative breast cancer cells. Oncotarget, 6, 4757–4772.
38. Huang, R.Y. et al. (2015) Functional relevance of a six mesenchymal gene signature in epithelial-mesenchymal transition (EMT) reversal by the triple angiokinase inhibitor, nintedanib (BIBF1120). Oncotarget, 6, 22098–22113.
39. Nguyen, P.T. et al. (2013) The FGFR1 inhibitor PD173074 induces mesen- chymal-epithelial transition through the transcription factor AP-1. Br.
J. Cancer, 109, 2248–2258.
40. Kim, J. et al. (2017) Malignant peritoneal mesothelioma: a review. Ann.
Transl. Med., 5, 236.
41. Bhatia, S. et al. (2017) Targeting epithelial-mesenchymal plasticity in cancer: clinical and preclinical advances in therapy and monitoring.
Biochem. J., 474, 3269–3306.
42. Tallet, A. et al. (2014) Overexpression and promoter mutation of the TERT gene in malignant pleural mesothelioma. Oncogene, 33, 3748–3752.
43. Garay, T. et al. (2013) Cell migration or cytokinesis and proliferation?—
revisiting the “go or grow” hypothesis in cancer cells in vitro. Exp. Cell Res., 319, 3094–3103.
44. Hirano, H. et al. (2002) Expression of matrix metalloproteinases, tissue inhibitors of metalloproteinase, collagens, and Ki67 antigen in pleu- ral malignant mesothelioma: an immunohistochemical and electron microscopic study. Med. Electron Microsc., 35, 16–23.
45. Sarrazin, S. et al. (2006) Endocan or endothelial cell specific molecule-1 (ESM-1): a potential novel endothelial cell marker and a new target for cancer therapy. Biochim. Biophys. Acta, 1765, 25–37.
46. Grigoriu, B.D. et al. (2006) Endocan expression and relationship with survival in human non-small cell lung cancer. Clin. Cancer Res., 12, 4575–4582.
47. Qi, M. et al. (2015) Overexpression of ETV4 is associated with poor prog- nosis in prostate cancer: involvement of uPA/uPAR and MMPs. Tumour Biol., 36, 3565–3572.
48. Yao, S. et al. (2013) Advances in targeting cell surface signalling mol- ecules for immune modulation. Nat. Rev. Drug Discov., 12, 130–146.
49. Mansfield, A.S. et al. (2014) B7-H1 expression in malignant pleural mes- othelioma is associated with sarcomatoid histology and poor progno- sis. J. Thorac. Oncol., 9, 1036–1040.
50. Bueno, R. et al. (2016) Comprehensive genomic analysis of malignant pleural mesothelioma identifies recurrent mutations, gene fusions and splicing alterations. Nat. Genet., 48, 407–416.